O R I G I N A L A R T I C L E
Open Access
Reliability of Physiological Responses
Induced by Basic Emotions: A Pilot Study
Eun-Hye Jang
1, Sangwon Byun
2*†, Mi-Sook Park
3and Jin-Hun Sohn
4*†Abstract
Background:Although emotion-specific autonomic responses based on the discrete theory of emotion have been widely studied, studies on the reliability of physiological responses to emotional stimuli are limited. In this study, we aimed to assess the reliability of physiological changes induced by the six basic emotions (happiness, sadness, anger, fear, disgust, and surprise) that were measured during 10 weekly repeated experiments.
Methods:Twelve college students participated, and in each experiment, physiological signals were collected before and while participants were watching emotion-provoking film clips. Additionally, the participants self-evaluated the emotions that they experienced during the film presentation at the end of each emotional stimulus. To avoid adaptation of participants to identical stimuli during repeated measurements, we used 10 different film clips for each emotion, and thus a total of 60 film clips over 10 weeks were used. Physiological features, such as skin conductance level (SCL), fingertip temperature (FT), heart rate (HR), and blood volume pulse (BVP), were extracted from the physiological signals. Two reliability indices, Cronbach’s alpha and intraclass correlation coefficient, were calculated from the physiological features to assess internal consistency and interrater reliability, respectively. Results:We found that SCL, HR, and BVP measured during the emotion-provoking phase over the 10 weekly sessions were more reliable than those assessed at baseline. Furthermore, SCL, HR, and BVP from the emotion-provoking phase exhibited excellent internal consistency and interrater reliability.
Conclusions:Our findings suggest that these features can be used as reliable physiological indices in emotion studies. The results also support the significance of physiological signals as meaningful indicators for emotion recognition in HCI (human computer interface) area.
Keywords:Emotion, Physiological responses, Consistency, Reliability, Autonomic nervous system
Background
Physiological and behavioral changes are fundamental aspects of emotions, and emotions therefore cannot be simply interpreted as “feelings” or mental states [1]. Autonomic responses in emotions have been an active research topic since Cannon [2] first reported the physi-ology of emotions [3, 4]. Autonomic nervous system (ANS) activity has been viewed as a major component of emotion response in many recent theories of emotion [4]. Cacioppo and colleagues [5, 6] reported reliable
differences in autonomic responses between specific emotions, that is, autonomic emotion specificity. They also noted context-specific effects of ANS activity in emotion, which were related to different induction para-digms [5, 6]. Furthermore, ANS responses exhibited more consistent valence-specific patterns than emotion-specific patterns: negative emotions were accompanied by stronger autonomic responses than positive emotions [4].
As emotion-specific ANS responses have been widely studied (see Kreibig’s review article [4]), previous studies have attempted to assess the reliability of physiological responses induced by basic emotions [7]. For example, the temporal stability of physiological responses [8–13] and the reliability of event-related desynchronization in EEGs [14, 15] have been studied. Typically, intervals of
© The Author(s). 2019Open Access This article is distributed under the terms of the Creative Commons Attribution 4.0 International License (http://creativecommons.org/licenses/by/4.0/), which permits unrestricted use, distribution, and reproduction in any medium, provided you give appropriate credit to the original author(s) and the source, provide a link to the Creative Commons license, and indicate if changes were made. The Creative Commons Public Domain Dedication waiver (http://creativecommons.org/publicdomain/zero/1.0/) applies to the data made available in this article, unless otherwise stated.
* Correspondence:[email protected];[email protected]
†Sangwon Byun and Jin-Hun Sohn contributed equally to this work.
2
Department of Electronics Engineering, Incheon National University, 119 Academy-ro, Yeonsu-gu, Incheon, Republic of Korea
4Department of Psychology, Brain Research Institute, Chungnam National
2–4 weeks were introduced between test-retest experi-ments to measure the stability and consistency of physiological responses [16–19]. Various other bio-markers, including blinking responses, respiratory sinus arrhythmia, heartbeat period, salivary cortisol, and startle response, have also been tested [16–19]. However, most of these studies relied on a single repeat (test-retest) and used an identical stimulus for emotion elicitation, which may complicate the interpretation of results. Repeated measurements with the same stimulus may be affected by adaptation of participants to stimuli or learning ef-fects (e.g., habituation). Furthermore, consistency over a relatively long period has not been evaluated.
In most studies on autonomic specificity of basic emo-tions, the direction of changes in ANS activity was eval-uated as the difference between the baseline measurement and emotional condition [4], in which the baseline activity was used as a reference for observing state change in psychophysiological responses [20]. Since the quality of the baseline data against which autonomic change is evaluated relies on the methodology, previous studies have developed baseline calibration techniques for establishing an appropriate baseline, which would en-able relien-able assessment of psychophysiological changes during emotional state [21]. However, intra- and interin-dividual variations in the baseline level have not been studied separately. In particular, intraindividual varia-tions in the baseline have been implicitly assumed to be not substantial.
Therefore, we aimed to examine the consistency of physiological responses that are measured multiple times over a relatively long period, using non-identical stimuli. We evaluated skin conductance level (SCL) and heart rate (HR), which are the most frequently reported mea-sures of autonomic function [14]. We also measured fingertip temperature (FT) [22] and blood volume pulse (BVP) [23,24] as additional indicators of the ANS activ-ity. Based on these physiological measurements, we eval-uated the consistency of baseline activity and autonomic responses related to six basic emotions (happiness, sad-ness, anger, fear, disgust, and surprise) during 10 weekly sessions. We hypothesized that physiological responses would show high consistency in both the baseline and emotional phases.
Methods Participants
Twelve healthy subjects between 19 and 23 years of age (6 males and 6 females, mean age ± SD, 21.0 ± 1.98) par-ticipated in the 10-week longitudinal study. None of the participants reported any history of psychiatric, neuro-logical, or pulmonary disorders, or use of medication that would affect the peripheral or central nervous sys-tem. All participants provided written informed consent
before the experiment began and received US$20 per session as a reward for their participation. The study was approved by the Institutional Review Committee of Chungnam National University (No. 201309-SB-004-01).
Emotion-provoking stimuli
We used film clips as emotional stimuli to provoke six basic emotions, since they are among the most effective stimuli to elicit affective responses in an experimental la-boratory [25–28]. Film stimuli are dynamic media that provide visual and auditory input simultaneously, which contain more information relevant to the development of integrated and sustained emotional responses com-pared with still pictures (e.g., International Affective Pic-ture System; IAPS), which elicit only short-lived affective responses [25–28]. Therefore, presenting film stimuli is an ecologically valid methodology to induce different affective states [25–28]. Additionally, they can evoke pat-terned psychophysiological responses, which may help to identify changes in the ANS during emotion elicitation [28].
A total of 60 film clips (10 clips per emotion) were excerpted from a variety of movies and TV programs, including documentaries and dramas (Table1). Each clip was 2–4-min long. These film clips were used in our previous study and effectively induced the intended emotions in participants [29]. The stimuli were counter-balanced to minimize order effects.
Psychological measurements
Psychological responses of each participant were assessed by a self-rating questionnaire used in our previ-ous study [29]. This includes three questions. First, par-ticipants were asked to label what specific emotion they had experienced during exposure to each stimulus. They selected one of seven choices: happiness, sadness, anger, fear, disgust, surprise, and not applicable. Second, partic-ipants evaluated the emotion’s intensity, which reflected how strongly they felt the emotion during presentation of the stimulus, using an 11-point Likert scale, ranging from 1 (weakest) to 11 (strongest) [30]. Finally, the par-ticipants described the scene in which they felt the strongest emotion during exposure to each stimulus.
emotion’s intensity. The third question was used to de-termine the interval in the emotion-provoking phase, in which physiological data were analyzed (Fig.1).
Procedure
The experiment was conducted in a soundproof room, which reduced noise by at least 35 dB, to block outside noises or artifacts. Participants sat on a comfortable chair placed 2 m away from a 38-in TV monitor located in the center of the room. Prior to the experiment, elec-trodes for acquiring physiological signals were placed on participants’ wrists, fingers, and ankle. Alcohol swabs and cotton pads were used to clean skin surfaces before attachment. The measurement began with a 60-s base-line phase, during which physiological signals were re-corded and without any emotional stimulus (a blue screen presented without an auditory stimulus). Then, participants were presented with an emotion-provoking stimulus for 2–4 min. After the film clip presentation, they were asked to complete the three questions de-scribed above [28]. After the ratings, they were given 2
min to allow recovery of their emotional state. Then, the measurement started with a new baseline again. This cycle of baseline phase, emotion-provoking phase, self-ratings, and recovery was repeated six times for each emotion. The order of stimuli was randomized for each participant. Total length of the experiment was ~ 1.5 h. Previous studies on emotion-specific ANS responses have used a separate neutral stimulus as a control condi-tion. However, baseline measurement without any stimulus has also been used when a neutral stimulus is not favorable. We decided not to use a neutral film as a control since presenting a film clip itself can induce un-desirable emotion elicitation in participants. Instead, we used a blue screen without any auditory stimulus during the baseline measurement.
The same experimental procedure was repeated 10 times on a weekly basis for each participant. To control the factors that could affect the baseline physiological re-sponses, we contacted the participants by telephone a day before the scheduled experiment and instructed them to avoid smoking and consuming alcohol and
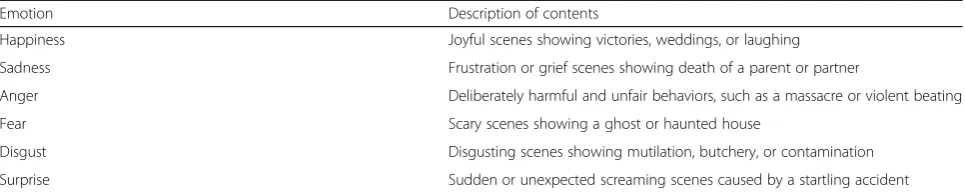
Table 1Description of the emotion-provoking film clips
Emotion Description of contents
Happiness Joyful scenes showing victories, weddings, or laughing
Sadness Frustration or grief scenes showing death of a parent or partner
Anger Deliberately harmful and unfair behaviors, such as a massacre or violent beating
Fear Scary scenes showing a ghost or haunted house
Disgust Disgusting scenes showing mutilation, butchery, or contamination
Surprise Sudden or unexpected screaming scenes caused by a startling accident
caffeine after 8 pm. They were also asked to get suffi-cient sleep. Furthermore, the experiment was repeated over 10 weeks at the same time during working hours (10 am–3 pm) and on the same day of the week for each participant. We changed film clips used for each emo-tion every week to avoid habituating participants by re-peating the same stimulus. Therefore, 10 different film clips were prepared for each emotion, and a total of 60 film clips were used for 10 weeks.
Physiological measurement
We used the MP100WS system (Biopac Systems Inc., USA) to measure electrodermal activity (EDA), electro-cardiogram (ECG), fingertip temperature (FT), and blood pulse volume (BVP). Display of recorded signals and data analysis were performed with AcqKnowledge software version 3.9.1 (Biopac Systems Inc., USA). An example of physiological data acquired before and dur-ing a fearful stimulus is shown in Fig.1.
The EDA signal was recorded using an EDA100C amplifier, which applies a constant voltage (0.5 V) be-tween two electrodes to measure skin conductance. The amplifier was connected to a set of TSD203 electrodes, which were attached to the palmar surfaces of the mid-dle phalanges of the first and second fingers of the non-dominant hand. The electrodes were filled with Elec-trode Paste EC33 (Grass Technologies, USA). Sampling rate was 200 Hz. After movement and electrode contact artifacts removed, skin conductance level (SCL, in μS) was calculated by averaging skin conductance signals for a 30-s interval that was determined by the self-rating questionnaire.
The ECG signal was recorded using an ECG100 ampli-fier, LEAD110S electrode leads, and EL503 electrodes. A lead I configuration was used for ECG measurement, in which three electrodes were attached to the bilateral wrists and left ankle. Sampling rate was 200 Hz. Heart rate (HR, in beats per minute) was analyzed using Acq-Knowledge, which detected R-waves in the ECG signals and calculated consecutive R–R intervals. Finally, the mean HR (meanHR) was calculated by averaging HR values for the 30-s interval.
The FT signal was recorded using an FT100C ampli-fier and TSD202 temperature probe. The probe was at-tached to the volar surface of the distal phalanx of the little finger of the non-dominant hand. The mean FT (meanFT) was calculated by averaging FT values for the 30-s interval.
The BVP signal was recorded using a PPG100C ampli-fier and TSD200 transducer, which measured infrared reflectance of varying blood flow from the volar surface of the distal phalanx of the thumb of the non-dominant hand. Sampling rate was 200 Hz. The mean BVP
(meanBVP) was calculated by averaging BVP signals for the 30-s interval.
As a result, total four physiological features, SCL, meanHR, meanFT, and meanBVP, were extracted from the measurement and used for data analysis.
Data analysis
All statistical analyses were performed using SPSS soft-ware version 18.0 (SPSS-IBM, Chicago, IL, USA). As psychological responses, the appropriateness and effect-iveness of each emotion were evaluated by averaging 12 participants’ ratings. To analyze physiological signals, a 30-s interval was selected from the total length for the baseline and each emotion-provoking phase. For the baseline, the final 30 s was used [29]. For the emotion-provoking phase, the interval was selected based on the participants’ ratings. The participants described the scene in which they felt the strongest emotion during exposure to each stimulus. For example, a participant re-ported that she felt disgusted while watching the scene of a man putting his hand inside a dirty toilet, and we analyzed the 30-s interval (26–55 s) containing this scene. Physiological features during this interval were evaluated as described above. We excluded the physio-logical data from participants who failed to elicit the tar-geted emotion during the analysis.
We adopted the most frequently used method for the measurement and analysis of emotion-specific ANS re-sponse. In particular, in most previous studies, the 30-or 60-s interval immediately bef30-ore the stimulus presen-tation has been selected as a baseline phase [4]. Other common intervals are 1/2-, 10-, 120-, 180-, and 300-s in-tervals. In addition, the averaging period did not influ-ence the reported pattern of physiological responses [4], suggesting that a 30-s interval before the start of the stimulus can be considered as an appropriate baseline measurement. However, we cannot completely exclude the effect of anticipation of the stimuli on variations dur-ing the baseline.
We assessed the internal reliability of physiological re-sponses observed during the 10 sessions, using Cron-bach’s alpha and intraclass correlation coefficient (ICC). Cronbach’s alpha is widely used to evaluate internal consistency [31], which is defined as
α¼kk−
1 1− P s2 i s2 T ;
wherekis the number of sessions,s2i is the variance of the ith session, and s2
strongly units in the same group resemble each other. The ICC coefficient is defined as
ρ¼ MSR−MSE
MSRþðk−1ÞMSE;
where MSR is mean square for rows of raters or mea-surements, MSEis mean square for error, andkis num-ber of raters or measurements. ICC estimates and their 95% confidence intervals were calculated based on the model of single rater/measurement, consistency, and 2-way mixed-effects. Reliability indices less than 0.50 are indicative of poor reliability, values between 0.50 and 0.75 indicate moderate reliability, values between 0.75 and 0.90 indicate good reliability, and values greater than 0.90 indicate excellent reliability [32].
We compared physiological responses between the baseline and emotion-provoking phases using the Wil-coxon test since the Shapiro-Wilk test revealed that physiological features were not normally distributed. For this statistical test, we used all data (10 trials × 12 sub-jects), except for data from participants who failed to elicit the targeted emotion, which were excluded in the calculation. Therefore, the amount of data used in the analysis was not identical for all conditions. For example, in the happiness condition, we evaluated data from 11 subjects for the eighth and tenth sessions because one subject failed to report the intended emotion during these sessions. For the remainder of the sessions, data from all 12 subjects were included in the calculation.
Results
Validity of psychological responses
Psychological responses to emotional stimuli were assessed by their appropriateness and effectiveness
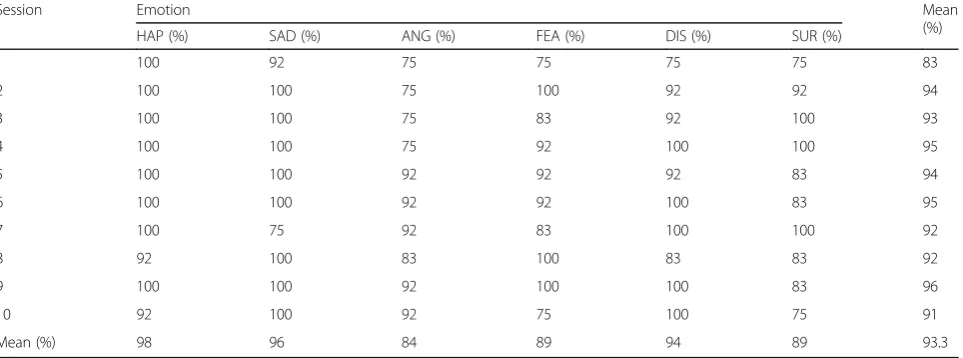
(Tables 2 and 3). The mean appropriateness of each emotion ranged from 75 to 100%, and the overall mean appropriateness from all the sessions and emotions was 93.3% (Table2). These results suggest that the film clips were valid stimuli for provoking the intended emotions. The mean appropriateness was higher in happiness, sad-ness, and disgust, compared with anger, fear, and sur-prise. The mean effectiveness of each emotion ranged from 8.4 to 10.8 points, and the overall mean effective-ness from all the sessions and emotions was 9.4 points (Table 3). These results also suggest that our stimuli ef-fectively provoked strong emotions.
Reliability of psychological responses
We analyzed reliability of physiological responses to emotional stimuli using Cronbach’s alpha and ICC. Reli-ability indices for the six emotions are summarized in Table 4 (Additional file 1: Tables S1–S6), which also present the descriptive statistics (mean and standard de-viation) of physiological responses during the baseline and emotion-provoking phases. Cronbach’s alphas from baseline measurement ranged from 0.13 to 0.79, and those from emotion-provoking phases ranged from 0.39 to 0.96. Interestingly, when Cronbach’s alphas from the baseline and emotion-provoking phases of the same physiological feature and same emotional stimulus were compared, Cronbach’s alpha was always higher in the emotion-provoking phase than in the baseline, except meanFT during happiness. ICC values from the baseline measurements ranged from 0.10 to 0.70, and those from emotion-provoking phases ranged from 0.38 to 0.96. Similarly, ICC was always higher in the emotion-provoking phase than in the baseline of the same physio-logical feature and same emotional stimulus, except meanFT during happiness emotion. In particular,
Table 2Mean appropriateness from participants’ratings
Session Emotion Mean
(%)
HAP (%) SAD (%) ANG (%) FEA (%) DIS (%) SUR (%)
1 100 92 75 75 75 75 83
2 100 100 75 100 92 92 94
3 100 100 75 83 92 100 93
4 100 100 75 92 100 100 95
5 100 100 92 92 92 83 94
6 100 100 92 92 100 83 95
7 100 75 92 83 100 100 92
8 92 100 83 100 83 83 92
9 100 100 92 100 100 83 96
10 92 100 92 75 100 75 91
Mean (%) 98 96 84 89 94 89 93.3
HAP, happiness;SAD, sadness;ANG, anger;FEA, fear;DIS, disgust;SUR, surprise
Cronbach’s alpha and ICC of SCL, meanHR, and meanBVP from emotion-provoking phases were higher than 0.90 for all emotional conditions.
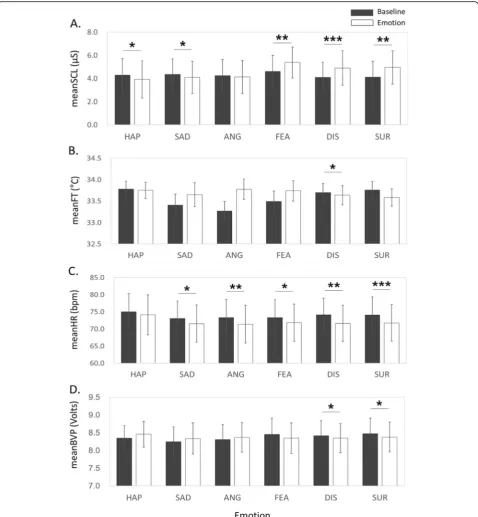
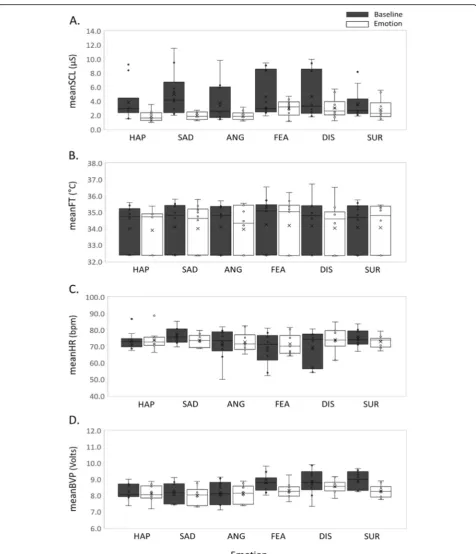
Figure 2 shows group level comparisons of physio-logical features between the baseline and emotion-provoking phases. There were significant differences in the SCL between the two phases in all emotion condi-tions except for anger; the SCL significantly decreased in
the happiness and sad conditions but increased in the fear, disgust, and surprise conditions. The meanFT sig-nificantly decreased compared with the baseline during disgust emotion. The meanHR significantly decreased during all emotion-provoking phases, except for happi-ness, compared with the baseline. The meanBVP signifi-cantly decreased during disgust and surprise emotions compared with the baseline.
Table 3Mean effectiveness from participants’ratings
Session Emotion Mean
HAP SAD ANG FEA DIS SUR
1 8.4 ± 1.07 9.5 ± 1.36 9.7 ± 1.88 10 ± 0.85 10.2 ± 0.95 9.3 ± 1.55 9.5 ± 1.28
2 8.9 ± 1.30 9.1 ± 1.50 9.9 ± 1.07 9.9 ± 1.31 10.8 ± 1.08 9.7 ± 1.38 9.6 ± 1.27
3 8.8 ± 1.31 8.7 ± 1.38 9.7 ± 1.54 9.8 ± 1.71 9.9 ± 1.34 9.7 ± 1.35 9.3 ± 1.44
4 9.6 ± 1.17 9.7 ± 1.08 9.5 ± 1.16 9.6 ± 1.61 10.4 ± 1.04 9.9 ± 1.44 9.7 ± 1.25
5 9.6 ± 1.24 9.3 ± 1.07 9.8 ± 1.68 9.7 ± 1.82 9.7 ± 1.27 9.6 ± 1.50 9.6 ± 1.43
6 9.3 ± 1.49 9.3 ± 0.95 9.4 ± 1.47 9.7 ± 1.08 10.3 ± 0.93 9.6 ± 1.29 9.5 ± 1.20
7 9.3 ± 1.23 8.9 ± 1.48 8.9 ± 1.31 9.6 ± 1.24 9.3 ± 1.31 9.5 ± 1.16 9.3 ± 1.29
8 8.4 ± 1.34 9.1 ± 0.90 9.2 ± 1.07 9.3 ± 1.51 10.2 ± 0.97 9.4 ± 1.38 9.2 ± 1.20
9 9.7 ± 1.51 9.2 ± 1.62 9.5 ± 1.82 9.3 ± 1.08 10.1 ± 1.21 8.6 ± 1.54 9.4 ± 1.46
10 8.8 ± 1.42 9.3 ± 1.48 9.7 ± 1.07 8.7 ± 1.44 10.1 ± 1.16 10.3 ± 0.96 9.5 ± 1.26
Mean 9.1 ± 1.31 9.2 ± 1.28 9.5 ± 1.41 9.6 ± 1.37 10.1 ± 1.13 9.5 ± 1.36 9.4 ± 1.31
HAP, happiness;SAD, sadness;ANG, anger;FEA, fear;DIS, disgust;SUR, surprise
Table 4Physiological responses and their reliability indices from the baseline and emotion-provoking phases of all emotional conditions
Emotion SCL (μS) meanFT (°C) meanHR (bpm) meanBVP (V)
Baseline Emotion Baseline Emotion Baseline Emotion Baseline Emotion
HAP Mean 4.3 ± 2.86 3.9 ± 3.21 34.0 ± 0.36 33.9 ± 0.38 74.9 ± 10.68 74.1 ± 11.72 8.4 ± 0.70 8.5 ± 0.72
α .61 .95 .69 .69 .44 .92 .63 .95
ρ .59. .95 .69 .69 .38 .91 .67 .95
SAD Mean 4.4 ± 2.71 4.1 ± 2.79 33.9 ± 0.51 34.0 ± 0.56 73.0 ± 10.18 71.6 ± 10.88 8.3 ± 0.83 8.3 ± 0.88
α .63 .95 .36 .54 .48 .96 .57 .96
ρ .54 .94 .35 .54 .44 .96 .63 .96
ANG Mean 4.2 ± 2.81 4.1 ± 2.88 33.9 ± 0.46 34.0 ± 0.47 73.3 ± 10.53 71.4 ± 11.05 8.3 ± 0.84 8.4 ± 0.83
α .47 .96 .57 .61 .26 .96 .41 .96
ρ .40 .96 .56 .60 .10 .95 .45 .96
FEA Mean 4.6 ± 2.80 5.4 ± 2.68 34.0 ± 0.49 34.0 ± 0.48 73.3 ± 10.46 71.9 ± 10.87 8.5 ± 0.92 8.3 ± 0.86
α .34 .91 .52 .62 .50 .94 .56 .96
ρ .30 .91 .52 .61 .40 .94 .56 .96
DIS Mean 4.1 ± 2.58 4.9 ± 2.99 34.0 ± 0.42 33.9 ± 0.45 74.1 ± 9.74 71.6 ± 10.54 8.4 ± 0.84 8.3 ± 0.82
α .57 .94 .13 .39 .46 .96 .71 .96
ρ .57 .93 .13 .38 .40 .96 .70 .96
SUR Mean 4.1 ± 2.74 4.9 ± 2.89 34.1 ± 0.40 34.0 ± 0.41 74.0 ± 10.66 71.7 ± 10.66 8.5 ± 0.88 8.3 ± 0.84
α .79 .92 .63 .72 .54 .96 .71 .96
ρ .45 .92 .63 .72 .47 .95 .70 .96
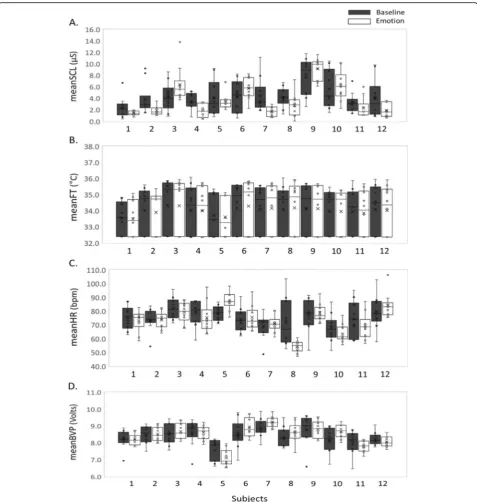
Figure 3 shows physiological features acquired from a single emotional condition (happiness) during 10 weekly sessions. Box plots in Fig. 3 compare the distributions of the features from the baseline and emotion-provoking phases of each subject. For the happiness condition, most subjects showed larger variations in the baseline than the
baseline than the emotion-provoking phase, except for the meanFT.
Discussion
We investigated the reliability of physiological responses induced by emotional stimuli for provoking basic emo-tions during 10 weekly sessions. The film clips used as emotional stimuli in the present study were confirmed
to be appropriate and effective in inducing the intended emotions regardless of the variations in film clips (Ta-bles 2 and 3). Film clips can produce more active and vivid emotional responses than static emotional stimuli (e.g., facial expressions, slides, and imagery) and can be considered advantageous in terms of ecological validity, to the extent that emotions are induced by dynamic vis-ual and auditory stimuli [35,36].
However, film clips may also evoke other unantici-pated emotions. For example, the mean appropriateness of anger, fear, disgust, and surprise stimuli for the first session was 75% (Table 2), indicating that some
participants did not select the intended emotions from these stimuli as their experienced emotions. In fact, these results may support Levenson’s [37] claim that emotions are far more complex in that people do not Fig. 4Physiological features acquired from a single subject during 10 weekly sessions. Distributions of the features from the baseline and
experience only one emotion during a particular situ-ation; instead, they experience several mixed emotions that have dominance over one another in a relatively consistent pattern. Christie and Friedman [36] have ap-plied pattern classification analyses to discriminate seven distinct emotions experienced by subjects based on an 18-item affect self-report scale. In this study, the sadness condition was predicted correctly for 27 out of 34 sub-jects, whereas the remaining seven subjects were
classi-fied as experiencing the amusement, anger,
contentment, and disgust conditions [36]. Similarly, when disgust was expected, 15 out of 34 subjects were classified as experiencing amusement, anger, fear, and sadness [36]. These results suggest that it is difficult to elicit a single discrete emotion using any given stimulus, yet it is possible to induce most commonly experienced emotions. Therefore, it may be realistic to aim to acquire the most frequently reported emotion from a given stimulus rather than to expect a perfect match between the intended and experienced emotions. This may par-tially explain why we observed large variations in indi-vidual responses.
We observed that the emotional stimuli significantly affected SCL and meanHR, which are the most fre-quently reported measures for sympathetic and parasym-pathetic autonomic activity, suggesting that these two features were indeed strong indicators of ANS responses (Fig. 2). Our results were also consistent with previous studies on physiological responses to emotional stimuli; for example, all emotions, except for contentment, non-crying sadness, and acute sadness, induced an increase in SCL; facial expressions of anger induced decreases in HR and SCL; HR decreased during contentment, non-crying and acute sadness, imminent-threat fear, and mutilation-related disgust conditions [4].
Both reliability indices, Cronbach’s alpha and ICC, were lower in the baseline than in the emotion-provoking phase of all emotions. In particular, Cron-bach’s alpha and ICC in the baseline phase ranged from 0.13 to 0.79 and from 0.10 to 0.70, respectively, indicat-ing poor or moderate reliability. These results suggest that intra- and interindividual variations in the baseline level were relatively large. Since an individual’s initial baseline level will affect the degree to which his/her autonomic system responds to emotional stimuli, it is important to assess the baseline and incorporate this in-formation for interpreting physiological changes in re-sponse to the emotional stimulus [38]. For example, the differential values between the baseline and emotional states can be used for statistical tests or the baseline can be used as a covariate in analysis of covariance for physiological response during the emotional state.
In contrast, Cronbach’s alpha and ICC of SCL, meanHR, and meanBVP in the emotion-provoking phase
both ranged from 0.91 to 0.96, indicating excellent reli-ability [32]. Therefore, SCL, meanHR, and meanBVP measured from the emotion-provoking phase exhibited excellent internal consistency and reliability throughout the 10 weekly sessions [39, 40]. However, the reliability indices of meanFT during the emotion-provoking phase ranged from 0.38 to 0.72, indicating poor or moderate reliability. In particular, meanFT in disgust showed the lowest reliability (Tables 4 and Additional file 1: Table S5). Similarly, the change in FT in response to disgust stimuli is known to be inconsistent [4]. For example, dis-gust elicited in relation to mutilation induced consistent increases in HR and SCL but mixed results in FT [4]. Furthermore, the FT response depended on the type of disgust stimuli; FT was unaffected by personalized recall [41], increased by directed facial action or personalized recall [42–44], and decreased by picture or film clip pre-sentations [45–48]. In our previous study [29], the same film stimuli for disgust used in the present study exhib-ited substantially high appropriateness and effectiveness, and we expected that the disgust stimuli would lead to reliable physiological responses in subjects. Nonetheless, the meanFT during the emotion-provoking phase was not consistent throughout the 10 sessions.
Limitations
We used 10 different film clips for each emotion to avoid adaptation of participants caused by repeating the same stimulus. However, different contexts designed to elicit the same emotion can lead to different physio-logical responses. For example, disgust related to
con-tamination and pollution is accompanied by
sympathetic-parasympathetic co-activation, whereas dis-gust related to mutilation, injury, and blood is accom-panied by sympathetic deactivation and unchanged vagal activation [4]. We did not investigate the effect of differ-ent contexts of the film stimuli for the same targeted emotion on physiological responses. Therefore, to evalu-ate the reliability more accurevalu-ately, we may need to sub-divide the film stimuli with respect to their contexts.
During the baseline measurement, we did not use a neutral film stimulus because presenting a film clip itself can induce undesirable emotion elicitation. Instead, we used a blue screen without any auditory stimulus. In a future study, we may need to include neutral film clips to evaluate the reliability of physiological responses to the neutral condition.
Conclusions
In conclusion, we evaluated the inter- and intraindivi-dual reliability of physiological responses induced by emotional stimuli during 10 weekly sessions, using non-identical film clips as stimuli. We hypothesized that physiological responses would show high consistency in both the baseline and emotional phases. However, intra-and interindividual variations in the baseline level were relatively large. We demonstrated excellent internal reli-ability and intraclass consistency in SCL, meanHR, and meanBVP during the emotion-provoking phase through-out the 10 sessions, suggesting that these features can be used as reliable physiological indices in emotion studies. Additionally, our findings can be applied to various emotion-related research fields, such as emotion recog-nition, development of emotion theory, and profiling emotion-specific physiological responses.
Supplementary information
Supplementary informationaccompanies this paper athttps://doi.org/10. 1186/s40101-019-0209-y.
Additional file 1: Table S1. Physiological responses and their reliability indices from the baseline and emotion-provoking phases of the happi-ness condition.Table S2. Physiological responses and their reliability indi-ces from the baseline and emotion-provoking phases of the sadness condition.Table S3. Physiological responses and their reliability indices from the baseline and emotion-provoking phases of the anger condition. Table S4. Physiological responses and their reliability indices from the baseline and emotion-provoking phases of the fear condition.Table S5. Physiological responses and their reliability indices from the baseline and emotion-provoking phases of the disgust condition.Table S6. Physio-logical responses and their reliability indices from the baseline and emotion-provoking phases of the surprise condition.
Abbreviations
ANS:Autonomic nervous system; BVP: Blood volume pulse; ECG: Electrocardiogram; EDA: Electrodermal activity; FT: Fingertip temperature; HR: Heart rate; ICC: Intraclass correlation coefficient; SCL: Skin conductance level
Acknowledgements Not applicable.
Authors’contributions
EHJ and JHS designed research and performed research. EHJ and MSP analyzed the data. EHJ, and SB wrote the paper. All authors commented on the manuscript. All authors agreed to this submission. The material is an original research and has not been previously published while under consideration.
Funding
This work was supported by the Institute for Information & Communications Technology Promotion (IITP) grant funded by the Korea government (MSIT) (No. 2015-0-00062). This research was also supported by Basic Science Re-search Program of the National ReRe-search Foundation of Korea (NRF) funded by the Ministry of Education (NRF-2015R1D1A1A01059095) and the NRF grant funded by the MSIT (No. 2017R1C1B5017730).
Availability of data and materials Not applicable
Ethics approval and consent to participate
This study was approved by the ethics committee of the Institutional Review Board of the Chungnam National University (No. 201309-SB-004-01). All par-ticipants provided written consent for their participation after they were fully informed about the study and received US$20 per session as a reward for their participation
Consent for publication Not applicable.
Competing interests
The authors declare that they have no competing interests.
Author details
1Welfare & Medical ICT Research Department, Electronics and
Telecommunications Research Institute (ETRI), 218 Gajeong-ro, Yuseong-gu, Daejeon 34129, Republic of Korea.2Department of Electronics Engineering,
Incheon National University, 119 Academy-ro, Yeonsu-gu, Incheon, Republic of Korea.3Department of Rehabilitation Counselling, Seoul Hanyoung
University, 290-42 Kyoungin-ro, Guro-gu, Seoul 08274, Republic of Korea.
4Department of Psychology, Brain Research Institute, Chungnam National
University, 99 Daehak-ro, Yuseong-gu, Daejeon 34134, Republic of Korea.
Received: 14 May 2019 Accepted: 28 October 2019
References
1. Steimer T. The biology of fear- and anxiety-related behaviours. Dialogues Clin Neurosci. 2002;4:231–49.
2. Cannon WB. Bodily changes in pain, hunger, fear, and rage. New York: Appleton & Company; 1915.
3. Brown TM, Fee E. Walter Bradford Cannon: pioneer physiologist of human emotions. Am J Public Health Res. 2002;92:1594–5.
4. Kreibig SD. Autonomic nervous system activity in emotion: A review. Biol Psychol. 2010;84:394–421.
5. Cacioppo JT, Berntson GG, Klein DJ, Poehlmann KM. Psychophysiology of emotion across the lifespan. Annu Rev Gerontol. 1997;17:27–74. 6. Cacioppo JT, Berntson GG, Larsen JT, Poehlmann KM, Ito TA. The
psychophysiology of emotion. In: Lewis R, Haviland-Jones JM, editors. The handbook of emotion. 2nd ed. New York: Guilford Press; 2000. 7. Hinz A, Hueber B, Schreinicke O, Seibt R. Temporal stability of
psychophysiological response patterns: concepts and statistical tools. Int J Psychophysiol. 2002;44:57–65.
8. Lacey JI, Lacey BC. The law of initial value in the longitudinal study of autonomic constitution: reproducibility of the autonomic responses and response patterns over a four years interval. Ann N Y Acad Sci. 1962;98: 1257–90.
9. Fredrikson M, Danielssons T, Engel BT, Frisk-Holmberg M, Strom G, Sundin O. Autonomic nervous system function and essential hypertension: individual response specificity with and without beta-adrenergic blockade. Psychophysiology. 1985;22:167–74.
10. Robinson JW, Whitsett SF, Kaplan BJ. The stability of physiological reactivity over multiple sessions. Biol Psychol. 1987;24:129–39.
11. Waters WF, Williamson DA, Bernard BA, Blouin DC, Faulstich ME. Test-retest reliability of psychophysiological assessment. Behav Res Ther. 1987;25:213– 21.
12. Arena JG, Goldberg SJ, Saul DL, Hobbs SH. Temporal stability of psychophysiological response profiles: Analysis of individual response stereotypy and stimulus specificity. Behaviour Therapy. 1989;20:609–18. 13. Marwitz M, Stemmler G. On the status of individual response specificity.
Psychophysiology. 1998;35:1–15.
14. Burgess AP, Gruzelier JH. The reliability of event-related desynchronisation: a generalisability study analysis. Int J Psychophysiol. 1996;23:163–9. 15. Krause CM, Sillanmäki L, Häggqvist A, Heino R. Test-retest consistency of the
event-related desynchronization/event-related synchronization of the 4-6, 6-8, 8-10 and 10-12 Hz frequency bands during a memory task. Clin Neurophysiol. 2001;112:750–7.
17. Larson CL, Ruffalo D, Nietert JY, Davidson RJ. Temporal stability of the emotion-modulated startle response. Psychophysiology. 2000;37:92–101. 18. Bradley MM, Gianaros P, Lang P. As time goes by: Stability of startle
modulation. SPR abstracts, S21; 1995.
19. Doussard-Roosevelt JA, Montgomery LA, Porges SW. Short-term stability of physiological measures in kindergarten children: respiratory sinus arrhythmia, heart period, and cortisol. Dev Psychobiol. 2003;43:230–42. 20. Stephens CL, Christie IC, Friedman BH. Autonomic specificity of basic
emotions: Evidence from pattern classification and cluster analysis. Biol. Psychol. 2010;84:463–73.
21. Fishel SR, Muth ER, Hoover AW. Establishing appropriate physiological baseline procedures for real-time physiological measurement. J Cogn Eng Decis Making. 2007;1:286–308.
22. Kistler A, Mariauzouls C, von Berlepsch K. Fingertip temperature as an indicator for sympathetic responses. Int J Psychophysiol. 1998;29:45–57. 23. Kamal AA, Harness JB, Irving G. Skin photoplethysmography–a review.
Comput Methods Programs Biomed. 1989;28:257–69.
24. Allen J. Photoplethysmography and its application in clinical physiological measurement. Physiol Meas. 2007;28:R1–R39.
25. Bos MGN, Jentgens P, Beckers T, Kindt M. Psychophysiological response patterns to affective film stimuli. Plos One. 2013;8:e622661.
26. Lazarus RS, Speisman JC, Mordkoff AM, Davidson LA. A laboratory study of psychological stress produced by an emotion picture film. Psychol Monogr. 1962;76:553.
27. Davis MH, Hull JG, Young RD, Warren GG. Emotional reactions to dramatic film stimuli: the influence of cognitive and emotional empathy. J Pers Soc Psychol. 1987;52:126–33.
28. Palomba D, Sarlo M, Angrilli A, Mini A, Stegagno L. Cardiac responses associated with affective processing of unpleasant film stimulus. Int J Psychophysiol. 2000;36:45–57.
29. Park BJ, Jang EH, Chung MA, Kim SH. Design of prototype-based emotion recognizer using physiological signals. ETRI Journal. 2013;35:869–79. 30. Likert R. A technique for the measurement of attitudes. Arch of Psychol.
1932;140:44–53.
31. Cronbach LJ. Coefficient alpha and the internal structure of tests. Psychometrika. 1951;16:297–334.
32. Koo TK, Li MY. A Guideline of Selecting and Reporting Intraclass Correlation Coefficients for Reliability Research. J Chiropr Med. 2016;15:155–63. 33. McGraw KO, Wong SP. Forming inferences about some intraclass correlation
coefficients. Psychol Methods. 1996;1:30–46.
34. Shrout PE, Fleiss JL. Intraclass correlations: uses in assessing rater reliability. Psychol Bull. 1979;86:420–8.
35. Gross JJ, Levenson RW. Emotion elicitation using films. Cogn Emot. 1995;9: 87–108.
36. Christie I, Friedman B. Autonomic specificity of discrete emotion and dimensions of affective space: A multivariate approach. Int J Psychophysiol. 2004;51:143–53.
37. Levenson RW. Human emotion: a functional view. In: Ekman P, Davidson RJ, editors. The nature of emotion: Fundamental questions. New York: Oxford University Press; 1994. p. 123–6.
38. Cassidy J, Shaver PR. Handbook of attachment (3rd ed.): theory, research, and clinical applications. In: Hane AA, Fox NA, editors. Studying the biology of human attachment. New York: Guilford Press; 2016.
39. Kline P. The handbook of psychological testing. 2nd ed. London: Routledge; 2000.
40. George D, Mallery P. SPSS for Windows step by step: a simple guide and reference. 11.0 update. 4th ed. Boston: Allyn & Bacon; 2003.
41. Prkachin K, Williams-Avery R, Zwaal C, Mills D. Cardiovascular changes during induced emotion: an application of Lang’s theory of emotional imagery. J Psychosom Res. 1999;47:255–67.
42. Ekman P, Levenson RW, Friesen WV. Autonomic nervous system activity distinguishes among emotions. Science. 1983;221:1208–10.
43. Levenson RW, Ekman P, Friesen WV. Voluntary facial action generates emotion-specific autonomic nervous system activity. Psychophysiology. 1990;27:363–84.
44. Levenson RW, Ekman P, Heider K, Friesen WV. Emotion and autonomic nervous system activity in the Minangkabau of West Sumatra. J Pers Soc Psychol. 1992;62:972–88.
45. Collet C, Vernet-Maury E, Delhomme G, Dittmar A. Autonomic nervous system response patterns specificity to basic emotions. J Auton Nerv Syst. 1997;62:45–57.
46. Gross JJ. Antecedent- and response-focused emotion regulation: divergent consequences for experience, expression, and physiology. J Pers Soc Psychol. 1998;74:224–37.
47. Gross JJ, Levenson RW. Emotional suppression: physiology, self-report, and expressive behavior. J Pers Soc Psychol. 1993;64:970–86.
48. Levenson RW, Carstensen LL, Friesen WV, Ekman P. Emotion, physiology, and expression in old age. Psychol Aging. 1991;6:28–35.
Publisher’s Note