ENHANCEMENT SPECTRAL RESOLUTION FOR THE PREDICTION AMOUNT OF SOFOSBUVIR AND
LEDIPASVIR USING LEAST SQUARES SUPPORT VECTOR MACHINE AND ARTIFICIAL NEURAL
NETWORKS IN PHARMACEUTICAL FORMULATION
NEGIN SAFAKHOO
1, MAHMOUD REZA SOHRABI
1,*, MAHSA KHALILI
1, SHIRIN MOFAVVAZ
21Department of Chemistry, North Tehran Branch, Islamic Azad University, Tehran, Iran 2Department of Chemistry, Shahreza Branch, Islamic Azad University, Shahreza, Isfahan, Iran
ABSTRACT
In this study, least squares support vector machine (LS-SVM) and artificial neural networks (ANNs) as intelligent methods combined with spectrophotometry method, were used for determination of Sofosbuvir (SOF) and Ledipasvir (LED) in synthetic mixtures and Harvoni tablet simultaneously. In the LS-SVM method, Radial Basis Function (RBF) was used as kernel function. Then, the regularization parameter (𝛾) and Bandwidth (2)were optimized and root mean square error
prediction (RMSE) was 0.4164, 0.6033 for SOF and LED respectively. Afterwards, Feed-forward back-propagation network with different training algorithms was used in artificial neural network method. These training algorithms compared with each other for selecting the best model. On the other hand, radial basis function neural network (RBFNN) was applied as an efficient network. Finally, these methods were compared to the high- performance liquid chromatography (HPLC) as a reference method. According to one way analysis of variance (ANOVA) test at the 95 % confidence level, there were no significant differences between LS-SVM, ANN and reference methods.
Keywords: least square support vector machine; Artificial neural networks; Sofosbuvir; Ledipasvir; Harvoni.
INTRODUCTION
The main reason of liver cirrhosis and hepatocellular carcinoma is hepatitis C virus (HCV). Hepatitis C is a global problem. About 3% of the world population are infected with HCV 1,2. The virus can be transmitted through
infected blood injection and infected syringe. This illness causes death 8,000 to 10,000 of people in the United States annually 3.
The anti-viral combination, Harvoni, containing Sofosbuvir (SOF) (400 mg) and Ledipasvir (LED) (90 mg) is one of the most effective drugs against
the hepatitis C virus patients 4. Also, the combination of these drugs uses for
treating of HCV genotype 1 in Japan 5.
Sofosbuvir is Isopropyl (2S) -2-[[[(2R,3R,4R,5R) -5-(2,4- dioxopyrimidin- 1-yl)-4-fluoro-3-hydroxy-4-methyl-tetrahydrofuran-2-yl]methoxy-phenoxy-phosphoryl]amino] propanoate 6. The structure of SOF is shown in Fig 1 (a).
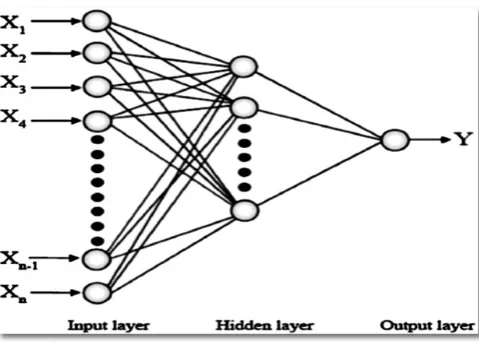
Fig. 2. Schematic of a typical ANN.
The IUPAC name of Lidipasvir is [MethylN-[(2S)-1-[(6S)-6-[5-
[9,9-Difluoro-7-[2-[(1S,2S,4R)-3-[(2S)-2-(methoxycarbonylamino)-3-methylbutane-yl]-3azabicyclo[2.2.1heptan-2-yl]- 3H-benzimidazol-5-yl]
fluoren-2-yl]-1-H-imidazol-2-yl]- 5azaspiro
heptan-5-yl]-3-methyl-1-oxobutan-2-yl] carbamate. Fig 1 (b) shows the chemical structure of LED. Ledipasvir is an antiviral agent that inhibits the hepatitis C virus NS5A
polymerase 9,10. Various methods have been reported for determination of SOF
and LED in pharmaceutical formulations which can be noted in these cases:
reverse phase high performance liquid chromatography (RP-HPLC) 11,12, thin
layer chromatography (TLC) 13 and high performance liquid chromatography
(HPLC) 14. These methods are time-consuming and not cost-effective. Also,
some used solvents in these methods are environmental pollutants. On the other hand, the combination of Chemometrics techniques with spectrophotometry method is simple, inexpensive and economical. The spectral interference problem is solved by combining these two methods. In this study, the SOF and LED have overlap with each other. Therefore, least square support vector machine (LS-SVM) and artificial neural networks (ANNs) with different training algorithms as Chemometrics methods combined with UV spectrophotometry were studied. Finally, the obtained results from the commercial sample were compared to the HPLC as a reference method by one-way ANOVA test.
Methodology
2.1. Least square support vector machine
Least Square Support Vector Machines are supervised learning methods which have several applications such as: classification, regression and so on. It is a modified version of support vector machine (SVM) and is presented by Suykens and Vandewalle 15-17.
In the LS - SVM method, models based on nonlinear mapping function can be introduced as:
Where is a regularization parameter, is the residual vector or the training error for xi, xi and yi corresponds to the input and output vector respectively and
N is the number of data points. The Lagrange multipliers method applied for solving the optimization problem in the dual space:
(1)
where 𝜑 shows the nonlinear function from the input space x which maps
into a higher dimensional feature space and b is the bias term. Also, the weight vector is represented with in equation 1. When the cost function (CF) is minimized, w and b can be calculated:
(2)
(3)
Where αi is the Lagrange multiplier. By finding the partial derivative of
equation (3) with respect to w,b, ai and ei. Eventually, the following equation
is obtained:
(4)
According to Mercer’s condition, kernel function is given as follows:
(5)
Ultimately, the following nonlinear regression function is defined 18-20:
(6)
There are different types of kernel functions such as linear, polynomial, sigmoid and radial basis function (RBF) 21. In this study, the RBF kernel
function
(7)
2.2. Artificial neural network
An artificial neural network, which called a “neural network” (NN),
Similar to the human nervous system 24-26. ANNs have three types of layers:
one input layer, one or more hidden layer and one output layer. Fig 2 shows these layers and an artificial neural network model 27,28. The neural network is a
useful tool for fault diagnosis, feature extraction and prediction. It also shows good flexibility when there are a lot of original data and cannot be presented
them with formulas29. In this study, feed forward back-propagation network
with Levenberg-Marquardt (LM) and the gradient descent with momentum and adaptive learning rate back propagation (GDX) algorithms were used. Also, the other ANN namely radial basis function (RBF-ANN) was utilized.
EXPERIMENTAL
Instruments and software
Spectrophotometric analysis was carried out on T90+UV/vis, PG instruments Ltd. double beam spectrophotometer equipped with 1.0 cm quartz cells. HPLC system (Agilent 1260) with UV detector was used. Separation was performed on C8 column (250×4.6 mm, 5 μm particle size). MATLAB (Ver.8.6) environment for writing program of least square support vector machine and toolbox of MATLAB for neural network model were applied. In addition, Microsoft Excel 2010 was used for calculations.
Chemicals
Pure SOF and LED were kindly supplied by Chanyo Pharma tech and Changzhou Pharmaceutical factory, respectively. Commercial tablet (Harvoni) consist of 400 mg SOF and 90 mg LED were purchased from Sobhan Company. Acetonitrile (ROMIL, UK) was used as a solvent.
Calibration graphs
Preparation of sample solution
Ten tablets were weighed and powdered finely. A quantity of powder which is equivalent to 400 mg SOF and 90 mg LED transferred into a 100 ml volumetric flask. Then, 50mL of Acetonitrile was added and was stirred for 15 min. This solution was diluted with the same solvent.
High- performance liquid chromatography
The mobile phase combination of Ammonium Acetate buffer solution (pH=7.0) and Acetonitrile were prepared in the ratio 35:65% v/v respectively. The elution was done at flow rate of 0.7 mL.min-1. Also, detector wavelength
was set at 245 nm 3.
RESULTS AND DISCUSSION
UV spectra and proposed methods
Absorption spectra of Sofosbuvir and Lidipasvir in the wavelength range of 200–400 nm is illustrated in Fig 3. This spectrum represents that both components have a strong overlap with each other. Because of their mutual interference, least square support vector machine and artificial neural network methods combination with spectrophotometry technique were proposed for simultaneous determination of SOF and LED.
Fig.3. The absorption spectra of SOF 40 g mL-1 and LED 10 g mL-1
LS-SVM method
In this research, radial base function (RBF) was used as a suitable kernel function. Therefore, two important factors must be optimized, which includes the regularization parameter (γ) and the bandwidth parameter (σ2). These
parameters have been calculated based on the lowest root mean square error (RMSE) and the Leave-one-out (LOO) method. γ and σ2 at the ranges of
500-145500 and 50-1300 were optimized for SOF and LED respectively and suitable amounts were selected. The optimal γ and σ2 for SOF are 145500 and
500 respectively. Also, these optimal parameters for LED are 1300 and 100, respectively. As shown in Fig 4, RMSE for SOF and LED is 0.4164 and 0.6033 which has demonstrated the excellent ability of this method.
The root mean square error is defined by the following equation:
(7)
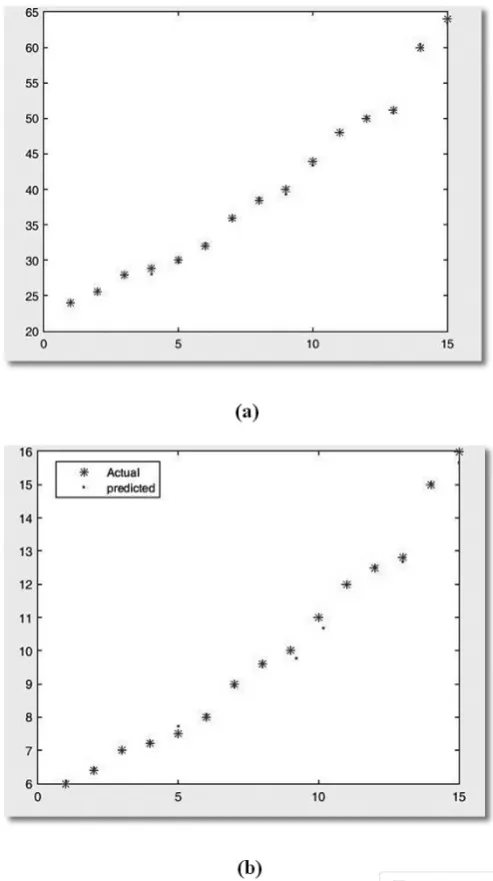
Where ypredis predicted value in the sample, yobsis the observed value of the sample and nis the number of samples in the validation set 30. The results of the prediction of concentrations related to synthetic mixtures for each component are shown in Fig 5 with red dots. As can be seen, the red dots are near the blue points (actual values), which represents good prediction of this method. Also, the predicted values chart based on actual values for SOB and LED is shown in Fig 6. The correlation coefficient (R2) close to one, displays the high ability of the method for predicting. The average recovery percentages (% mean recovery), relative standard deviations (RSD) and RMSE of several synthetic mixtures for both components are reported separately in Table 1. The results of this table indicate the high efficiency of this method. Table 1. Recovery data obtained by application of the LS-SVM method to the ten synthetic mixtures. Mixtures (mg/ml) Recoveries (%) SOB Recoveries (%) LDP SOB LDP 6 24
7 28
9 36
12 48
10 40
Mean Recovery R.S.D RMSE 98.66 99.64 99.18 99.93 97.55 98.99 0.938 0.330 100.41 99.46 99.35 100.10 98.30 99.52 0.813 0.120
Feed forward back-propagation neural network method
The network was formed with 2 and 5 layers and 2, 5, 7, 9 neurons in each layer for SOF and LED. Hyperbolic tangent sigmoid (TANSIG) and a linear (PURELIN) as transfer functions were selected for the first and second layers respectively. The number of neurons in each hidden layer was changed from 2 to 9 and mean square error (MSE) was calculated for each change. As presented in Fig 7 and 8, the MSE curve is plotted against the number of neurons for each component with LM and GDX algorithms. According to the results, Layer 2 with 9 neurons and Layer 5 with 5 neurons were considered in the LM algorithm for the SOF, which would cause the least error in the network. Also, for LED, 2 neurons for Layer 2 and 9 neurons for Layer 5 were selected. In addition, in the case of GDX algorithm, optimum layers and neurons were selected according to the lowest error. The effect of the number of layers in both algorithms on the network performance is summarized in Tables 2 and 3. For example, the LM algorithm for SOF in Layer 5 with 8 Epoch and 5 neurons has shown the least error. The tables show that the LM algorithm has lower MSE than the GDX algorithm for the components. Furthermore, the train, test and validation charts of the LM and GDX algorithms of the optimal layers and neurons of the components are shown in Fig 9 and 10. Moreover, calculated recoveries of both contents with mention algorithms are summarized in table 4. In LM algorithm, mean recovery and RMSE of training and validation sets are better than GDX algorithm for SOF. On the other hand, mean recovery and RMSE of validation and test sets had better performance for LED.
Fig. 5. Schematic of prediction of LS-SVM model for (a) SOF and (b) LED
Table 2. Effect of number of layers on the network performance for prediction concentration of SOF.
Type of train LM GDX
SOF SOF
Number of neurons Number of layers
MSE Epoch
9
2
7.57⨯10-29
5
5 5 8.03⨯10-29
Fig.6. Predicted values against actual values in the LS-SVM method.
Table 3. Effect of number of layers on the network performance for prediction concentration of LED.
Type of train LM GDX
LED LED
Number of neurons Number of layers
MSE Epoch
2 2
8.46⨯10-30
5
9 5 1.43⨯10-30
10 9 2 0.00478 70 9 5 0.0310 40
Table4. Recovery data obtained by application of the LM and GDX algorithms in synthetic mixtures.
Sample number Recoveries (%) of LM Recoveries (%) of LM Recoveries (%) of GDX Recoveries (%) of GDX
SOF LED SOF LED
Radial basis function neural network
The network was trained so that, if network error was high, only one neuron added in per repeat (df=1). Also, the target error for the network was zero (goal=0). The spread value of radial basis function was selected at 3 for the SOF and LED. Moreover, the maximum number of neurons was equal to 15. The mean square error curve versus number of epochs is shown in Fig 11.
The error for the components is very low, which shows the high performance of this network.
Reference Method
Chromatogram was obtained at retention times 2.684 and 4.362 min for SOF and LED respectively. Fig.12 shows the chromatogram of Harvoni content.
Fig.12. Chromatogram obtained from the commercial tablet containing: 400 mg of SOF and 90 mg of LED.
Analysis of commercial tablet
The UV spectrum of the commercial tablet is shown in Fig 13. This figure indicates that no interference between the components and excipient materials. Real sample was analyzed by using LS-SVM, ANN and HPLC methods. The analyses were repeated three times and the results are shown in Table 5. In order to investigate the existence of a significant difference between reported
variances from analysis of the real sample, the results of quantitative analysis of these samples were compared with the mentioned methods using ANOVA test. The results are presented in Table 6. The calculated F-values are less than critical F-values, so there is no significant difference between the variances in the 95% confidence level.
Table 5. Obtained results from the real sample by the proposed and HPLC methods.
Method LS-SVM LM algorithm GDX algorithm RBFNN HPLC
SOF LED SOF LED SOF LED SOF LED SOF LED
Lable claim (mg)
Amount found (mg)a
Recovery (%) R.S.D 400 399.47 99.86 0.135 90 89.81 99.78 0.234 400 399.27 99.81 0.175 90 89.26 99.17 0.316 400 390.75 97.68 0.475 90 87.34 97.04 0.355 400 399.99 99.99 0.005 90 89.99 99.99 0.005 400 399.61 99.90 0.140 90 89.63 99.59 0.359
aMean value of the three determinations
Table 6. The ANOVA test of the real sample.
Source of variation SS df * MS F Calculated F Critical Between groups SOF LED Within groups SOF LED Total SOF LED
0.284137 2 0.001297 2
197.3220 12 14.64416 12
0.142068 0.008639 3.885293 0.000648 0.000531 3.885293
16.44350 1.220346 197.6061 14
14.64546 14
Fig.13. The absorption spectra of Harvoni as real sample.
CONCLUSION
In this study, according to the obtained results, it can be concluded that in mixtures with high spectral overlap, it is possible to use LS-SVM and ANNs methods with sufficient accuracy. Also, by using ANOVA test with a 95% confidence level, there is no significant difference between the proposed methods and the reference method. Therefore, the Chemometrics methods have enough precision to analyze the drugs.
The proposed methods are simple, fast and economical and do not require any separation steps that can be used as a powerful tool for signal processing and simplification in the field of chemistry. It is also used as a suitable method for quality control labs.
REFERENCES
1. E. I. Ismail, A. E. Morgan, R. E. Farag, Journal of Otology, 13, 10–15, (2018).
2. A. Parfieniuk, J. Jaroszewicz, R. Flisiak, World J Gastroenterol, 13,5673– 5681, (2007).
3. M. Khalili, M. R. Sohrabi, V. Mirzabeygi, N. Torabi Ziaratgahi, Spectrochim. Acta A, 194, 141–151, (2018).
4. F. M. Salama, Kh. A. Attia, A. A. Abouserie, A. El-Olemy, E. Abolmagd, Spectrochim. Acta A, 190, 513-517, (2018).
5. S. Saab, S. H. Park, M. Mizokami, M. Omata and et al, Hepatology, 63,1112-1119, (2016).
6. B. Dudekula, C. Ramachandraiah, N. Devanna, Indo Am. j. Pharm, 7, 480-487, (2017).
7. G. Kumaraswamy, K.Pranay, M.Rajkumar, R.Lalitha, Innovat Int J Medical & Pharm Sci, 2, 81-85, (2017).
8. B. Sreenivasa Rao, M. Varaprasad Reddy, B. Sreenivasa Rao, chemistry, 6, 505-509, (2017).
9. M.M. Baker, D.S. El-Kafrawy, M.S. Mahrous,T.S. Belal, Ann Pharm Fr,
76, 16-31, (2018).
10. O. M. Abdallaha, A. M. Abdel-Megied, A. S. Gouda, J. Pharm. Biomed. Anal, 143, 305–310, (2017).
11. T. Nagaraju, S.V.M.Vardhan, D.Ravi Kumar, D.Ramachandran, Int J Chemtech Res, 10, 761-768, (2017).
12. M. El-Kassem M Hassouna, M. M. Abdelrahman, M. A. Mohamed, J
Systems and Software, 137, 686-712, (2018).
17. Y. Tian, X. Ju, Zh. Qi, Y. Shi, Comput Math Appl, 66, 1935–1947, (2013). 18. S. Heddam, O. Kisi, Journal of Hydrology, 559, 499-509, (2018). 19. M. R. Sohrabi, G. Darabi, Spectrochim. Acta A, 152, 443–452, (2016).
20.G. Li, P. Niu, W. Zhang, Y. Liu, Chemom. Intell. Lab. Syst, 11-20, 126,
(2013).
21. J. Zhaoa, Q. Chena, X. Huanga, C.H. Fang, J. Pharm. Biomed. Anal, 41,1198–1204, (2006).
22. P. Samui, Engineering, 3, 431-434, (2013).
23. A. Niazi, S. Jameh-Bozorghi, D. Nori-Shargh, J Hazard Mater, 151, 603– 609, (2008).
24. Z. Aram, S. Jafari, J. Ma, J. C. Sprott, S. Zendehrouh , V. Thanh Pham, Commun Nonlinear Sci Numer Simulat, 44, 449–459, (2017).
25. M. Charles Arockiaraj, Research Inventy: Int J Eng Sci, 3, 8-11, (2013).
26. T. Muhammad, Z. Halim, Appl. Soft Comput, 49, 365–384, (2016).
27. M. Khaki, I. Yusoff, N. Islami, N. Hayati Hussin, Malaysia, Sains Malaysiana, 45,19-28, (2016).
28. A. Najafi-Marghmaleki, M. R. Khosravi-Nikou b, A. Barati-Harooni, J Mol Liq. 220, 232–237, (2016).
29. X. Yu, Ch. Ye, L. Xiang, Neurocomputing, 214, 376-381, (2016). 30. Sh. Mohanty, M. K. Jha, A. Kumar, K. P. Sudheer, Water Resour Manage,