VOLUME 38, ARTICLE 66, PAGES 2073
,
2086
PUBLISHED 27 JUNE 2018
http://www.demographic-research.org/Volumes/Vol38/66/ DOI: 10.4054/DemRes.2018.38.66
Descriptive Finding
A cohort comparison of trends in first
cohabitation duration in the United States
Sara E. Mernitz
© 2018 Sara E. Mernitz.
This open-access work is published under the terms of the Creative Commons Attribution 3.0 Germany (CC BY 3.0 DE), which permits use, reproduction, and distribution in any medium, provided the original author(s) and source are given credit.
1 Introduction 2074 1.1 Cohabitation outcomes: The role of socioeconomic status 2074
1.2 Hypotheses 2075
2 Method 2075
2.1 Sample 2075
2.2 Measures 2075
2.3 Analytic plan 2077
3 Results 2078
3.1 Descriptive statistics 2078
3.2 Life table estimates 2079
3.3 Competing-risk Cox proportional hazard regression models 2081
4 Discussion 2082
5 Acknowledgments 2084
A cohort comparison of trends in first
cohabitation duration in the United States
Sara E. Mernitz1
Abstract
OBJECTIVE
This study investigates US first cohabitation duration between young adults born in the 1950s and young adults born in the 1980s and how socioeconomic resources contribute to cohabitation duration by cohort.
METHODS
Using data from the National Longitudinal Surveys of Youth 1979 and 1997 (NLSY79 and NLSY97), I employ life table estimates and competing-risks Cox proportional hazard models to study how cohabitation duration and transitions out of cohabitation have changed over time.
RESULTS
Young adult cohabitations are short-lived, regardless of cohort; however, NLSY97 cohabiting youth were slower to marry or dissolve than NLSY79 cohabitors. Socioeconomically advantaged NLSY79 youth experienced short-term cohabitation followed by marriage. In the NLSY97 cohort, results provide support for the delinking of marriage and cohabitation, regardless of socioeconomic status.
CONTRIBUTION
This study is the first longitudinal cohort study to explore young adult cohabitation duration in the United States. Additionally, this study empirically tests how socioeconomic resources contribute to remaining in cohabitation.
1. Introduction
Approximately 60% of young adults expect to cohabit, with a first cohabitation beginning around age 22 for women and 24 for men (Manning et al. 2014). US adult cohabitations are short in duration (e.g., Cherlin 2010a), but there is evidence that the duration has lengthened over time. In the mid-1990s, about half of all cohabitations lasted at least a year (Bumpass and Lu 2000; Kennedy and Bumpass 2008) and the median duration was 1.17 years (Heuveline and Timberlake 2004). Among more contemporary cohorts, about two-thirds of all cohabitations lasted at least a year (in 2002; Kennedy and Bumpass 2008) and the median duration was 2.67 years (from 2006–2010; Copen, Daniels, and Mosher 2013). However, few studies have tested whether cohabitation duration has lengthened among young adults. Further, socioeconomic disadvantage is associated with cohabitation instability (Lichter and Qian 2008) and barriers to marriage (Edin and Kefalas 2005; Smock, Manning, and Porter 2005), which may affect cohabitation duration. Using two cohorts from the NLSY 1979 and 1997 datasets, I conduct a comparison of first cohabitation duration among young adults aged 16 to 34 and examine the role of socioeconomic resources for remaining in a cohabitation.
1.1 Cohabitation outcomes: The role of socioeconomic status
Life course theory suggests that individual life trajectories are altered by structural, social, and cultural contexts (Elder 1998). Cohabitation has shifted from a marginalized status to a common occurrence over time (Furstenberg 2011). In the past, because cohabitation was uncommon, marriage was expected and young adults married before becoming financially secure (Cherlin 2004, 2010b). Contemporary marriage is more difficult to attain because many young adults view financial readiness as an important precursor to marriage, but not cohabitation (Addo 2014); as such, marriage has become a symbolic indicator of success (Cherlin 2004, 2010b). However, most young adults do not cohabit with the intent to marry (Cherlin 2004) and these unions remain unstable, with many ending in dissolution, not marriage (Guzzo 2014).
socioeconomically disadvantaged adults and linked to union instability (Edin and Kefalas 2005). Taken together, socioeconomically disadvantaged youth face difficulty transitioning into marriage from cohabitation and are at risk for cohabitation dissolution.
1.2 Hypotheses
Hypothesis 1: NLSY97 youth will make slower transitions into marriage and slower transitions into dissolution from cohabitation than NLSY79 youth.
Hypothesis 2: Compared to advantaged young adults, disadvantaged young adults will dissolve their union earlier and transition into marriage later, rather than remain in a cohabiting union.
2. Method
2.1 Sample
Data comes from the NLSY 1979 and 1997. NLSY79 respondents were born in the United States between 1957 and 1964 (N =12,686) and interviewed annually from 1979 (aged 14–22) until 1994 and biennially from 1994 until 2014. NLSY97 respondents were born between 1980 and 1984 in the United States (N =8,984) and were interviewed annually from 1997 (aged 12–18) until 2011, and in 2013. To ensure an accurate cohort comparison, I omitted oversamples of 1,280 military respondents and 1,643 economically disadvantaged non-Hispanic, non-Black youth in the NLSY79 (N =9,763; Center for Human Resource Research 2013). Further, I limited both samples to all cohabiting participants who experienced a first cohabitation between the ages 16 and 34 that occurred before a first marriage (N =2,558 for the NLSY79 and
N =5,076 for the NLSY97).
2.2 Measures
this source). From 1990–1993, these dates were an indicator of premarital cohabitation and measured whether the participant and spouse lived together before marriage and the premarital cohabitation begin date. Beginning in 1994, respondents were also asked about the date a respondent and a non-premarital partner began living together for all partners reported in the household roster. To measure cohabitations occurring prior to 1990, and cohabitations not followed by marriage from 1990–1993, retrospective histories were used (24% of information from this source). Retrospective histories provided information about (i) whether participants reported an unmarried gap of at least three months, (ii) cohabitations that occurred in each unmarried gap, and (iii) the specific month and year they began cohabiting and, if applicable, the month and year they stopped cohabiting. Household roster information was used to supplement cohabitation information if the prospective and retrospective cohabitation dates were missing (47% of information from this source) because (i) not everyone was interviewed in 2002 (38% not interviewed), (ii) retrospective recall may be biased, and (iii) cohabitation end dates were not collected in the prospective cohabitation data. Participants self-identified a partner as a household member if they lived together at the interview date. Unlike the prospective cohabitation follow-up information asked for partners listed in the roster from 1994–2000, the exact cohabitation begin date was unknown and all cohabitations were assumed to have begun at the interview date of that survey year.
Table 1: Cohabitation questions from all sources in the NLSY79
Prospective cohabitation dates1
(1990–2000)
Did you and your (most recent) [husband/wife] live together BEFORE you were married? If yes, then… In what [month/year] did the two of you begin living together?
Did you live together continuously from [cohabitation date] until you were married?
(1994–2000) Is there a partner listed on the household roster? If yes, then... In what [month/year] did you and [partner’s name] begin living together? Retrospective cohabitation dates
(2002)
You said your marital status was [marital status at the start of unmarried gap] as of [month/year of unmarried gap], and you were not married, reunited, or remarried between [month/year of unmarried gap] ([marital gap start date]) and [month/year of unmarried gap] ([marital gap stop date]). During that period, did you live with any partner for at least three months? If yes, then…
When did you start living with this partner between [month/year of unmarried gap] ([marital gap start date]) and [month/year of unmarried gap] ([marital gap stop date])?
Since [month/year started living with partner], [(have/did) you live(d)] continuously with that partner until [month/year of unmarried gap] ([marital gap stop date]), or did you ever stop living with that partner? When did you stop living with that partner between [month/year of unmarried gap] ([marital gap start date]) and [month/year of unmarried gap] ([marital gap stop date])?
Household roster
(1979 to present) What is [household member’s name]’s relationship to you? 2
66 possible choices, but only Partner response used.
The total number of spouses/partners ever reported, the respondent’s relationship to a current spouse/partner, and a partner identifier variable were created by linking the household roster with unions reported in the relationship history. At each year, these variables were used to identify the sequential order of each cohabiting partner in the respondent’s relationship history. In the NLSY79, 29% of all first cohabitation begin dates came from prospective data, 12% were from retrospective data, and 60% were from household roster data. Transitions into marriage were measured as the month and year each marriage began. For cohabitation dissolution, the actual dissolution dates were measured only in the retrospective data collected in 2002. To create the remaining dissolution dates, I used the first interview date following a cohabitation where a cohabiting partner was not observed in the household roster. Dissolutions were assumed to have occurred in June of that survey year.
In the NLSY97 monthly cohabitation and marriage begin and end dates were measured for each union reported by the respondent. In 1997 respondents were asked for any unions ending prior to the union and, if currently in a union, the union begin dates. At subsequent interviews respondents were asked about any union changes since the prior interview. To create a comparable sample I created a yearly indicator of whether a cohabitation began or ended in any month of each survey year and whether a marriage began. Thus, the duration of short-term cohabitations was overestimated and cohabitations that began and transitioned into marriage within the same year were not included (they were included as direct marriages in these yearly estimates). For both datasets, all century month codes were converted into years with the following formula: year = 1900 + int((century month code-1)/12).
Socioeconomic status was measured by time-varying indicators of employment and educational attainment in both NLSYs at each year. Employment was categorized as full-time (≥35 hours for 50+ weeks), part-time (<35 hours for <50 weeks), and not employed. Education was measured each year as the highest degree obtained: less than high school, high school, some college, college, or more than college.
Controls included age at first cohabitation, gender, race, nonmarital childbirth and pregnancy, current school enrollment, family structure, and mother’s education.
2.3 Analytic plan
the first cohabitation and continued until the year of marriage (competing event = dissolution) or dissolution (competing event = marriage). Censoring occurred if a respondent continued cohabiting until age 34 or left the survey.
I used competing-risks Cox proportional hazard models to predict whether first cohabiting unions ended in (a) marriage or (b) cohabitation dissolution versus continuing to cohabit from education and employment status (Hypothesis 2). The onset of risk began when they entered a first cohabitation on or after age 16, and failure occurred the year respondents reported dissolving their cohabitation or transitioning into marriage. Censoring occurred if respondents were still cohabiting with their partner at age 34 or were still cohabiting when they left the study (<5%). Models for each cohort were analyzed separately; a pooled model with both cohorts assessed cohort differences.
Prior to analysis for Hypothesis 2 I used multivariate imputation using chained equations (MICE) to account for missing data (23% for the combined NLSYs). Missing data was imputed by treating each variable as the dependent variable and regressing all other variables in the model onto the dependent variable (Johnson and Young 2011); 25 imputed datasets were created. The final sample size for Hypothesis 2 wasN =7,634 (NLSY97 N =5,076; NLSY79N =2,558).
3. Results
3.1 Descriptive statistics
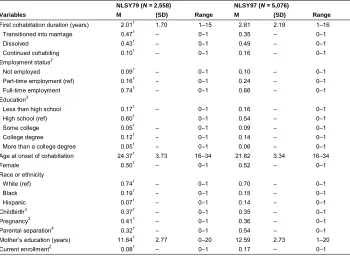
Table 2: Weighted descriptive statistics by cohort
NLSY79 (N =2,558) NLSY97 (N =5,076)
Variables M (SD) Range M (SD) Range
First cohabitation duration (years) 2.011 1.70 1–15 2.81 2.19 1–16
Transitioned into marriage 0.471 – 0–1 0.35 – 0–1
Dissolved 0.431 – 0–1 0.49 – 0–1
Continued cohabiting 0.101 – 0–1 0.16 – 0–1
Employment status2
Not employed 0.091 – 0–1 0.10 – 0–1
Part-time employment (ref) 0.161 – 0–1 0.24 – 0–1
Full-time employment 0.741 – 0–1 0.66 – 0–1
Education3
Less than high school 0.171 – 0–1 0.16 – 0–1
High school (ref) 0.601 0–1 0.54 – 0–1
Some college 0.051 – 0–1 0.09 – 0–1
College degree 0.121 – 0–1 0.14 – 0–1
More than a college degree 0.051 – 0–1 0.06 – 0–1
Age at onset of cohabitation 24.371 3.73 16–34 21.82 3.34 16–34
Female 0.501 – 0–1 0.52 – 0–1
Race or ethnicity
White (ref) 0.741 – 0–1 0.70 – 0–1
Black 0.191 – 0–1 0.15 – 0–1
Hispanic 0.071 – 0–1 0.14 – 0–1
Childbirth3 0.371 – 0–1 0.35 – 0–1
Pregnancy3 0.411 – 0–1 0.36 – 0–1
Parental separation4 0.321 – 0–1 0.54 – 0–1
Mother’s education (years) 11.641 2.77 0–20 12.59 2.73 1–20
Current enrollment2 0.081 – 0–1 0.17 – 0–1
Note:1Indicates significant difference between cohorts.2Indicates time-varying variables, which are taken from the year of first cohabitation until the year the cohabitation ended (via marriage, dissolution, or at the final survey year).3Indicates time-invariant variables here that are time-varying in competing-risks Cox proportional hazard models.4Asked at age 14 for NLSY79 and at the first round of data collection in the NLSY97 (ages 12–17).
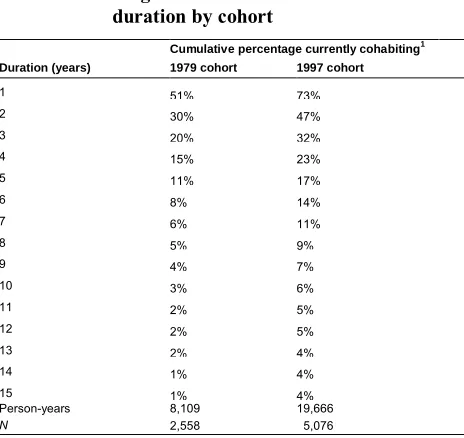
3.2 Life table estimates
Table 3: Single-decrement life table survival estimates of first cohabitation duration by cohort
Cumulative percentage currently cohabiting1 Duration (years) 1979 cohort 1997 cohort
1 51% 73%
2 30% 47%
3 20% 32%
4 15% 23%
5 11% 17%
6 8% 14%
7 6% 11%
8 5% 9%
9 4% 7%
10 3% 6%
11 2% 5%
12 2% 5%
13 2% 4%
14 1% 4%
15 1% 4%
Person-years 8,109 19,666
N 2,558 5,076
Note:1Losses occur to both marriage and cohabitation dissolution.
Table 4: Competing risks life table estimates to cohabitation outcomes by cohort
Cumulative percentage of first cohabitation ending through
Dissolution Marriage
Duration (years) 1979 cohort 1997 cohort 1979 cohort 1997 cohort
1 26% 15% 23% 12%
2 38% 33% 32% 21%
3 43% 42% 37% 26%
4 46% 48% 39% 29%
5 49% 52% 41% 32%
6 50% 54% 42% 33%
7 51% 55% 43% 34%
8 52% 57% 43% 34%
9 52% 58% 44% 35%
10 53% 59% 44% 35%
11 53% 59% 45% 36%
12 54% 60% 45% 36%
13 54% 60% 45% 36%
14 54% 60% 45% 36%
15 54% 60% 45% 36%
Person-years 8,109 19,666 8,109 19,666
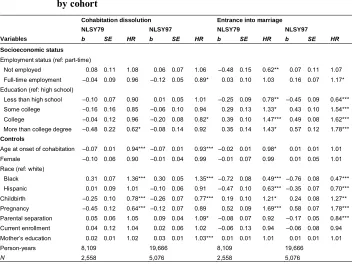
3.3 Competing-risk Cox proportional hazard regression models
These models predicted transitions out of a first cohabitation (via marriage or dissolution) from education and employment (see Table 5). For the NLSY79 youth, employment was not associated with cohabitation dissolution, but having more than a college education was associated with delayed cohabitation dissolution compared to having a high school degree. For NLSY97 youth, being employed full time and having a college degree were associated with later cohabitation dissolutions compared to part-time employment and having a high school degree.
Table 5: Competing risks Cox proportional hazard models predicting the hazard of entering into marriage or dissolving a current cohabitation by cohort
Cohabitation dissolution Entrance into marriage
NLSY79 NLSY97 NLSY79 NLSY97
Variables b SE HR b SE HR b SE HR b SE HR
Socioeconomic status Employment status (ref: part-time)
Not employed 0.08 0.11 1.08 0.06 0.07 1.06 –0.48 0.15 0.62** 0.07 0.11 1.07 Full-time employment –0.04 0.09 0.96 –0.12 0.05 0.89* 0.03 0.10 1.03 0.16 0.07 1.17* Education (ref: high school)
Less than high school –0.10 0.07 0.90 0.01 0.05 1.01 –0.25 0.09 0.78** –0.45 0.09 0.64*** Some college –0.16 0.16 0.85 –0.06 0.10 0.94 0.29 0.13 1.33* 0.43 0.10 1.54*** College –0.04 0.12 0.96 –0.20 0.08 0.82* 0.39 0.10 1.47*** 0.49 0.08 1.62*** More than college degree –0.48 0.22 0.62* –0.08 0.14 0.92 0.35 0.14 1.43* 0.57 0.12 1.78*** Controls
Age at onset of cohabitation –0.07 0.01 0.94*** –0.07 0.01 0.93*** –0.02 0.01 0.98* 0.01 0.01 1.01 Female –0.10 0.06 0.90 –0.01 0.04 0.99 –0.01 0.07 0.99 0.01 0.05 1.01 Race (ref: white)
Black 0.31 0.07 1.36*** 0.30 0.05 1.35*** –0.72 0.08 0.49*** –0.76 0.08 0.47*** Hispanic 0.01 0.09 1.01 –0.10 0.06 0.91 –0.47 0.10 0.63*** –0.35 0.07 0.70*** Childbirth –0.25 0.10 0.78*** –0.26 0.07 0.77*** 0.19 0.10 1.21* 0.24 0.08 1.27** Pregnancy –0.45 0.12 0.64*** –0.12 0.07 0.89 0.52 0.09 1.69*** 0.58 0.07 1.78*** Parental separation 0.05 0.06 1.05 0.09 0.04 1.09* –0.08 0.07 0.92 –0.17 0.05 0.84*** Current enrollment 0.04 0.12 1.04 0.02 0.06 1.02 –0.06 0.13 0.94 –0.06 0.08 0.94 Mother’s education 0.02 0.01 1.02 0.03 0.01 1.03*** 0.01 0.01 1.01 0.01 0.01 1.01
Person-years 8,109 19,666 8,109 19,666
N 2,558 5,076 2,558 5,076
Note: HR = Hazard Ratio. * p<0.05, ** p<0.01, *** p<0.001.
attainment transitioned into marriage earlier compared to those with a high school degree. For the NLSY97, those employed full time transitioned into marriage earlier than those employed part-time. Youth with less than a high school degree transitioned into marriage later, and those with any college attainment transitioned into marriage earlier, than youth with a high school degree. In the pooled model, NLSY97 youth dissolved their cohabiting union later (b= –0.40, p<.001) and transitioned into marriage later (b= –0.54, p<.001) than NLSY79 youth.
4. Discussion
The nature of young adult cohabitation has changed rapidly over time (Cherlin 2010a). My results confirmed Hypothesis 1, that NLSY97 youth will marry and dissolve their cohabitations later than NLSY79 youth. This finding is consistent with past research that cohabitation has lengthened over time, even though cohabitation remains a short-term status (Kennedy and Bumpass 2008; Copen, Daniels, and Mosher 2013). Young adults are mirroring these duration statistics. However, when compared to NLSY79 cohabitors, NLSY97 cohabitors were more likely to dissolve their union at later durations and less likely to transition into marriage at any duration, suggesting that cohabitation remained fairly unstable among the contemporary cohort.
I found evidence that contemporary youth were in their cohabitation longer than the earlier cohort, providing support for the delinking of marriage and cohabitation. The earlier cohort of young adults cohabited before cohabitation became socially acceptable (Furstenberg 2011). As these youth may have faced public scrutiny for going against a social norm by cohabiting (Furstenberg 2011), they may have consciously decided to cohabit and transition out of cohabitation quickly. Both the higher prevalence of cohabitation and later transitions out of cohabitation in the younger cohort suggest that cohabitation is becoming more socially acceptable. Youth might also cohabit for various reasons, not necessarily with the intent to marry their partner (Cherlin 2004; Furstenberg 2011). Because marriage is now a symbolic indicator of success, making marriage difficult to attain at younger ages (Cherlin 2010b), youth might be cohabiting for longer durations.
precursor to marriage for all, regardless of cohort. In the NLSY79, youth who were not employed delayed marriage compared to those employed part-time and there was no difference between part-time or full-time employment; in the NLSY97, youth employed full-time married earlier than youth employed part-time and there was no difference between part-time or no employment. Although more educational attainment increased the likelihood of marriage for both cohorts, the likelihood of marriage grew with each additional level of education in the NLSY97 and levelled off at a college education in the NLSY79. Together the employment and education findings signal a shift in the meaning of marriage between cohorts, indicating that marriage has become a symbolic achievement (Cherlin 2010b) that is difficult to reach for more socioeconomically disadvantaged young adults.
The measurement of cohabitation likely underestimates cohabitation prevalence and overestimates duration. Further, the older age at first cohabitation in the NLSY79 compared to the NLSY97 likely affects cohabitation duration. Past research has often used data from the National Survey of Family Growth (NSFG; e.g., Kennedy and Bumpass 2008; Copen, Daniels, and Mosher 2013) or the Family and Fertility Surveys (FFS; Heuveline and Timberlake 2004). The NSFG is a cross-sectional study containing retrospective reports of cohabitation with longer recall periods, which also underestimates cohabitation prevalence and overestimates duration. The FFS included international data taken from existing surveys; the NSFG was used for the United States. Further, earlier cycles of the NSFG, including cycle 5 used by the FFS, contained cohabitation information from women only. Thus, the NLSY cohorts are the best longitudinal datasets to conduct cohort comparisons of young adult cohabitation duration.
5. Acknowledgments
References
Addo, F. (2014). Debt, cohabitation, and marriage in young adulthood. Demography
51(5): 1677–1701.doi:10.1007/s13524-014-0333-6.
Bumpass, L. and Lu, H.-H. (2000). Trends in cohabitation and implications for children’s family contexts in the United States.Population Studies 54(1): 29–41.
doi:10.1080/713779060.
Center for Human Resource Research (2013).NLSY handbook. Columbus: Ohio State University.
Cherlin, A. (2004). The deinstitutionalization of American marriage. Journal of Marriage and Family 66(4): 848–861.doi:10.1111/j.0022-2445.2004.00058.x.
Cherlin, A. (2010a). Demographic trends in the United States: A review of research in the 2000s.Journal of Marriage and Family72(3): 403–419.
doi:10.1111/j.1741-3737.2010.00710.x.
Cherlin, A. (2010b). The marriage-go-round: The state of marriage and the family in America today. New York: Knopf.
Copen, C., Daniels, K., and Mosher, W. (2013). First premarital cohabitation in the United States: 2006–2010 National Survey of Family Growth. Hyattsville: National Center for Health Statistics (National Health Statistics Report 64).
Edin, K. (2000). What do low-income single mothers say about marriage? Social Problems 47(1): 112–133.doi:10.2307/3097154.
Edin, K. and Kefalas, M. (2005). Promises I can keep: Why poor women put motherhood before marriage. Berkeley: University of California Press.
Elder Jr., G. (1998). The life course as developmental theory.Child Development69(1): 1–12.doi:10.1111/j.1467-8624.1998.tb06128.x.
Furstenberg, F. (2011). The recent transformation of the American family: Witnessing and exploring social change. In: Carlson, M.J. and England, P. (eds.) Social class and changing families in unequal America. Palo Alto: Stanford University Press: 192–220.
Heuveline, P. and Timberlake, J. (2004). The role of cohabitation in family formation: The United States in comparative perspective. Journal of Marriage and Family
66(5): 1214–1230.doi:10.1111/j.0022-2445.2004.00088.x.
Johnson, D. and Young, R. (2011). Toward best practices in analyzing datasets with missing data: Comparisons and recommendations. Journal of Marriage and Family73(5): 926–945.doi:10.1111/j.1741-3737.2011.00861.x.
Kennedy, S. and Bumpass, L. (2008).Cohabitation and children’s living arrangements: New estimates from the United States. Demographic Research 19(47): 1663–
1692.doi:10.4054/DemRes.2008.19.47.
Lichter, D. and Qian, Z. (2008). Serial cohabitation and the marital life course.Journal of Marriage and Family 70(4): 861–878. doi:10.1111/j.1741-3737.2008.0053 2.x.
Manning, W., Smock, P., Dorius, C., and Cooksey, E. (2014). Cohabitation expectations among young adults in the United States: Do they match behavior?
Population Research and Policy Review 33(2): 287–305. doi:10.1007/s11113-013-9316-3.