VOLUME 41, ARTICLE 10, PAGES 263
-
292
PUBLISHED 24 JULY 2019
https://www.demographic-research.org/Volumes/Vol41/10/ DOI: 10.4054/DemRes.2019.41.10
Research Article
Earning their keep? Fostering, children’s
education, and work in north-western Tanzania
Sophie Hedges
Rebecca Sear
Jim Todd
Mark Urassa
David Lawson
© 2019 Hedges, Sear, Todd, Urassa & Lawson.
This open-access work is published under the terms of the Creative Commons Attribution 3.0 Germany (CC BY 3.0 DE), which permits use, reproduction, and distribution in any medium, provided the original author(s) and source are given credit.
1 Background 264
1.1 Why care for foster children? 265
1.2 Study context and predictions 267
2 Methods 268
2.1 Data collection 268
2.2 Data analysis 269
3 Results 271
3.1 Descriptive results 271
3.1.1 Comparison of households with and without foster children 271
3.1.2 Child characteristics 272
3.2 Educational outcomes 273
3.3 Farm and paid work during past week 276
3.4 Trade-off between work and education 278
4 Discussion 281
4.1 Limitations 284
4.2 Conclusions 284
5 Acknowledgements 285
Earning their keep? Fostering, children’s education, and work in
north-western Tanzania
Sophie Hedges1
Rebecca Sear2
Jim Todd2 Mark Urassa3 David Lawson4
Abstract
BACKGROUNDFostering, raising children that are not one’s biological children, is common in many societies worldwide. Despite predicted lower investment in nonbiological offspring, numerous studies report no obvious well-being penalty for fostered children. Building on prior research, we suggest that fostering is incentivised by close relatedness between foster child and caregivers and that children’s work contributions can offset their costs to fostering households.
METHOD
We used multilevel logistic and fractional multinomial regression analyses to investigate the association between fostering, educational investment, and time allocation in a sample of 1,273 Sukuma children (aged 7–19) from northwestern Tanzania, where fostering is traditionally common.
RESULTS
Twenty-six per cent of children are fostered, with most having at least one living parent. Children fostered by close kin have similar educational outcomes to those living with both biological parents, though their grade for age is lower, perhaps reflecting differences in timing rather than overall level of investment. Those fostered by distant kin are less likely to be enrolled or to progress to secondary school. Overall, fostered children are more likely to do farm work; however on weekdays when work conflicts
1 London School of Hygiene and Tropical Medicine, London, UK. Email:[email protected]. 2 London School of Hygiene and Tropical Medicine, London, UK.
with school, differences in time allocation to work activities are not pronounced. We further find that orphans are generally not particularly disadvantaged compared to other fostered children.
CONCLUSION
Being fostered by close kin does not appear to disadvantage children, and buffers orphans from parental death. Fostered children may offset some of their costs through increased farm work.
CONTRIBUTION
We extend previous work in this area through analysis of detailed time allocation data, providing insights into associations between fostering and children’s workload.
1. Background
Fostering, i.e., permanently or temporarily raising children that are not one’s biological children, is common in many societies worldwide (Silk 1980; Scelza and Silk 2014). Across 40 countries in sub-Saharan Africa, 8.6% of children aged 15 and under were estimated to be fostered in 2002, with the frequency of fostering amplified in regions where HIV has increased the incidence of orphanhood (Monasch and Boerma 2004: S58). In societies with strong traditions of fostering, fostering can begin at young ages, and frequently occurs even when both parents are alive. Lawson et al. (2017), for example, report that in northern Tanzania, 6% of children under five years of age resided apart from both living parents, most often with grandparents. Another study at a site in rural eastern Tanzania estimates that 25% of children experienced maternal absence, and 40% paternal absence, by age 10 (Gaydosh 2015). The widespread practice of fostering seemingly contradicts the otherwise well-supported assumption that parental care is incentivised by close genetic relatedness between caretaker and child (Hamilton 1964; Silk 1980). In this paper we consider the possibility that, in addition to foster parents usually being close kin, foster children offset the costs of their care through contributions to household labour (Reghupathy et al. 2012). In doing so we present novel data on children’s time allocation in a rural Sukuma population from north-western Tanzania. We begin by first reviewing past research on parental motivations for out-fostering children and the well-being implications for fostered children, before considering the incentives for foster parents. We then introduce our study context and predictions.
Potential benefits include forging advantageous alliances with other households, alleviating resource scarcity if they cannot support all their children, or adjusting the sex ratio of their household (Goody 1982; Franklin and Volk 2016). The overall benefits to parents of out-fostering may therefore outweigh any potential negative impacts on the well-being of an individual child. Among the Mende in Sierra Leone, Bledsoe (1990) reported that foster children receive harsh treatment, but that parents value the status gains made by fostering children out to wealthier households. Among the Himba in Namibia, Scelza and Silk (2014) found that fostering children out was associated with higher reproductive success for mothers (i.e., a greater number of surviving children), but was associated with an increased risk of stunting and being underweight for foster children. Consistent with the notion that fostering entails some cost to children, several studies have also reported that fostered children are less likely to be enrolled in school (Roby, Erickson, and Nagaishi 2016; Assaad, Levison, and Zibani 2010; Moyi 2010; Novella 2018; Urassa et al. 1997).
However, there is also considerable evidence that foster children may not always be disadvantaged, particularly when fostered by close kin, as is most common across sub-Saharan Africa (Monasch and Boerma 2004). Studies in several countries have found that children fostered by grandparents and other close relatives are not disadvantaged, but that fosterage by more distant kin or nonrelatives is associated with a lower probability of school enrolment (Chuong and Operario 2012; Fleisch, Shindler, and Perry 2012; Ainsworth, Beegle, and Koda 2002; Parker and Short 2009; Shapiro and Tambashe 2001; Madhavan et al. 2017; Burke and Beegle 2004). Multiple studies in northern Tanzania have found that fostered children are not disadvantaged in terms of mortality, anthropometric scores, or educational investment compared to biological children (Urassa et al. 1997; Burke and Beegle 2004; Lawson et al. 2017). In Mozambique, fostered children were not less likely to attend school than biological children within the same household (Lopus 2017). These studies suggest that fostering children need not always come at the cost of a child’s well-being. Indeed, some studies have highlighted that being fostered into wealthier or urban households can actually facilitate access to schooling, and may benefit children more than remaining with their parents (Eloundou-Enyegue and Stokes 2002; Zimmerman 2003; Akresh 2004).
1.1 Why care for foster children?
inclusive fitness, i.e., the probability of genetic representation in future generations (Hamilton 1964). This explanation is supported by the fact that traditional forms of fostering are almost always confined to close biological kin (Franklin and Volk 2016; Silk 1980). It is also consistent with the findings described above indicating that foster children’s well-being is most likely to be unaffected when they reside with close, as opposed to distant kin (Franklin and Volk 2016). However, genetic relatedness is still higher between biological parents and child, compared to that between grandparents and grandchild, or aunt/uncle and niece/nephew. Therefore, this explanation cannot completely explain why the well-being of fostered children is often indistinguishable from biological children, who by the same logic should be prioritized within fostering households.
1.2 Study context and predictions
Here we investigate the differences between fostered and nonfostered children in educational investment and work, using detailed time allocation data from children in Sukuma households from the Mwanza region of north-western Tanzania. Sukuma households are relatively large compared to neighbouring ethnic groups, with households often containing affinal kin and fostered children, leading to considerable variation in household structure and the relatedness of resident children to household heads (Lawson et al. 2015; Urassa et al. 1997). The Sukuma have a long history of fostering, and children traditionally moved frequently between households (Varkevisser 1973: 87–88). Grandparents are the most common foster parents, and it is more common for children to be fostered by maternal kin than paternal kin. Parental divorce and remarriage are common reasons for fostering in this area, though there are also cases where children live with a stepmother, or less commonly a stepfather (Urassa et al. 1997). Orphanhood in response to HIV mortality has increased in recent years, with a likely corresponding increase in fostering, though declining HIV mortality may begin to reverse this trend (Kishamawe et al. 2015; Kanjala et al. 2012).
The Sukuma are patrilocal, and polygynous marriage is permitted (Hadley 2005). Among the household heads interviewed for this study who were married (72.6%), 21.1% were in a polygynous marriage in the village, and 10.6% were in a polygynous marriage in the town. While there are some inheritance rights recognised by customary law, in practice inheritance is determined by the circumstances surrounding a particular person’s death. Traditionally the oldest son inherited land, but now fathers may divide their fields among their sons due to the scarcity of land (Wijsen and Tanner 2002: 49– 54; Varkevisser 1973: 35). Marriage is nearly universal, and both divorce and remarriage are common (Boerma et al. 2002).
In this area, the majority of children attend primary school, though progression to secondary school is less common. Despite national-level data suggesting that boys are more likely to be enrolled than girls, in this context enrolment is generally equal, or higher for girls in more rural areas where boys’ cattle herding work is less compatible with school attendance (Hedges et al. 2018). Education is compulsory between ages 7 and 14, which generally corresponds to the years of primary education, though late starting and grade repetition mean some primary school children may be older than 14. Primary school education is free, while at the time of this study (2016 academic year), fees had to be paid for secondary school. Even without school fees, families still pay costs such as uniform, stationery, and exam entry fees. At primary level the language of instruction is Swahili, while at secondary level it is English.
girls work more than boys. School attendance reduces work, but primarily impacts children’s leisure time, indicating that the opportunity costs of education in this area are lower than anticipated. Traditionally households were reliant on farming and cattle herding, living in dispersed homesteads, but livelihoods have now diversified, with many families engaged in petty trading and small businesses.
We test a number of predictions grounded in the expectation that the care of foster children is motivated by both close genetic relatedness and by the economic contributions of children. Our study has some advantages over past studies in that we collected detailed data on multiple measures of educational attainment and time allocation data corresponding to a complete day. Compared to many other anthropological studies of fostering, our sample size is also relatively large (n = 1,273 children). First, we predict that fostered children will receive less educational investment and do more work than children living with both biological parents. We expect this to be particularly true for those children who are fostered by more distant kin as compared to close kin, since lower genetic relatedness should reduce the incentive for investment. Second, we predict that among fostered children, orphans will be particularly disadvantaged, as they do not have the protection or additional investment of a parent outside the household, and may represent a situation of ‘crisis fostering’ rather than ‘purposive fostering’ so that children are less likely to have moved into households that can economically support them.
2. Methods
2.1 Data collectionmachine), or ‘high-value’ (TV, fridge, or motorbike). This was followed by a set of nine questions pertaining to food security during the past month (Coates, Swindale, and Bilinsky 2007).
For each household member aged 7 to 19, an additional survey was answered by their parent or guardian, collecting information on their biological parents’ vital and marital status, and the educational attainment and enrolment of the child. We collected data on children’s residence and parents’ vital status and so can distinguish between fostered nonorphans and orphans, but did not collect information on the reasons for children living away from their living parents. We do not have information on how long children have been fostered, or where fostered children’s parents live, which might also be associated with different outcomes.
In total, household surveys provided data on 1,387 children. 1,278 children (92.1%) were then followed up for a time allocation interview; among those who could not be interviewed, 52 children were at boarding school, 48 were travelling, two were ill and seven refused to participate. Five children were excluded from further analysis, three who were married, and two who were employees of their household. Female marriage under age 19 is common in this population and is associated with a higher likelihood of being out of school (Schaffnit et al. 2019; Schaffnit, Urassa, and Lawson 2019). Our sample contained very few married individuals, perhaps because they were viewed as adults and not reported as children during household interviews.
In the time allocation interview, children were first asked whether they had done farm work, herding, or any kind of work for pay (e.g., petty trading, casual labouring, working in a shop) during the past week. The respondent was then shown a diagram with rows for different activities, and columns corresponding to the time of day, from 6 a.m. to 10 p.m. They were asked to describe all the activities they had done on the previous weekday, from when they had woken up until they went to bed, and the diagram was shaded to show the time and duration of all activities. The time allocation data was entered into an Excel spreadsheet and subsequently coded into three broad categories: (i) education (school, tuition, studying); (ii) productive work (household chores, e.g., cleaning, cooking, water and fuel collection), farm work, and market work (e.g., petty trading, working in shop), and (iii) personal or ‘leisure time’ (playing, resting, eating, bathing) (for more detail on the time allocation data collection see Hedges et al. 2018).
2.2 Data analysis
include orphans). Among fostered children, 64.7% live with a grandparent, 4.8% with an aunt or uncle, and 1.8% with a sibling or half-sibling; these are classed as living with ‘close kin’. We do not collect more detailed data on relatedness, for example whether grandparents are matrilateral or patrilateral, or whether children have been fostered together with or separately from their siblings. The 25.4% of fostered children living with other relatives are classed as living with ‘distant kin,’ The small number of children living with nonrelatives (n = 11) precluded analysing them separately, and so they were grouped with ‘distant kin.’
Data on parental vital status were used to classify children as a nonorphan, maternal orphan, paternal orphan, or double orphan. For some children their father’s (28 children), mother’s (2 children), or both parents’ (2 children) vital status was unknown. While the reason for not knowing was not recorded, informal observations suggest it tended to be because the child was abandoned at a young age or left with relatives, or because the father had no contact with the family. These children were recorded as orphans (father unknown as paternal orphan, mother unknown as maternal orphan, and neither parent known as double orphan) on the basis that they also receive no investment from that parent.
Investment in education was measured using three binary variables reflecting: (i) whether a child is currently enrolled in school; (ii) grade for age, where those who are enrolled in school are coded as 0 if they are below their recommended grade and 1 if they are at the correct grade or above, based on the school start age of seven; and (iii) progression to secondary school (‘progressed’), where those aged 14 or over are coded as 0 if they are still enrolled in primary school or have dropped out of school, and 1 if they are or have been enrolled in secondary school.
Time allocation to work was measured in two ways. First, two binary variables reflect (i) whether a child had done farm work in the previous week, and (ii) whether a child had done paid work during the previous week. The survey did not collect data on household work done over the past week, as pilot work indicated that the overwhelming majority of children engaged in at least some household work over the course of a week. Second, time allocation data provide the proportion of time spent in education, leisure or personal activities, and productive work on the previous weekday. These data were only collected for weekdays because children only attend school on weekdays and data collection at weekends was logistically difficult.
above) between this reference category and four other categories of residence: with mother, with father, fostered by close kin, and fostered by distant kin (note that these categories don’t specify how many adults children live with, e.g., living ‘with mother’ does not imply living with mother alone, as other adults could also be resident in the household). A second set of models was then run for the subsample of fostered children, to investigate whether there were differences between children living with distant versus close kin, and whether there were associations between orphan status and outcome variables.
Multilevel logistic regression was used to consider the relationship between fostering and enrolment, grade for age, and whether or not a child had worked during the past week (where farm work and paid work were analysed separately). These models include a random effect for household. Standard logistic regression was used to consider the relationship between fostering and progression to secondary school (which includes only 14- to 19-year-olds), and also in analyses restricted to fostered children. These analyses are not multilevel, as the reduced sample size means that the number of children per household is small, which can lead to misestimation of parameter values (Clarke 2008). Fractional multinomial logistic regression was used to investigate time allocation on the previous weekday, where the outcome variables are the proportions of time spent in education, leisure or personal activities, productive work, adding up to 1 for each child. This approach models the trade-off between children’s work and other activities on a weekday, and accounts for autocorrelation between time uses, as time spent in one activity automatically reduces the time available for other activities (Buis 2017; see also Hedges et al. 2018). All analyses were carried out in Stata version 15.
3. Results
3.1 Descriptive results
3.1.1 Comparison of households with and without foster children
Table 1: Comparison of households with and without foster children Household has foster children?
No Yes Total
N 265 180 445
N (%) N (%) N (%) pa
Location 0.161
Village 146 (55.1) 87 (48.3) 233 (52.4)
Town 119 (44.9) 93 (51.7) 212 (47.6)
Household farms 0.210
No 76 (28.7) 42 (23.3) 118 (26.5)
Yes 189 (71.3) 138 (76.7) 327 (73.5)
Household owns cows 0.370
No 200 (75.5) 129 (71.7) 329 (73.9)
Yes 65 (24.5) 51 (28.3) 116 (26.1)
Household owns land 0.005
No 51 (19.2) 17 (9.4) 68 (15.3)
Yes 214 (80.8) 163 (90.6) 377 (84.7)
Household assets 0.668
Higher value 54 (20.4) 42 (23.3) 96 (21.6)
Intermediate value 161 (60.8) 102 (56.7) 263 (59.1)
Basic 50 (18.9) 36 (20) 86 (19.3)
Household is food secure 0.727
No 187 (71.1) 130 (72.6) 317 (71.7)
Yes 76 (28.9) 49 (27.4) 125 (28.3)
Mean (SD) Mean (SD) Mean (SD) pb
Household size 7.2 (2.5) 8.2 (3.8) 7.6 (3.1) <0.001
Number of children <7 years old 1.7 (1.4) 1.5 (1.5) 1.6 (1.4) 0.061 Number of children 7–19 years old 2.7 (1.4) 3.6 (2.1) 3.1 (1.7) <0.001 Number of adults 20–59 years old 2.6 (1.1) 2.6 (1.7) 2.6 (1.4) 0.955 Number of adults 60+ years old 0.1 (0.4) 0.5 (0.7) 0.3 (0.6) <0.001
Number of cows 2.5 (0.4) 2.6 (0.5) 2.5 (0.3) 0.938
Land owned (hectares) 1.9 (0.14) 2.5 (0.3) 2.2 (0.1) 0.062
Food security scorec 17.8 (0.4) 17.7 (0.5) 17.8 (0.3) 0.862
Note:a p chi-squared test;b p t-test;c Higher value indicates household is more food secure.
3.1.2 Child characteristics
slightly more likely to be fostered than boys, and older children are more likely to be fostered by distant kin than younger children. Paternal orphans are more likely to live with their mother (50%) than maternal orphans are to live with their father (42%); maternal orphans are therefore more likely to be fostered than paternal orphans.
Table 2: Child characteristics by residence Child lives with
Both parents Mother Father Close kin Distant kin Total
N 638 226 78 236 95 1,273
Row percentages N (%) N (%) N (%) N (%) N (%) N
Gender
Male 337 (53.3) 107 (16.9) 35 (5.5) 114 (18.0) 39 (6.2) 632
Female 301 (47.0) 119 (18.6) 43 (6.7) 122 (19.0) 56 (8.7) 641 Age group
7 to 13 416 (49.9) 149 (17.9) 51 (6.1) 177 (21.2) 41 (4.9) 834 14 to 19 222 (50.6) 77 (17.5) 27 (6.2) 59 (13.4) 54 (12.3) 439 Orphan status
Nonorphan 638 (60.8) 149 (14.2) 63 (6.0) 145 (13.8) 55 (5.2) 1,050
Paternal orphan – 77 (50.3) – 54 (35.3) 22 (14.4) 153
Maternal orphan – – 15 (41.7) 16 (44.4) 5 (13.9) 36
Double orphan – – – 21 (61.8) 13 (38.2) 34
Column percentages N (%) N (%) N (%) N (%) N (%) N (%)
Currently enrolled
No 116 (18.2) 45 (19.9) 14 (17.9) 34 (14.4) 33 (34.7) 242 (19)
Yes 522 (81.8) 181 (80.1) 64 (82.1) 202 (85.6) 62 (65.3) 1,031 (81) At correct grade for age
No 261 (47.9) 87 (46) 38 (56.7) 111 (54.7) 41 (63.1) 538 (50.3)
Yes 284 (52.1) 102 (54) 29 (43.3) 92 (45.3) 24 (36.9) 531 (49.7)
Progressed to secondary school
No 114 (51.6) 33 (43.4) 13 (48.1) 29 (49.2) 36 (67.9) 225 (51.6)
Yes 107 (48.4) 43 (56.6) 14 (51.9) 30 (50.8) 17 (32.1) 211 (48.4)
Mean (SD) Mean (SD) Mean (SD) Mean (SD) Mean (SD) Mean (SD)
Mean hours spent in
Education 5.9 (4.3) 6.1 (4.4) 5.9 (4.4) 6.2 (4.3) 4.4 (4.6) 5.9 (4.3) Leisure 9.5 (3.5) 9.7 (3.7) 9.7 (3.6) 9.6 (3.3) 10 (3.7) 9.6 (3.5) Chores 2.2 (2.4) 2.1 (1.9) 2.5 (2.6) 2.1 (2.3) 3.2 (3.1) 2.3 (2.4) Farm work 1.2 (2.6) 1 (2.6) 0.8 (1.9) 1.1 (2.5) 1 (2.3) 1.1 (2.5) Market work 0.2 (1.2) 0.1 (1) 0.1 (0.6) 0.1 (0.9) 0.4 (1.6) 0.2 (1.1) Total work 3.6 (3.3) 3.2 (3.1) 3.4 (3.2) 3.3 (3.1) 4.6 (3.7) 3.5 (3.3)
3.2 Educational outcomes
from children living with both biological parents in terms of either enrolment or progression to secondary school (Table 3; Figure 1). However, they do have lower odds of being at the correct grade for age. This is consistent with past disruption to schooling associated with the factors leading to fostering, for example parental death or economic hardship. It may also reflect lower levels of investment, or lower-quality investment in child education, resulting in a child being behind in school. Children fostered by more distant kin, on the other hand, experience relatively poor educational outcomes across all three measures compared to children living with both parents (Table 3; Figure 1). Among children living with just one biological parent, we also observe that children living only with their father have the lowest odds of being at the correct grade for age.
Table 3: Summary of logistic regression analysis predicting (1) enrolment (n = 1,256), grade for age (n = 1,053), and progression to secondary school (n = 432) for all children, and (2) enrolment (n = 326), grade for age (n = 263) and progression to secondary school (n = 111) among fostered children only
1 2
Enrolment Grade for age Progression Enrolment Grade for age Progression
Child lives with (ref = both parents)
Mother 0.98 0.99 1.54
[0.52,1.83] [0.62,1.59] [0.83,2.86]
Father 0.77 0.50+ 0.8
[0.31,1.91] [0.25,1.00] [0.31,2.06]
Close kin 1.09 0.51** 0.96
[0.58,2.06] [0.32,0.80] [0.49,1.90]
Distant kina 0.40* 0.29*** 0.30** 0.39* 0.79 0.33*
[0.19,0.84] [0.15,0.57] [0.14,0.64] [0.17,0.91] [0.41,1.52] [0.12,0.86] Orphan status (ref = nonorphan)
Paternal orphan 1.25 0.78 2.08
[0.47,3.35] [0.41,1.50] [0.61,7.07]
Maternal orphan 0.32 1.73 0.49
[0.08,1.26] [0.49,6.17] [0.09,2.57]
Double orphan 1.06 0.44+ 0.82
[0.32,3.48] [0.17,1.14] [0.19,3.55]
Female (ref = male) 1.3 1.46* 1.33 1.46 1.88* 1.36
[0.85,1.97] [1.08,1.97] [0.85,2.09] [0.69,3.12] [1.09,3.24] [0.52,3.58] Household assets (ref = basic)
Higher value 2.57* 1.33 3.80** 2.85 0.92 1.17
[1.03,6.43] [0.67,2.66] [1.51,9.59] [0.69,11.82] [0.33,2.53] [0.19,7.08]
Intermediate value 2.15* 0.9 1.35 1.86 1.22 1.37
[1.14,4.06] [0.53,1.51] [0.66,2.77] [0.68,5.08] [0.56,2.63] [0.30,6.19]
Household food security 1.03 1.03+ 1.06** 1.05 0.99 1.04
[0.99,1.07] [1.00,1.06] [1.01,1.10] [0.98,1.12] [0.94,1.04] [0.96,1.13]
Household size 1.01 0.99 0.96 0.99 0.97 1.02
[0.94,1.09] [0.94,1.05] [0.89,1.03] [0.88,1.10] [0.90,1.05] [0.89,1.16] Age order (ref = oldest)
Middle child 1.34 0.67+ 1.17 1.19 0.78 1.08
[0.82,2.18] [0.44,1.01] [0.68,2.01] [0.45,3.14] [0.36,1.70] [0.31,3.76]
Youngest child 0.83 1.04 1.09 0.83 1.17 1.35
[0.39,1.79] [0.64,1.68] [0.33,3.59] [0.22,3.13] [0.50,2.73] [0.18,10.11]
Town 4.50*** 4.34*** 4.51*** 4.81*** 3.61*** 9.08***
[2.52,8.04] [2.82,6.68] [2.72,7.48] [1.93,11.95] [1.84,7.07] [2.89,28.48]
Age 0.55*** 0.87*** 1.34*** 0.57*** 0.89* 1.46*
[0.49,0.61] [0.82,0.93] [1.16,1.56] [0.48,0.67] [0.80,0.99] [1.01,2.11]
Household random effect 0.96*** 0.85*** – – – –
[0.38,2.44] [0.43,1.68] – – – –
We predicted that among fostered children, orphans would be most disadvantaged as they are likely to receive reduced or nonexistent parental investment. We therefore investigated whether being an orphan accounts for some of the educational disadvantage seen among fostered children. There is suggestive evidence (i.e., p<0.1) that double orphans have lower odds of being at the correct grade for age, perhaps reflecting greater disruption to their studies as a result of two parental deaths. Results for maternal and paternal orphans were variable in direction and not statistically significant. An additional finding from the fostered-only model is that children fostered by distant kin have lower odds of all educational outcomes compared to those fostered by close kin.
3.3 Farm and paid work during past week
Table 4: Summary of logistic regression analyses predicting (1) farm work and paid work during past week (n = 1,256) for all children and (2) farm work and paid work during past week (n = 326) among fostered children only
1 2
Farm work Paid work Farm work Paid work
Child lives with (ref = both parents)
Mother 1.03 0.79
[0.61,1.74] [0.37,1.69]
Father 1.03 1.04
[0.47,2.27] [0.35,3.10]
Close kin 1.93* 1.39
[1.16,3.22] [0.72,2.71]
Distant kina 2.09* 1.25 1.06 1.13
[1.07,4.06] [0.55,2.87] [0.56,2.00] [0.44,2.90] Orphan status (ref = nonorphan)
Paternal orphan 0.49* 0.61
[0.25,0.97] [0.21,1.75]
Maternal orphan 0.67 0.8
[0.22,2.02] [0.16,4.04]
Double orphan 0.59 1.2
[0.22,1.54] [0.35,4.10]
Female (ref = male) 0.31*** 0.86 0.27*** 0.97
[0.22,0.43] [0.53,1.39] [0.15,0.46] [0.43,2.16] Household assets (ref = basic)
Higher value 0.7 1.41 1.25 0.44
[0.31,1.59] [0.52,3.80] [0.44,3.54] [0.12,1.68]
Intermediate value 1.22 0.98 1.12 0.15**
[0.69,2.15] [0.45,2.12] [0.54,2.34] [0.05,0.50]
Household food security 0.96* 0.96 0.96 1.01
[0.93,1.00] [0.92,1.01] [0.92,1.01] [0.93,1.08]
Household size 1.01 1.03 1 1.03
[0.95,1.08] [0.95,1.12] [0.93,1.08] [0.92,1.15] Age order (ref = oldest)
Middle child 1.42 0.71 2.32* 1.09
[0.93,2.18] [0.39,1.30] [1.08,4.96] [0.38,3.14]
Youngest child 1.13 0.76 1.73 0.91
[0.66,1.95] [0.32,1.78] [0.69,4.35] [0.24,3.51]
Town (ref = village) 0.08*** 1.53 0.15*** 2.58+
[0.05,0.14] [0.84,2.81] [0.08,0.29] [0.92,7.23]
Age 1.25*** 1.19*** 1.28*** 1.16+
[1.17,1.33] [1.08,1.30] [1.14,1.42] [0.99,1.35]
Household random effect 1.55*** 0.86** – –
[0.92,2.61] [0.25,2.94]
Figure 2: Predicted probability of doing farm work and paid work during past week, by child residence (predicted probabilities from Model 1 in Table 4; 95% confidence intervals; control variables are mean centred)
3.4 Trade-off between work and education
time in leisure and work relative to the time they spend in education, compared to those living with one or both parents. However, these results can only tell us about the effect of residence on the relationship between pairs of activities. The marginal effects from these models show the effect of residence on the relationship between all three activities. Figure 3 shows the absolute difference in hours of education, leisure and work between nonfostered and fostered children. Zero represents the reference category of children living with both parents; confidence intervals which cross zero indicate a nonsignificant difference. Children fostered by distant kin spend less time in education than nonfostered children and appear to trade this off with more time spent in leisure. There is a suggestion that they spend more time in work also, though this difference does not reach statistical significance (p = 0.233). No other differences in time allocation are apparent, with the exception that those living with just their mother spend slightly less time working than those living with both biological parents.
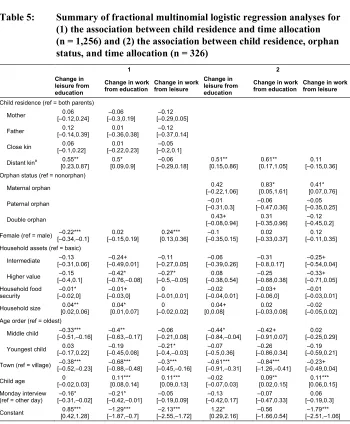
Table 5: Summary of fractional multinomial logistic regression analyses for (1) the association between child residence and time allocation (n = 1,256) and (2) the association between child residence, orphan status, and time allocation (n = 326)
1 2
Change in leisure from education
Change in work
from education Change in workfrom leisure Change in leisure from education
Change in work
from education Change in workfrom leisure
Child residence (ref = both parents)
Mother [–0.12,0.24]0.06 [–0.3,0.19]–0.06 [–0.29,0.05]–0.12
Father [–0.14,0.39]0.12 [–0.36,0.38]0.01 [–0.37,0.14]–0.12
Close kin [–0.1,0.22]0.06 [–0.22,0.23]0.01 [–0.2,0.1]–0.05
Distant kina 0.55** [0.23,0.87] 0.5* [0.09,0.9] –0.06 [–0.29,0.18] 0.51** [0.15,0.86] 0.61** [0.17,1.05] 0.11 [–0.15,0.36] Orphan status (ref = nonorphan)
Maternal orphan [–0.22,1.06]0.42 [0.05,1.61]0.83* [0.07,0.76]0.41*
Paternal orphan [–0.31,0.3]–0.01 [–0.47,0.36]–0.06 [–0.35,0.25]–0.05
Double orphan [–0.08,0.94]0.43+ [–0.35,0.96]0.31 [–0.45,0.2]–0.12
Female (ref = male) –0.22*** [–0.34,–0.1] 0.02 [–0.15,0.19] 0.24*** [0.13,0.36] –0.1 [–0.35,0.15] 0.02 [–0.33,0.37] 0.12 [–0.11,0.35] Household assets (ref = basic)
Intermediate [–0.31,0.06]–0.13 [–0.49,0.01]–0.24+ [–0.27,0.05]–0.11 [–0.39,0.26]–0.06 [–0.8,0.17]–0.31 [–0.54,0.04]–0.25+
Higher value [–0.4,0.1]–0.15 [–0.76,–0.08]–0.42* [–0.5,–0.05]–0.27* [–0.38,0.54]0.08 [–0.88,0.38]–0.25 [–0.71,0.05]–0.33+
Household food
security [–0.02,0]–0.01* [–0.03,0]–0.01+ [–0.01,0.01]0 [–0.04,0.01]–0.02 [–0.06,0]–0.03+ [–0.03,0.01]–0.01
Household size 0.04** [0.02,0.06] 0.04* [0.01,0.07] 0 [–0.02,0.02] 0.04+ [0,0.08] 0.02 [–0.03,0.08] –0.02 [–0.05,0.02] Age order (ref = oldest)
Middle child –0.33*** [–0.51,–0.16] –0.4** [–0.63,–0.17] –0.06 [–0.21,0.08] –0.44* [–0.84,–0.04] –0.42+ [–0.91,0.07] 0.02 [–0.25,0.29]
Youngest child [–0.17,0.22]0.03 [–0.45,0.08]–0.19 [–0.4,–0.03]–0.21* [–0.5,0.36]–0.07 [–0.86,0.34]–0.26 [–0.59,0.21]–0.19
Town (ref = village) [–0.52,–0.23]–0.38*** [–0.88,–0.48]–0.68*** [–0.45,–0.16]–0.3*** [–0.91,–0.31]–0.61*** [–1.26,–0.41]–0.84*** [–0.49,0.04]–0.23+
Child age [–0.02,0.03]0 [0.08,0.14]0.11*** [0.09,0.13]0.11*** [–0.07,0.03]–0.02 [0.02,0.15]0.09** [0.06,0.15]0.11***
Monday interview (ref = other day)
–0.16* [–0.31,–0.02] –0.21* [–0.42,–0.01] –0.05 [–0.19,0.09] –0.13 [–0.42,0.17] –0.07 [–0.47,0.33] 0.06 [–0.19,0.3]
Constant [0.42,1.28]0.85*** [–1.87,–0.7]–1.29*** [–2.55,–1.72]–2.13*** [0.29,2.16]1.22* [–1.66,0.54]–0.56 [–2.51,–1.06]–1.79***
Note:a For second set of models, the reference category for distant kin is close kin. + p<0.10, * p<0.05, ** p<0.01, *** p<0.001.
not appear to work more. Maternal orphans spend more time working than children living with both parents, trading this off against marginally reduced time in education and leisure. Paternal orphans do not appear to differ from nonorphans in their time allocation. Those fostered by distant kin spend more time in leisure and work, and less time in education, relative to those fostered by close kin (Table 5, Model 2).
Figure 4: Among fostered children only (n = 326), difference between orphaned and nonorphaned foster children in hours spent in education, leisure, and work on previous weekday, from fractional multinomial logistic regression models adjusting for child age, gender, residence with distant kin, age order, town residence, household food security, assets, and size, and for interviews done on a Monday
4. Discussion
either close kin or distant kin are more likely to report doing farm work in the previous week than other children, although we detect no differences between fostered and nonfostered children in time allocation to work when reporting on the previous weekday. This is likely to be because the previous week variable captures farm work done on weekends; it may be that foster children’s time is protected during the week when they attend school, but that they are more likely to work at weekends. These findings, combined with the observation that children are active producers in this population (see Hedges et al. 2018), suggest that children’s work contributions may be important in offsetting some of the costs to their foster households. While the impact of foster children’s work on their schooling may be limited, there may be other consequences, for example other studies have suggested that foster children’s workload may negatively impact their nutritional status due to higher energetic requirements (Prall and Scelza 2017; Reghupathy et al. 2012).
There are few differences between the characteristics of households with and without foster children (see also Lawson et al. 2017). However, households fostering children are more likely to own land and have more older individuals (aged 60 and over) who may be less able to contribute to household work, which is consistent with a greater demand for children’s work. In informal discussions during data collection, household members said fostering was most often done by grandparents, particularly grandmothers, who wanted company or help with household work, or children living with relatives in order to attend school, suggesting that purposive fostering, where households actively foster children in, is common in this context. Households fostering children are larger but not more wealthy or food secure. Without longitudinal data we cannot tell what effect fostering has on households, though other studies have suggested that the circulation of children between households may reduce wealth differentials between households and even out the labour supply (Serra 2009; Goody 1982).
parent-child conflict over schooling, with some adolescents wishing to drop out of school, and so running away from home to avoid going. Some of those living with distant kin may therefore be fostered because they do not want to be enrolled in school, as opposed to being less likely to be enrolled because they are fostered.
Parental death has historically been a relatively uncommon reason for children being fostered in sub-Saharan Africa (Gaydosh 2015), and in northern Tanzania specifically, accounts for a minority of cases where children live away from their parents (Lawson et al. 2017). We anticipated that orphans represent a situation of ‘crisis fostering’ and would therefore be particularly disadvantaged among fostered children. However, we find little evidence of this. Double orphans are marginally less likely to be at the correct grade for their age, perhaps reflecting greater disruption to their schooling as the result of both parents having died. This presumably accounts for them spending less time in education on weekdays, as at a given age, they are at a lower grade and so spend less time in school. However, this does not seem to result in them spending more time working. Paternal orphans do not differ from other fostered children on educational measures or time allocation, although they do appear to be less likely to do farm work in the previous week. Maternal orphans, on the other hand, do appear to work slightly more on weekdays, and this marginally reduces their time spent in education and leisure.
be more likely to switch investment away from their previous children, and that paternal orphans may be more exposed to negative step parental discrimination (Daly and Wilson 1988).
Overall though, it is perhaps most interesting that orphans do not appear particularly disadvantaged. The portrayal of orphans in the media, policy, and research is often focused on their vulnerability and lack of resources (Abebe 2012). In the wake of the HIV/AIDS epidemic and increased adult mortality, the incidence of ‘crisis fostering’ of orphans appears to have increased in frequency in some regions, with some commentators concerned that this puts pressure on traditional fostering networks, reducing households’ ability to foster nonorphans (Grant and Yeatman 2012). During the 1990s, orphan prevalence increased significantly in Tanzania in response to the HIV epidemic (Bicego, Rutstein, and Johnson 2003). However, in many contexts such as this one, with a strong tradition of fostering and care by close kin, orphans appear to be buffered from parental loss by high levels of investment from close kin, particularly by grandparents.
4.1 Limitations
In common with many studies of fostering, we lack data on the households in which children would otherwise be living, and on the reasons for children living away from their parents, and so cannot say whether fostering actively benefits children in our sample or not. Using longitudinal data would enable the investigation of how children’s outcomes change as they move from one household to another, as well as how factors such as length of foster placement influence outcomes. Additionally, some children may retain closer links to their parents, and may continue to receive investment, for example school fees, while others may move more permanently and rely more heavily on their foster household for investment; collecting data on monetary assistance from people outside the household might highlight circumstances in which parents continue to invest in nonresident children. In this study we control for household factors but cannot explicitly compare foster children with biological children within the same household, due to the manner in which household member relationships were recorded. However, this would be an interesting avenue for future work.
4.2 Conclusions
predicted to reduce children’s well-being, and be costly to foster parents. Our findings suggest that children’s work contributions may help explain this puzzle, allowing foster children to offset some of their costs and hence receive similar levels of investment to children living with their biological parents. While this appears to hold when there is a close genetic link between foster child and foster parents, distant kin appear less willing to invest as much in foster children’s education. Our results also indicate that fostering networks are important in buffering orphans well from parental loss, even in a context such as this one where orphanhood has increased in the wake of the HIV epidemic. The focus in international policy and the media is often on fostered and orphaned children’s vulnerability (Abebe 2012; Akresh 2004). However, in contexts such as this, with a strong tradition of fostering, kin reciprocity and altruism, and children’s own productive contributions to their households, fostering may in fact be a beneficial part of socialisation, family relationships, and household livelihoods.
5. Acknowledgements
References
Abebe, T. (2012). AIDS-affected children, family collectives and the social dynamics of care in Ethiopia. Geoforum 43(3): 540–550. doi:10.1016/j.geoforum.2011. 10.010.
Ainsworth, M., Beegle, K., and Koda, G. (2002). The impact of adult mortality on primary school enrollment in Northwestern Tanzania. Washington, D.C.: The World Bank (Africa Region Human Development Working Paper Series 23961).
http://documents.worldbank.org/curated/en/989271468778486753/pdf/multi0pa ge.pdf.
Akresh, R. (2004). Adjusting household structure: School enrollment impacts of child fostering in Burkina Faso. Bonn: Institute for the Study of Labor (IZA Discussion Paper 1379).http://ftp.iza.org/dp1379.pdf.
Assaad, R., Levison, D., and Zibani, N. (2010). The effect of domestic work on girls’ schooling: Evidence from Egypt. Feminist Economics 16(1): 79–128.
doi:10.1080/13545700903382729.
Bhalotra, S. and Heady, C. (2001). Child farm labour: The wealth paradox. Washington, D.C.: The World Bank (SP Discussion Paper 125).
http://documents.worldbank.org/curated/en/247341468774880478/pdf/multi0pa ge.pdf.
Bicego, G., Rutstein, S., and Johnson, K. (2003). Dimensions of the emerging orphan crisis in sub-Saharan Africa. Social Science and Medicine 56(6): 1235–1247.
doi:10.1016/S0277-9536(02)00125-9.
Bledsoe, C. (1990). ‘No success without struggle’: Social mobility and hardship for foster children in Sierra Leone.Man 25(1): 70–88.doi:10.2307/2804110.
Boerma, J.T., Urassa, M., Nnko, S., Ng’weshemi, J., Isingo, R., Zaba, B., and Mwaluko, G. (2002). Sociodemographic context of the AIDS epidemic in a rural area in Tanzania with a focus on people’s mobility and marriage. Sexually
Transmitted Infections78(S1): i97–i105.doi:10.1136/sti.78.suppl_1.i97.
Burke, K. and Beegle, K. (2004). Why children aren’t attending school: The case of Northwestern Tanzania. Journal of African Economies 13(2): 333–355.
doi:10.1093/jae/ejh011.
Chuong, C. and Operario, D. (2012). Challenging household dynamics: Impact of orphanhood, parental absence, and children’s living arrangements on education in South Africa. Global Public Health 7(1): 42–57. doi:10.1080/17441692. 2011.574147.
Clarke, P. (2008). When can group-level clustering be ignored? Multi-level versus single-level models with sparse data.Journal of Epidemiology and Community
Health 62: 752–758.doi:10.1136/jech.2007.060798.
Coall, D.A. and Hertwig, R. (2010). Grandparental investment: Past, present, and future. Behavioral and Brain Sciences 33(1): 40–59. doi:10.1017/S01405 25X10000014.
Coates, J., Swindale, A., and Bilinsky, P. (2007). Household Food Insecurity Access Scale (HFIAS) for measurement of household food access: Indicator guide: Version 3. Washington, D.C.: FANTA. https://www.fantaproject.org/sites/ default/files/resources/HFIAS_ENG_v3_Aug07.pdf.
Daly, M. and Perry, G. (2017). Matrilateral bias in human grandmothering.Frontiers in
Sociology 2(11): 1–8.doi:10.3389/fsoc.2017.00011.
Daly, M. and Wilson, M. (1988). Evolutionary social psychology and family homicide.
Science242(4878): 519–524.doi:10.1126/science.3175672.
Eloundou-Enyegue, P.M. and Stokes, C.S. (2002). Will economic crises in Africa weaken rural–urban ties? Insights from child fosterage trends in Cameroon.
Rural Sociology 67(2): 278–298.doi:10.1111/j.1549-0831.2002.tb00104.x.
Euler, H.A. and Weitzel, B. (1996). Discriminative grandparental solicitude as reproductive strategy.Human Nature 7(1): 39–59.
Fafchamps, M. and Wahba, J. (2006). Child labor, urban proximity, and household composition.Journal of Development Economics 79(2): 374–397. doi:10.1016/ j.jdeveco.2006.01.005.
Fleisch, B., Shindler, J., and Perry, H. (2012). Who is out of school? Evidence from the Statistics South Africa Community Survey.International Journal of Educational
Franklin, P. and Volk, A.A. (2016). Evolutionary paradox: Adoption. In: Shackelford, T.K. and Weekes-Shackelford, V.A. (eds.). Encyclopedia of evolutionary
psychological science. Cham: Springer International.
doi:10.1007/978-3-319-16999-6_2274-1.
Gaydosh, L. (2015). Childhood risk of parental absence in Tanzania. Demography
52(4): 1121–1146.doi:10.1007/s13524-015-0411-4.
Goody, E.N. (1982).Parenthood and social reproduction: Fostering and occupational
roles in West Africa. Cambridge: Cambridge University Press.
Grant, M.J. and Yeatman, S. (2012). The relationship between orphanhood and child fostering in sub-Saharan Africa, 1990s–2000s. Population Studies 66(3): 279– 295.doi:10.1080/00324728.2012.681682.
Hadley, C. (2005). Ethnic expansions and between-group differences in children’s health: A case study from the Rukwa Valley, Tanzania. American Journal of
Physical Anthropology128(3): 682–692.doi:10.1002/ajpa.20056.
Hamilton, W.D. (1964). The genetical evolution of social behaviour (I and II).Journal
of Theoretical Biology 7(1): 1–52. doi:10.1016/0022-5193(64)90038-4,
doi:10.1016/0022-5193(64)90039-6.
Hampshire, K.R., Porter, G., Agblorti, S., Munthali, A., and Abane, A. (2015). Context matters: Fostering, orphanhood and schooling in sub-Saharan Africa.Journal of
Biosocial Science 47(2): 141–164.doi:10.1017/S0021932014000169.
Hedges, S., Sear, R., Todd, J., Urassa, M., and Lawson, D.W. (2018). Trade-offs in children’s time allocation: Mixed support for embodied capital models of the demographic transition in Tanzania. Current Anthropology 59(5): 644–654.
doi:10.1086/699880.
Kanjala, C., Michael, D., Todd, J., Slaymaker, E., Calvert, C., Isingo, R., Wringe, A., Zaba, B., and Urassa, M. (2012). The impact of antiretroviral therapy on adult mortality in rural Tanzania. Tropical Medicine and International Health 17(8): e58–e65.doi:10.1111/j.1365-3156.2011.02924.x.
Kishamawe, C., Isingo, R., Mtenga, B., Zaba, B., Todd, J., Clark, B., Changalucha, J., and Urassa, M. (2015). Health and demographic surveillance system profile: The Magu Health and Demographic Surveillance System (Magu HDSS).
International Journal of Epidemiology 44(6): 1851–1861. doi:10.1093/ije/
Larmuseau, M.H.D., Matthijs, K., and Wenseleers, T. (2016). Cuckolded fathers rare in human populations. Trends in Ecology and Evolution 31(5): 327–329.
doi:10.1016/j.tree.2016.03.004.
Lawson, D.W., James, S., Ngadaya, E., Ngowi, B., Mfinanga, S.G.M., and Borgerhoff Mulder, M. (2015). No evidence that polygynous marriage is a harmful cultural practice in Northern Tanzania. PNAS 112(45): 13827–13832. doi:10.1073/ pnas.1507151112.
Lawson, D.W., Schaffnit, S.B., Hassan, A., Ngadaya, E., Ngowi, B., Mfinanga, S.G.M., James, S., and Borgerhoff Mulder, M. (2017). Father absence but not fosterage predicts food insecurity, relative poverty, and poor child health in Northern Tanzania. American Journal of Human Biology 29(3): e22938. doi:10.1002/ ajhb.22938.
Lopus, S. (2017). Relatives in residence: Relatedness of household members drives schooling differentials in Mozambique.Journal of Marriage and Family 79(4): 897–914.doi:10.1111/jomf.12393.
Madhavan, S., Myroniuk, T.W., Kuhn, R., and Collinson, M.A. (2017). Household structure vs. composition: Understanding gendered effects on educational progress in rural South Africa. Demographic Research 37(59): 1891–1916.
doi:10.4054/DemRes.2017.37.59.
Monasch, R. and Boerma, J.T. (2004). Orphanhood and childcare patterns in sub-Saharan Africa: An analysis of national surveys from 40 countries.AIDS 18(S2): 55–65.doi:10.1097/00002030-200406002-00007.
Moyi, P. (2010). Household characteristics and delayed school enrollment in Malawi.
International Journal of Educational Development 30(3): 236–242.doi:10.1016/
j.ijedudev.2009.11.008.
Novella, R. (2018). Orphanhood, household relationships, school attendance and child labor in Zimbabwe. Journal of International Development 30(5): 725–744.
doi:10.1002/jid.3353.
Oleke, C., Blystad, A., Fylkesnes, K., and Tumwine, J.K. (2007). Constraints to educational opportunities of orphans: A community-based study from Northern Uganda.AIDS Care 19(3): 361–368.doi:10.1080/09540120600677987.
Perry, G., Daly, M., and Macfarlan, S. (2014). Maternal foster families provide more stable placements than paternal families. Children and Youth Services Review
46: 155–159.doi:10.1016/j.childyouth.2014.08.016.
Prall, S.P. and Scelza, B.A. (2017). Children fosterage and sex-biased nutritional outcomes among Namibian pastoralists. American Journal of Human Biology
29(6): e23058.doi:10.1002/ajhb.23058.
Reghupathy, N., Judge, D.S., Sanders, K.A., Canisio Amaral, P., and Schmitt, L.H. (2012). Child size and household characteristics in rural Timor-Leste.American
Journal of Human Biology24(1): 35–41.doi:10.1002/ajhb.21232.
Roby, J.L., Erickson, L., and Nagaishi, C. (2016). Education for children in sub-Saharan Africa: Predictors impacting school attendance. Children and Youth
Services Review 64: 110–116.doi:10.1016/j.childyouth.2016.03.002.
Scelza, B.A. and Silk, J.B. (2014). Fosterage as a system of dispersed cooperative breeding: Evidence from the Himba. Human Nature 25(4): 448–464.
doi:10.1007/s12110-014-9211-6.
Schaffnit, S.B., Hassan, A., Urassa, M., and Lawson D.W. (2019). Parent-offspring conflict unlikely to explain ‘child marriage’ in northwestern Tanzania. Nature
Human Behaviour 3: 346–353.doi:10.1038/s41562-019-0535-4.
Schaffnit, S.B., Urassa, M., and Lawson, D.W. (2019). ‘Child marriage’ in context: Exploring local attitudes towards early marriage in rural Tanzaniza. Sexual and
Reproductive Health Matters 27(1): 1571304. doi:10.1080/09688080.2019.
1571304.
Sear, R. and Mace, R. (2008). Who keeps children alive? A review of the effects of kin on child survival. Evolution and Human Behavior 29(1): 1–18. doi:10.1016/ j.evolhumbehav.2007.10.001.
Serra, R. (2009). Child fostering in Africa: When labor and schooling motives may coexist. Journal of Development Economics 88(1): 157–170. doi:10.1016/j. jdeveco.2008.01.002.
Shapiro, D. and Tambashe, B.O. (2001). Gender, poverty, family structure, and investments in children’s education in Kinshasa, Congo. Economics of
Education Review 20(4): 359–375.doi:10.1016/S0272-7757(00)00059-5.
Urassa, M., Boerma, J.T., Ng’weshemi, J.Z.L., Isingo, R., Schapink, D., and Kumogola, Y. (1997). Orphanhood, child fostering and the AIDS epidemic in rural Tanzania.Health Transition Review 7(S2): 141–153.
Varkevisser, C.M. (1973). Socialization in a changing society: Sukuma childhood in
rural and urban Mwanza, Tanzania. The Hague: Centre for the Study of
Education in Changing Societies.
Wijsen, F. and Tanner, R. (2002). ‘I am just a Sukuma’: Globalization and identity
construction in Northwest Tanzania. Amsterdam: Rodopi. doi:10.1163/9789
004334311.