VOLUME 39, ARTICLE 9, PAGES 285
,
314
PUBLISHED 10 AUGUST 2018
http://www.demographic-research.org/Volumes/Vol39/9/ DOI: 10.4054/DemRes.2018.39.9
Research Article
Parents’ subjective well-being after their first
child and declining fertility expectations
Francesca Luppi
Letizia Mencarini
© 2018 Francesca Luppi & Letizia Mencarini.
This open-access work is published under the terms of the Creative Commons Attribution 3.0 Germany (CC BY 3.0 DE), which permits use, reproduction, and distribution in any medium, provided the original author(s) and source are given credit.
1 Introduction 286
2 Fertility expectations and their determinants: Literature review and
research hypotheses 287
3 Life satisfaction after the first child as a key determinant in further
fertility expectations 289
4 Data and variables 292
5 Method 294
6 Results 297
7 Conclusion 301
References 303
Parents’ subjective well-being after their first child
and declining fertility expectations
Francesca Luppi1
Letizia Mencarini2
Abstract
BACKGROUND
Recent studies have suggested a decline in subjective well-being after the birth of a first child. Yet parents’ subjective well-being is, in general, linked positively to wanting and to having additional children.
OBJECTIVE
The paper addresses the question of whether new parents’ satisfaction with their overall life and several specific life spheres modifies their expectations about having a second, or further, child.
METHODS
Relying on twelve waves of the Household, Income and Labour Dynamics in Australia panel survey (2001–2012), we apply piecewise growth models to a sample of individuals in couples who experience parenthood for the first time. We model, separately by gender, the relationship between satisfaction in seventeen life domains, overall life satisfaction, and fertility expectations during the first three years following the birth of a first child.
RESULTS
Results suggest that a decline in new parents’ life satisfaction, overall and in different life domains, is associated with a significant decline in fertility expectations. The most important domains are family, social relationship, and work, although with differences by gender. In fact, mothers’ fertility expectations are positively associated with their satisfaction with career prospects and with their work–family balance, whereas, for fathers, fertility expectations are positively associated with their financial situation.
CONTRIBUTION
Our study provides strong evidence that several life domains – and new parents’
1 Bocconi University, Milano, Italy. Email:[email protected]
changes in satisfaction with regard to them – are important in elucidating the mechanism linking fertility expectations and the first child.
1. Introduction
Recent studies have suggested a significant decline in subjective well-being – measured either as happiness or as life satisfaction – following childbearing events (Clark et al. 2008; Frijters, Johnston, and Shields 2011; Margolis and Myrskylä 2011; Myrskylä and Margolis 2014; Pollman-Schult 2014). Yet subjective well-being is positively linked to wanting and to having additional children (e.g., Perelli-Harris 2006; Parr 2010; Le Moglie, Mencarini, and Rapallini 2015; Luppi 2016). The birth of the first child therefore affects not only the parents’ subjective well-being but also subsequent fertility. The aim of this paper is to analyse how, after the birth of the first child, parents’ satisfaction across life domains changes a couple’s expectations about having another child.
Fertility expectations refer to an individual’s perception of the likelihood of having a child. The concept differs from fertility intentions – i.e., an individual’s plans with respect to childbearing – because fertility expectations encompass both situational resources and any relevant constraints – measuring, in some way, the perceived probability of having children (Miller and Pasta 1995). Therefore, an individual’s fertility expectations also capture the fertility intentions of the partner, and, as a consequence, they are a closer measure of actual fertility behaviour (Miller, Severy, and Pasta 2004; Miller 2011). Unlike an individual’s ideals or abstract desires for fertility, these expectations, as well as intentions, change over an individual’s reproductive life (Heiland, Prskawetz, and Sanderson 2008). Sociodemographic factors appear relevant in shaping fertility expectations, but so, too, do life-course events (Miller and Pasta 1995). Among those events, a crucial one is, obviously, the first parental experience, which naturally affects parents’ plans for additional children.
This empirical analysis is implemented by using a sample of couples from twelve waves (starting from 2001) of the Household, Income and Labour Dynamics in Australia (HILDA) panel survey. Australia is particularly interesting for the aim of our study. Among Western countries, the Australian fertility rate is relatively high (just under replacement level). Public services are in comparison rather limited, and there is a lack of strong policies sustaining the employment of mothers – a feature that maintains gender roles unequal in both work (Losoncz and Bortolotto 2009) and family domains (Baxter et al. 2015). Australia’s (arguably) liberal welfare system has been accused of increasing gender inequality (McDonald 2001; Brennan 2007). For this reason, becoming a parent in Australia may imply very different consequences for men and women in the various life spheres. We test our research hypotheses on life satisfaction changes across key life domains during the four years after the birth of the first child to see how they affect parents’ fertility expectations. We do so with piecewise growth models, as a standard model for analysing change (Singer and Willet 2003).
2. Fertility expectations and their determinants: Literature review
and research hypotheses
fertility desires are typically greater than fertility expectations. Fertility desires are stable, or change only over the long run, and they are not affected by changes in reported fertility expectations. In the short term, changes in situational factors can affect fertility expectations (Heiland, Prskawetz, and Sanderson 2008), either positively or negatively, but these short-term fluctuations have little impact on fertility desires and motivations (Berrington 2004; Mitchell and Gray 2007; Hayford 2009).
The difference between expectations and intentions is not clearly set out in the literature on demography. This lack of clarity is, in part, driven by their similarity in terms of their conceptual definitions, but also because household surveys usually include only one of the two. A number of studies focus on the determinants of fertility expectations and intentions, though rarely both at the same time. However, expectation determinants tend to be similar to intention determinants (Gray, Evans, and Reimonds 2013). As a result, when referring to the empirical literature, we do not make a clear distinction between the two.
Some effects are obvious and clear-cut across studies and contexts. Age is a strong driver of fertility expectations and intentions. Age represents a biological, social, and cultural constraint for women that negatively affects both the individual’s and the partner’s expectations (Coenen-Huther 2005; Billari et al. 2011; Iacovou and Tavares 2011; Gray, Evans, and Reimonds 2013). Along the same lines, women’s health is important (Gray, Evans, and Reimonds 2013). Some fundamental life events matter too – such as entering into a relationship or getting married– which positively affects both women’s and men’s childbearing intentions (Iacovou and Tavares 2011; Liefbroer 2009), while separation, obviously, is followed by a downwards revision in fertility intentions (Qu, Weston, and Kilmartin 2000).
negative relationship between women working full time and fertility expectations for both partners (e.g., Liefbroer 2009) because of possible work–family conflicts and the perceived negative consequences of childbearing for women’s careers. In Australia, the amount of childcare and housework done by mothers seems to negatively and consistently affect the chances of having another child (Craig and Siminsky 2011). However, the effect of employment or income characteristics on changing expectations has been found to be very mixed, and weaker, if compared to the effects of age and the quality of the relationship with a partner (Liefbroer 2009; Iacovou and Tavares 2011).
Another important characteristic that can drive the heterogeneity of the effects on reproductive motivation and behaviour is explored in Miller (1992) and Miller and colleagues (1999; 2000). They theorize and test whether personality traits in adulthood determine fertility motivation and fertility intentions in the reproductive years. Their results support the idea that genes and personality traits matter, at least in part, for fertility motivation. While these studies, focused on the link between personality, genes, and fertility outcomes (Jokela et al. 2011; Dijkstra and Barelds 2009; Jokela and Keltikangas-Järvinen 2009), give less attention to the potential link with fertility expectations or intentions. Studies do find, however, that personality traits such as neuroticism, agreeableness, and extraversion matter in fertility outcomes. Neuroticism, especially, is typically related to difficulties in adjusting in the face of stressful life events and to low fertility and to fertility postponement.
3. Life satisfaction after the first child as a key determinant in
further fertility expectations
A large body of studies suggests that there is a decline in individuals’ subjective well-being – either happiness or life satisfaction3 – once parenthood begins (Clark et al.
2008; Frijters, Johnston, and Shields 2011; Margolis and Myrskylä 2011; Myrskylä and Margolis 2014; Pollman-Schult 2014; see Kohler and Mencarini 2016 for a review). The effect of childbirth on subjective well-being depends, however, on parents’ socioeconomic characteristics; the life-course stage in which childbirth happens; and where they live and its context (Kohler, Behrman, and Skytthe 2005; Aassve, Goisis,
3 According to Tov (2018), there are two major approaches to conceptualizing being: eudemonic
and Sironi 2012; Myrskylä and Margolis 2014; Aassve, Mencarini, and Sironi 2015; Matysiak, Mencarini, and Vignoli 2016). Without going into the determinants of average changes (see Kohler and Mencarini 2016), we can intuitively affirm that changes in parents’ subjective well-being and changes in fertility expectations are part of the same process of adjustment in the transition to parenthood. As Miller (2011: 93) argues, “using intentions […], one is measuring something that already reflects adjustment and compromises to what individuals would really like, changes that are results of situational constraints and internal conflicts.” Recent papers show how subjective well-being affects an individual’s fertility expectations. Perelli-Harris (2006) demonstrates that, in Russia, subjective well-being is significant and is positively related to wanting and to having additional children. Using the European Social Survey, Billari (2009) finds that happier people have stronger intentions of having a child. Meanwhile, recent analysis confirms that the additional happiness that parents anticipate while having children becomes a key driver in childbearing decisions (Billari and Kohler 2009). These effects depend on parity, however (Margolis and Myrskylä 2011; Myrskylä and Margolis 2014; Le Moglie, Mencarini, and Rapallini 2015), simply because those who have already had a child will learn from their experiences. Consequently, one would expect that any parents who have a difficult time with their first child would experience lower subjective well-being and would, as a result, negatively revise their fertility expectations or intentions. Meanwhile, a positive experience with a first child should, it might be reasoned, lead to a positive revision. Thinking of this dynamic, our first hypothesis is that there would be a strong positive relationship between fertility expectations and overall life satisfaction.
One important limitation of existing studies is that subjective well-being is usually represented through a single comprehensive measure, such as overall life satisfaction or overall happiness (Veenhoven et al. 1993; Diener et al. 1999). As far as we know, only in psychology is subjective well-being broken down into several domains, with the acknowledgement that not only is subjective well-being necessarily multidimensional, but also that different life events can affect subjective well-being differently in different domains. Therefore, overall life satisfaction emerges also from an articulated system of satisfaction within life domains (Erdogan et al. 2012; Loewe et al. 2014). The multidimensionality of life satisfaction needs to be acknowledged.
In a recent work (Aassve, Luppi, and Mencarini 2018) Aassve and colleagues find that, regarding parents’ satisfaction with life domains, some people are more reactive to childbirth than others. In other words, the change in overall life satisfaction during the transition to parenthood is associated with changes in specific life satisfaction domains. In particular, the satisfaction with the partner relationship is, apparently, one of the most important domains for both men and women. Then, satisfaction with the quality of leisure time, health (for women), and finances (for men) stand out as the life dimensions most affected by the arrival of a newborn.
Other studies provide important references for hypothesizing possible relationships between domain-specific life satisfaction and the parents’ decision to have another child. Among the life domains, satisfaction with social relationships and satisfaction with work have proved to be particularly important for planning a birth (Argyle and Martin 1991).
Social relationships can provide emotional and practical support and can protect others from mental distress. One specific hypothesis here is that the perception of belonging and integration in a community, and consequently the sense that one is supported by others, can help parents overcome the difficulties of parenthood. According to this hypothesis, this sense of belonging and integration can then be a positive factor in planning for another child.
Satisfaction at work represents a dominant component of adults’ identity (Furnham 1991), but the effect of work-related satisfaction on fertility expectations differs by gender. For men, there is no clear relationship between job satisfaction and fertility desires, except in as much as there can be the negative effect of unemployment and income uncertainty (Wicki 1999; Kreyenfeld, Andersson, and Pailhé 2012). For women, however, satisfaction with the work–family balance favours higher fertility (Rogers 1996; Haddock et al. 2006), especially for those with tertiary degrees (Baxter 2013). The consequent hypotheses for our study are that satisfaction with a given financial situation and job stability would positively affect fathers’ fertility expectations, while a good work–family balance would favour a mother’s fertility expectations.
post-partum experience can negatively affect the propensity to have additional children (Newman 2008).
Overall, we hypothesize that there is a positive relationship between fertility expectations and satisfaction with each life domain. In other words, we would expect that an increase in satisfaction in one life domain would be associated with an increase in fertility expectations. However, according to the existing literature, we argue that not all domains are equally important for fertility expectations, and that their relevance can even differ between men and women. In particular, for the work domain, we hypothesize that satisfaction with finances and free time are especially important for men’s fertility expectations because of the still widespread traditional model of the father-breadwinner. For women, satisfaction with the work–family balance and satisfaction with employment prospects might be more relevant because the mother is, to a greater extent, in charge of caring tasks. Therefore, enjoying a satisfying relationship is relevant for mothers when planning for another child, as this satisfaction might be a signal of generosity on the part of the partner in terms of practical and emotional support during childbearing and its related activities. Finally, because of the physical burden associated with pregnancy, health satisfaction also becomes important for a woman thinking of having another child.
4. Data and variables
We used the first twelve waves (2001–2012) of the HILDA panel survey. The total sample in the first wave is made up of about 19,000 individuals. We selected 974 first-time parents, men and women in couples, where there is complete information for mothers and their partners for the year of the birth of their first child; women were not older than 454; and no partners had children from a previous relationship. Of the
selected individuals, 7% did not answer the questions on fertility expectations and life satisfaction, and a lower percentage (from 1% to 5% according to the year) did not answer questions on the life satisfaction domains. Our final subsample with complete information was made up of 836 individuals (418 couples) at the year of the birth of the first child.
Couples may exit from the sample either through survey attrition or by having a second pregnancy. One year after the birth of the first child, 129 couples were no longer in our sample because they had experienced a second pregnancy; another 30 exited the sample through attrition. Two years later, 90 were no longer included because of a second pregnancy, whereas 41 disappeared through attrition. Finally, three years after
the first birth, 72 couples remained in the sample (21 more had had a second pregnancy, and 45 had disappeared through attrition).
The dependent variables of our model are fertility expectations as given by interviewees
.
Information about fertility expectations are collected with the annual question “How likely are you to have a child/more children in the future?” Individuals respond on a scale from 0 (very unlikely) to 10 (very likely). The overall partners’ correlation on fertility expectation is high (ρ = 0.78), meaning that the perceived probability of experiencing a future pregnancy depends, as well, upon them sharing a partner’s intentions.Satisfaction with overall life is asked every year thus: “How satisfied are you with your life,” where the scale goes from 0 (totally dissatisfied) to 10 (totally satisfied). There is a high positive correlation between overall life satisfaction and fertility expectations for both men and women (ρ = 0.64). In addition, HILDA contains seventeen variables that measure the individual’s level of satisfaction with specific domains, scaled 0 to 10. The satisfaction domains included in the analyses are satisfaction with: 1) their job in general (including all aspects of the job, such as working hours, pay, security, kind of work, etc.); 2) working hours; 3) pay; 4) job security; 5) kind of work; 6) work–family balance; 7) employment opportunities; 8) financial situation; 9) free time (amount); 10) home; 11) neighbourhood; 12) feeling of belonging to the local community; 13) feeling safe; 14) health; 15) relationship with their partner; 16) relationship with their parents; and 17) relationship with their child(ren).
The HILDA dataset is well designed for doing couples analysis. Unlike other surveys, where the partner’s characteristics are often reported by the respondent, HILDA collects information directly from all the household members. This design enables control for a large set of partners’ characteristics that might affect fertility expectations. Among these characteristics, we include the main determinants as they emerged in the previous literature and as they are available in our data set. Therefore, we consider personal characteristics such as age; educational attainment; employment status (employed, unemployed, or inactive, and whether employment is part time or full time); being married vs. cohabiting; and personal health. We also include personality traits. In HILDA, personality traits are derived from the 36 items of the TDA Five Factors Personality Inventory, which reconstructs the individual’s position in terms of the five personality traits described in the Big Five Model (McCrae 1991; McCrae and Costa 1991): openness, conscientiousness, emotional stability (which is the converse of neuroticism), agreeableness, and extraversion.5 Including personality traits is a way to
control for unobservable heterogeneity (Le Moglie, Mencarini, and Rapallini 2015).
Regarding household and couples’ characteristics, we include the equivalent disposable household income; the outsourcing of childcare services; and childcare and housework as shared between partners.
5. Method
In our analysis we would like to assess how parents change their fertility expectations in the years after the birth of their first child and the determinants of this change. We test our research hypotheses with piecewise growth models, i.e., a multilevel model for analysing a process of change. We first include individual predictors that shape the individual trajectories (Level 1), then find the random component that shifts estimated trajectory curves of individuals (Level 2). This method allows for individual trajectories to differ from each other, but also allows for different effects (slopes) of the same independent variables over time. The ‘discontinuity points’ for the piecewise function are defined by introducing five dummy variables, one for each year across the birth of the child: the pregnancy year (preg); the year of birth (birth); the child’s first year of life (first); then the second year (second); and the third year of life of the child (third). Formally, the model is expressed as:
Yij = π0ipregij+ π1ibirthij+ π2ifirstij+ π3isecondij + π4ithirdij + εij. (1)
The coefficients are parameterized as πni= γn0+ ξni, where γn0is the intercept and ξni
is the random slope. The subscript i refers to the individual at Level 1, while the subscript j refers to the individual at Level 2. The model that includes time-invariant variables (Xij), time-variant variables (Zij), and the piecewise function (π0i pregij+ π1i
birthij+ π2i firstij+ π3i secondij + π4i thirdij) is expressed as:
Yij = Xijβ + π0i pregij+ π1i birthij+ π2i firstij+ π3i secondij + π4i thirdij + Zijtiλ+ εij, (2)
where Zijtiis the vector of time-dependent covariates, ti is the time variable, with values
from 0 to 4 according to the time period, and Xijare time-independent covariates.
for the modelling of changes on the dependent variables, taking into account both within and between variability among individuals. Second, it does not require a balanced design in the sense that, as far as attrition is random, one can impose the Missing At Random (MAR) assumption, under which the estimation of multilevel growth model parameters is unbiased and inference is valid (Laird 1988). The MAR assumption imposes that the probability of missing data on the dependent variable Y is only a function of observed variables. More formally, supposing Y is sometimes missing, MAR requires that Pr(Y missing| Y, X) = Pr(Y missing| X) (Robins and Gill 1997). With longitudinal panel data, this assumption is often less strict since the preceding values of the outcome will predict missing data in the outcome itself (Atkins 2005; Singer and Willet 2003: 158). If the probability of missing values depends upon observed values of either predictors or outcome, maximum likelihood estimation can produce consistent results (Rubin 1976). In our case, parents who have a second child exit the sample, which is in part reflected by their higher fertility expectations in past periods. As they exit, one might remain with a sample that is systematically different over time (i.e., fertility expectations are, on average, lower among the sample remaining). However, the MAR assumption is valid here because the probability of having a second child (and so the probability of exiting from the sample) depends – on average – on the value of fertility expectations (and of their predictors) during the previous year. In fact, the higher the fertility expectations, the more probable a childbirth.6
Because respondents exit our subsample also of their own volition (i.e., not only because of the childbearing event), we test whether the final sample in the last period and the couples exiting because of attrition are different groups compared to the initial sample at time 0. The results of t-tests for mean differences on the controls and the main covariates support the null-hypothesis of no differences among these groups.
The multilevel model also has some potential shortcomings. The most important is that we cannot easily solve potential endogeneity as it is a random effect model. Since we are considering a simultaneous change in internal time-varying predictors (domain satisfaction) and outcome (fertility expectations), we cannot infer that our estimates represent causal effects.
To test gender differences statistically, men and women are compared directly by modelling their relationship in a pooled model (i.e., men and women are in the same sample), while we include a gender dummy interaction with the domains of satisfaction. Level 1 of the model is now specified as follows:
Yij = (Eq.2) + womeni *(satisfactionijti), (3)
where womeni is the gender dummy variable, which takes the value 0 in the case of a
man and 1 in case of a woman, and where satisfactionijti is the satisfaction variable
measured in each time period (i.e., at the birth year, the first year, the second year and the third year after the birth).
Interactions have been tested with the Chow test. The Chow test assesses whether, after pooling two groups (here men and women), the coefficients estimated over one group (e.g., women) are equal to the coefficients estimated over the other (e.g., men). In this case, we suppose that the effect of each satisfaction domain over fertility expectations varies between genders. Because the models are piecewise, gender differences have been tested for each year estimate (e.g., satisfaction with the partner at the birth year).
Because men and women are linked by a couple relationship, we further develop the model by including Level 3 for the couple-specific random effects, which takes into account the differences between couples.7 By nesting individuals into couples, the γ
coefficients at Level 2 are outcomes to be predicted, and they are parameterized as γnik=
αni0 + δnik, where αni0 is the intercept and δnik i is the random slope of the couple.
Therefore, the equation for the Level 3 model is:
Yijk = Xijkβ + π0ik pregijk+ π1ik birthijk+ π2ik firstijk+ π3ik secondijk + π4ik thirdijk
+ womeni *(satisfactionijkti) + Zijktiλ+ εijk. (4)
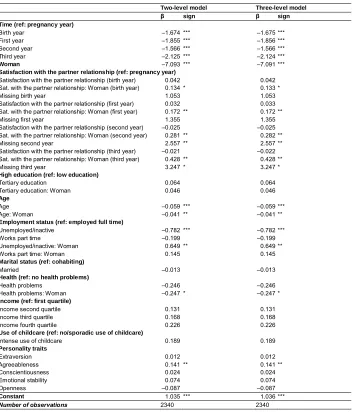
The couple random effect allows us to consider all those couple’s characteristics that are not measured by the covariates (e.g., cooperative practices in the couple, convergence towards partner’s preferences, bargaining power, etc.). However, by adding Level 3, the estimated coefficients and their significance remain similar to that estimated in Level 2, with some slight changes in the random effect parameters. In Table A-4 in the Appendix, we compare the results of the two-level and the three-level models where the main covariate is the satisfaction with the partner relationship. The fact that the estimates remain similar suggests that the individual’s and partner’s covariates included in the two-level model are sufficient to encompass the relevant couple’s characteristics that might determine the within and between variation in
individual’s fertility intentions. Because the addition of Level 3 does not improve the model fit much, we focus on the Level 2 results in the results section.
6. Results
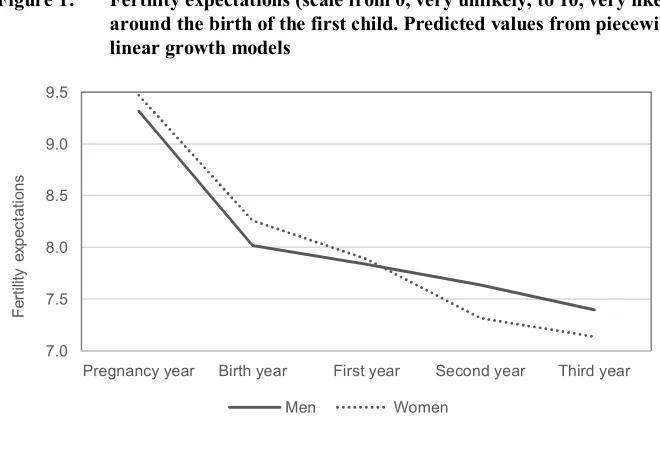
From a simple descriptive point of view, we can look at the shape of fertility expectations (as predicted values from the piecewise linear growth models used) over time, going from the year before birth to three years after. In Figure 1 a monotonic declining trend for both men and women is notable.8 This decrease is especially evident
among women, for whom, at any point in time, the level of fertility expectations is always significantly lower than for the previous year. For men, the decrease is observable in the year of the birth, and then fertility expectation levels are not significantly different from that year.
Figure 1: Fertility expectations (scale from 0, very unlikely, to 10, very likely) around the birth of the first child. Predicted values from piecewise linear growth models
8 Regression coefficients are reported in the Table A-1 in Appendix.
7.0 7.5 8.0 8.5 9.0 9.5
Pregnancy year Birth year First year Second year Third year
F
er
til
ity
ex
pe
ct
at
io
ns
Interestingly, these trends are very similar to those recorded for the level of overall personal life satisfaction of parents after the birth of their first child. Even the gender differences (i.e., the decline for fathers and the sharper and more notable decrease among mothers) is similar to the trend seen for new parents’ fertility expectations (e.g., Twenge, Campbell, and Foster 2003; Lawrence, Nylen, and Cobb 2007; Clark et al. 2008; Myrskylä and Margolis 2014).
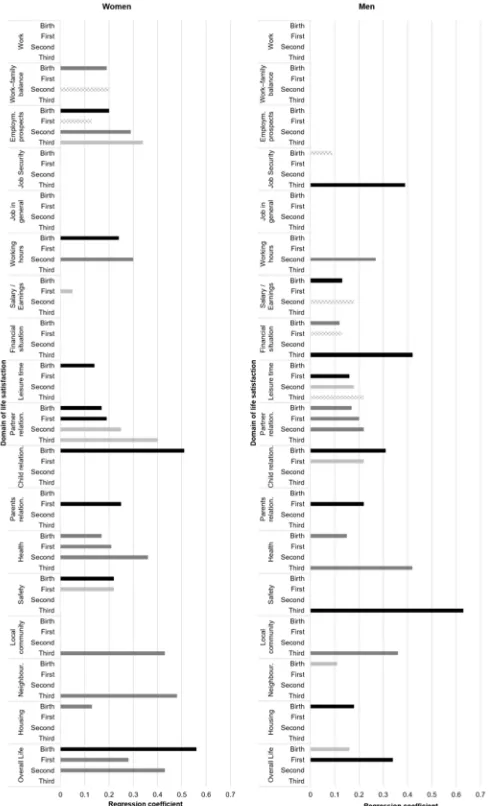
Here we not only consider parents’ overall satisfaction as a possible determinant of fertility expectations, but also – to reflect the complexity of parents’ adjustment to the birth of their first child – we consider several satisfaction domains, all estimated in separate models. Figure 2 shows how life domains are significantly related to the trend of fertility expectations in each of the four years after birth of a first child, for mothers and for fathers.9 Figure 2 also shows the size of the effect of each domain of satisfaction
on fertility expectations over time. The solid bars indicate satisfaction domains that are significant during the time period. The dashed bar, instead, shows overall life satisfaction. Only significant coefficients are reported.
As explained in the methodological section, men and women are compared directly by modelling their relationship in a pooled model, while we include a gender dummy interaction with the domains of satisfaction. All models show significant gender differences in the size of the coefficients.10 The gender differences reflect a
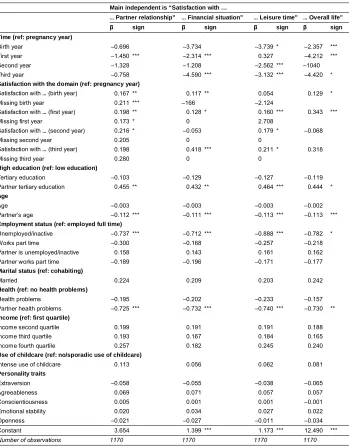
traditional gender role set when a child arrives, but also show how the significance and importance of satisfaction in various domains vary over the first years after the birth of a child. Both work and relationship satisfaction systematically affect fertility expectations, as our hypotheses suggested. In work-related spheres, women’s fertility expectations are more frequently related to the domains that mirror difficulties in juggling work and family roles. In particular, being dissatisfied with employment prospects, the work–family balance, and working hours is significantly associated with a decline in mothers’ fertility expectations. There are also some significant results for fathers, who are more sensitive to economic issues: Being satisfied with their financial situation and pay proves relevant in planning for another child. In addition, leisure time has a significant and enduring relation to fathers’ fertility expectations: The loss of leisure time is one downside for the father-breadwinner who works extra hours for his family’s economic well-being.
9 Regression coefficients are reported in Figure 2 and in Table A-2 and A-3 in the Appendix. In Table A-2 and A-3, complete regression outcomes are reported only for the most relevant domains for men and women. For the remaining domains, results are available, on request, from the authors.
Figure 2: Estimated significant coefficients of the effect of the life satisfaction domains on fertility expectations, by gender and years from the birth of the first child (piecewise-linear-growth models)
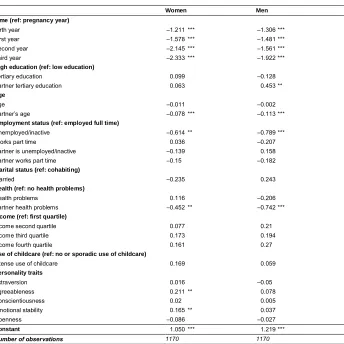
Parents’ sociodemographic characteristics have a quite stable effect on fertility expectations, and the results are consistent with the literature. A woman’s advancing age and any poor health decreases both parents’ fertility expectations. Unemployment for fathers also has a negative effect.
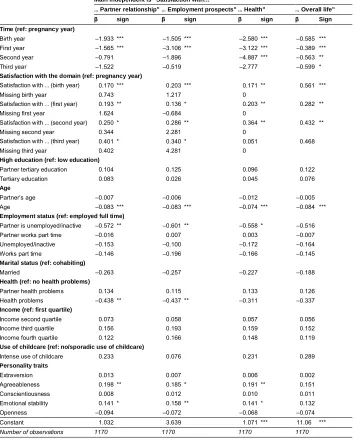
Some of the domains show a significant (though moderate) effect on fertility expectations through all the periods under consideration here. Satisfaction with the partner relationship is fundamental in planning another child, as it is significant for almost every year, both for mothers and for fathers. Similarly, satisfaction with one’s health is necessary for increasing fertility expectations, especially among mothers. For women, satisfaction with employment prospects are, generally, a fixed precondition for increasing fertility expectations. For men, what again matters is satisfaction with their financial situation and satisfaction with leisure time.
Other domains of satisfaction affect fertility expectations only in some particular years. During the early phase of parenthood (i.e., the year of the childbirth) the relationship with the child is the domain most associated with changes in fertility expectations. Fathers’ fertility plans are still affected by their relationship with their first child during the year after birth, perhaps because, during the first year, the mother is often the primary caregiver to her child while, as the child grows, fathers usually become more active as parents, a possible reason being the end of breastfeeding or the return of working mothers to their jobs. For working mothers, satisfaction with working hours appears to be strongly associated with fertility expectations during the year of the birth and the second year of the life of the child. This effect is related, of course, to satisfaction with the work–family balance. In fact, the two domains are significantly related to fertility expectations in the same years.
The relationship with their own parents (i.e., the child’s grandparents) seems to have a quite high predictive power on mothers and fathers’ fertility expectations, in particular when the child is one year old. The relevance of this domain might be explained by the help that grandparents can give in taking care of their grandchild, especially when most working mothers return to their jobs. The availability of grandparents and a good and supportive relationship with them can help parents to manage the challenge of a second child.
7. Conclusion
We have studied the relationship between new parents’ domains of life satisfaction and changes in subsequent fertility expectations. In general, the analysis suggests that a decline in life satisfaction – typical of the period after the birth of a first child – is associated with a significant decline in fertility expectations. We find important gender differences, and the association is stronger for women than for men. Furthermore, the effect goes beyond the first year after the birth of the child: It is also significant during the second and third years (which is the arc of time considered in this study).
The novelty of our analysis is in having considered ratings for 17 satisfaction domains in addition to overall life satisfaction, the changes that occur with the onset of parenthood and the effect of the changes on fertility expectations. Compared to the overall life satisfaction measure, domain-specific satisfaction differs in important ways, and as such, our study gives insight into which domains influence fertility expectations negatively or positively. Moreover, the relative importance of satisfaction domains changes over time, as the child grows older and as parents adapt.
Our study confirms that social relationships and work are two key spheres for the individual’s well-being and that they are particularly relevant for childbearing expectations. The quality of family relationships is perhaps the most important for interpreting changes in parents’ fertility expectations. A good relationship with the first-born is a source of great satisfaction, and our results suggest that it is, indeed, strongly associated with the expectation of having another child (and vice versa). We find a similar pattern with the couple’s relationship, harmony being a precondition for successfully planning for a second child. Finally, the quality of the relationship with a couple’s parents (i.e., the newborn’s grandparents) is crucial in the first period after childbirth. Here grandparental support can make all the difference for working mothers who are re-entering the labour market.
As for the work-related domain, our results follow the contours of traditional gender roles. Mothers’ fertility expectations depend particularly on satisfaction with career prospects, working hours, and the work–family balance. For fathers, instead, providing families with economic stability is of particular relevance for planning for another child, which implies that they perceive themselves as the primary providers of the economic well-being of their families.
References
Aassve, A., Goisis, A., and Sironi, M. (2012). Happiness and childbearing across Europe. Social Indicators Research 108(1): 65–86. doi:10.1007/s11205-011-9866-x.
Aassve, A., Luppi, F., and Mencarini, M. (2018). Unlocking the black box of life satisfaction surrounding childbearing. Milan: Dondena Centre for Research on Social Dynamics and Public Policy, Bocconi University (Dondena Working Paper WP-2018-120).
Aassve, A., Mencarini, L., and Sironi, M. (2015). Institutional change, happiness, and fertility.European Sociological Review 31(6): 749–765.doi:10.1093/esr/jcv073. Argyle, M. and Martin, M. (1991). The psychological causes of happiness. In: Strack,
F.E., Argyle, M.E., and Schwarz, N.E. (eds.). Subjective well-being: An interdisciplinary perspective. Oxford: Pergamon Press: 77–100.
Atkins, D.C. (2005). Using multilevel models to analyze couple and family treatment data: basic and advanced issues. Journal of Family Psychology 19(1): 98–110. doi:10.1037/0893-3200.19.1.98.
Baxter, J. (2013). Employment and the life course: Birth cohort differences of young Australian women. In: Evans, A. and Baxter, J. (eds.). Negotiating the life course: Stability and change in life pathways. Dordrecht: Springer: 99–120. doi:10.1007/978-90-481-8912-0_6.
Baxter, J., Buchler, S., Perales, F., and Western, M. (2015). A life-changing event: First births and men’s and women’s attitudes to mothering and gender divisions of labour.Social Forces 93(3): 989–1014.doi:10.1093/sf/sou103.
Baxter, J., Hewitt, B., and Haynes, M. (2008). Life course transitions and housework: Marriage, parenthood, and time on housework.Journal of Marriage and Family
70(2): 259–272.doi:10.1111/j.1741-3737.2008.00479.x.
Berger, E.M. (2009). Maternal employment and happiness: The effect of non-participation and part-time employment on mothers’ life satisfaction. Berlin: DIW (DIW Discussion Paper 890).
Billari, F.C. (2009). The happiness commonality: Fertility decisions in low-fertility settings. In: UNECE (ed.). Conference proceedings: How generations and gender shape demographic change: Towards policies based on better knowledge. Geneva: UNECE: 7–31.
Billari, F.C. and Kohler, H.P. (2009). Fertility and happiness in the XXI century: Institutions, preferences, and their interactions. Paper presented in the Annual Meeting of the Population Association of America, Detroit, USA, April 30–May 3, 2009.
Billari, F.C., Goisis, A., Liefbroer, A.C., Settersen, R.A., Aasve, A., Hagestad, G., and Spéder, Z. (2011). Social age deadlines for the childbearing of women and men.
Human Reproduction 26(3): 616–622.doi:10.1093/humrep/deq360.
Brennan, D. (2007) Babies, budgets, and birthrates: Work/family policy in Australia 1996–2006. Social Politics: International Studies in Gender, State and Society
14(1): 31–57.doi:10.1093/sp/jxm003.
Campbell, A., Converse, P.E., and Rodgers, W.L. (1976).The quality of American life: Perceptions, evaluations, and satisfactions. New York: Russell Sage.
Clark, A.E. and Oswald, A.J. (2002). A simple statistical method for measuring how life events affect happiness. International Journal of Epidemiology 31(6): 1139– 1144.doi:10.1093/ije/31.6.1139.
Clark, A.E., Diener, E., Georgellis, Y., and Lucas, R.E. (2008). Lags and leads in life satisfaction: A test of the baseline hypothesis. The Economic Journal 118(529): 222–243.doi:10.1111/j.1468-0297.2008.02150.x.
Coenen-Huther, J. (2005). Le souhait d’enfant: Un idéal situé. In: Le Goff, J.M., Sauvain-Dugerdil, C., Rossier, C., and Coenen-Huther, J. (eds). Maternité et parcours de vie. Bern: Peter Lang: 85–136.
Craig, L. and Siminski, P. (2011). If men do more housework, do their wives have more babies? Social Indicators Research 101(2): 255–258. doi:10.1007/s11205-010-9644-1.
Cummins, R.A. (1996). The domains of life satisfaction: An attempt to order chaos.
Social Indicators Research 38(3): 303–328.doi:10.1007/BF00292050.
Dijkstra, P. and Barelds, D.P. (2009). Women’s well-being: The role of individual differences. Scandinavian Journal of Psychology 50(4): 309–315. doi:10.1111/ j.1467-9450.2009.00711.x.
Easterlin, R.A. (2006). Life cycle happiness and its sources: Intersections of psychology, economics, and demography. Journal of Economic Psychology
27(4): 463–482.doi:10.1016/j.joep.2006.05.002.
Erdogan, B., Bauer, T.N., Truxillo, D.M., and Mansfield, L.R. (2012). Whistle while you work: A review of the life satisfaction literature. Journal of Management
38(4): 1038–1083.doi:10.1177/0149206311429379.
Frijters, P., Johnston, D.V., and Shields, M.A. (2011). Life satisfaction dynamics with quarterly life event data. Scandinavian Journal of Economics 113(1): 190–211. doi:10.1111/j.1467-9442.2010.01638.x.
Furnham, A. (1991). Work and leisure satisfaction. In: Strack, F.E., Argyle, M.E., and Schwarz, N.E. (eds.). Subjective well-being: An interdisciplinary perspective. Oxford: Pergamon Press: 235–260.
Gallie, D. and Russel, H. (2008). Work family conflict and working conditions in Western Europe. Social Indicators Research 93(3): 445–467. doi:10.1007/s11 205-008-9435-0.
Gray, E., Evans, A., and Reimondos, A. (2013). Childbearing desires of childless men and women: When are goals adjusted?Advances in Life Course Research18(2): 141–149.doi:10.1016/j.alcr.2012.09.003.
Haddock, S.A., Zimmerman, T.S., Lyness, K.P., and Ziemba, S.J. (2006). Practices of dual earner couples successfully balancing work and family. Journal of Family and Economic Issues 27(2): 207–234.doi:10.1007/s10834-006-9014-y.
Hansen, T. (2012). Parenthood and happiness: A review of folk theories versus empirical evidence. Social Indicators Research 108(1): 29–64.doi:10.1007/s112 05-011-9865-y.
Hayford, S. (2009). The evolution of fertility expectations over the life course.
Demography 46(4): 765–783.doi:10.1353/dem.0.0073.
Iacovou, M. and Tavares, L.P. (2011). Yearning, learning, and conceding: Reasons men and women change their childbearing intentions. Population and Development Review 37(1): 89–123.doi:10.1111/j.1728-4457.2011.00391.x.
Jokela, M., Alvergne, A., Pollet, T.V., and Lummaa, V. (2011). Reproductive behavior and personality traits of the five factor model.European Journal of Personality
25(6): 487–500.doi:10.1002/per.822.
Jokela, M. and Keltikangas-Järvinen, L. (2009). Adolescent leadership and adulthood fertility: Revisiting the ‘central theoretical problem of human sociobiology’.
Journal of Personality 77(1): 213–230.doi:10.1111/j.1467-6494.2008.00543.x. Kan, M.Y. and Gershuny, J. (2009). Calibrating stylised time estimates using UK diary
data. Social Indicators Research 93(1): 239–243. doi:10.1007/s11205-008-93 65-x.
Kline, C.R., Martin, D.P., and Deyo, R.A. (1998). Health consequences of pregnancy and childbirth as perceived by women and clinicians.Obstetrics and Gynecology
92(5): 842–848.
Kohler, H.P. and Mencarini, L. (2016). The parenthood happiness puzzle: An introduction to special issue. European Journal of Population 32(3): 327–338. doi:10.1007/s10680-016-9392-2.
Kohler, H.P., Behrman, J.R., and Skytthe, A. (2005). Partner + children = happiness? The effects of partnerships and fertility on well-being. Population and Development Review 31(3): 407–445.doi:10.1111/j.1728-4457.2005.00078.x. Kohler, H.P., Billari, F.C., and Ortega, J.A. (2002). The emergence of lowest-low
fertility in Europe during the 1990s.Population and Development Review 28(4): 641–680.doi:10.1111/j.1728-4457.2002.00641.x.
Kreyenfeld, M., Andersson, G., and Pailhé, A. (2012). Economic uncertainty and family dynamics in Europe: Introduction. Demographic Research 27(28): 835–852. doi:10.4054/DemRes.2012.27.28.
Laird, N.M. (1988). Missing data in longitudinal studies.Statistics in Medicine 7(1–2): 305–315.doi:10.1002/sim.4780070131.
Lawrence, E., Nylen, K., and Cobb, R.J. (2007). Prenatal expectations and marital satisfaction over the transition to parenthood. Journal of Family Psychology
Le Moglie, M., Mencarini, L., and Rapallini, C. (2015). Is it just a matter of personality? On the role of subjective well-being in childbearing behaviour.
Journal of Economic Behavior and Organization 117: 453–475. doi:10.1016/j. jebo.2015.07.006.
Liefbroer, A.C. (2009). Changes in family size intentions across young adulthood: A life-course perspective. European Journal of Population 25(4): 363–386. doi:10.1007/s10680-008-9173-7.
Loewe, N., Bagherzadeh, M., Araya-Castillo, L., Thieme, C., and Batista-Foguet, J.M. (2014). Life domain satisfactions as predictors of overall life satisfaction among workers: Evidence from Chile. Social Indicators Research 118(1): 71–86. doi:10.1007/s11205-013-0408-6.
Losoncz, I. and Bortolotto, N. (2009). Work–life balance: The experiences of Australian working mothers. Journal of Family Studies 15(2): 122–138. doi:10.5172/jfs.15.2.122.
Luppi, F. (2016). When is the second one coming? The effect of couple’s subjective well-being following the onset of parenthood. European Journal of Population
32(3): 421–444.doi:10.1007/s10680-016-9388-y.
MacDermid, S.M., Huston, T.L., and McHale, S.M. (1990). Changes in marriage associated with the transition to parenthood: Individual differences as a function of sex-role attitudes and changes in the division of household labor. Journal of Marriage and the Family 52(2): 475–486.doi:10.2307/353041.
Margolis, R. and Myrskylä, M. (2011). A global perspective on happiness and fertility.
Population and Development Review 37(1): 29–56. doi:10.1111/j.1728-4457. 2011.00389.x.
Matysiak, A., Mencarini, L., and Vignoli, D. (2016). Work–family conflict moderates the relationship between childbearing and subjective well-being. European Journal of Population 32(3): 355–379.doi:10.1007/s10680-016-9390-4.
McCrae, R.R. (1991). The five-factor model and its assessment in clinical settings.
Journal of Personality Assessment 57(3): 399–414. doi:10.1207/s15327752 jpa5703_2.
McCrae, R.R. and Costa, P.T. (1991). The NEO personality inventory: Using the five
McDonald, P. (2001). Family support policy in Australia: The need for a paradigm shift.People and Place 9(2): 14–20.
Meijer, A.M. and Van den Wittenboer, G.L. (2007). Contribution of infants’ sleep and crying to marital relationship of first-time parent couples in the 1st year after
childbirth.Journal of Family Psychology 21(1): 49–57.doi:10.1037/0893-3200. 21.1.49.
Mencarini, L. and Sironi, M. (2010). Happiness, housework and gender inequality in Europe.European Sociological Review 28(2): 203–219.doi:10.1093/esr/jcq059. Mencarini, L., Vignoli, D., and Gottard, A. (2015). Fertility intentions and outcomes.
Implementing the theory of planned behavior with graphical models. Advances in Life Course Research 23: 14–28.doi:10.1016/j.alcr.2014.12.004.
Miller, W. (2011). Differences between fertility desires and intentions: Implications for theory, research and policy. Vienna Yearbook of Population Research 9: 75–89. doi:10.1553/populationyearbook2011s75.
Miller, W., Severy, L., and Pasta, D.J. (2004). A framework for modelling fertility motivation in couples.Population Studies 58(2): 193–205.doi:10.1080/0032472 042000213712.
Miller, W.B. and Pasta, D.J. (1995). Behavioral intentions: Which ones predict fertility behavior in married couples?Journal of Applied Social Psychology 25(6): 530– 555.doi:10.1111/j.1559-1816.1995.tb01766.x.
Miller, W.B. (1992). Personality traits and developmental experiences as antecedents of childbearing motivation.Demography 29(2): 265–285.doi:10.2307/2061731. Miller, W.B., Pasta, D.J., MacMurray, J., Chiu, C., Wu, S., and Comings, D.E. (1999).
Genetic influences on childbearing motivation: A theoretical framework and some empirical evidence. In: Severy, L.J. and Miller, W. (eds.). Advances in population: Psychosocial perspectives. London: Jessica Kingsley: 53–102. Miller, W.B., Pasta, D.J., MacMurray, J., Muhleman, D., and Comings, D.E. (2000).
Genetic influences on childbearing motivation: Further testing a theoretical framework. In: Lee Rodgers, J., Rowe, D.C., and Miller, W.B. (eds.).Genetic influences on human fertility and sexuality. New York: Springer: 35–66. doi:10.1007/978-1-4615-4467-8_4.
Mitchell, D. and Gray, E. (2007). Declining fertility: Intentions, attitudes and aspirations.Journal of Sociology 43(1): 23–44.doi:10.1177/1440783307073933. Myrskylä, M. and Margolis, R. (2014). Happiness: Before and after the kids.
Demography 51(5): 1843–1866.doi:10.1007/s13524-014-0321-x.
Newman, L. (2008). How parenthood experiences influence desire for more children in Australia: A qualitative study. Journal of Population Research 25(1): 1–27. doi:10.1007/BF03031938.
Nomaguchi, K.M. and Milkie, M.A. (2003). Costs and rewards of children: The effects of becoming a parent on adults’ lives. Journal of Marriage and Family 65(2): 356–374.doi:10.1111/j.1741-3737.2003.00356.x.
Parr, N. (2010). Satisfaction with life as an antecedent of fertility: Partner + happiness = children? Demographic Research 22(21): 635–662. doi:10.4054/DemRes.2010. 22.21.
Perelli-Harris, B. (2006). The influence of informal work and subjective well-being on childbearing in post-Soviet Russia.Population and Development Review 32(4): 729–753.doi:10.1111/j.1728-4457.2006.00148.x.
Philipov, D., Spéder, Z., and Billari, F.C. (2006). Soon, later, or ever? The impact of anomie and social capital on fertility intentions in Bulgaria (2002) and Hungary (2001).Population Studies 60(3): 289–308.doi:10.1080/00324720600896080. Pollmann-Schult, M. (2014). Parenthood and life satisfaction: Why don’t children make
people happy?Journal of Marriage and the Family 76(2): 319–336.doi:10.111 1/jomf.12095.
Qu, L., Weston, R., and Kilmartin, C. (2000). Children? No children? Effects of changing personal relationships on decisions about having children. Family Matters 57: 14–19.
Rabe-Hesketh, S. and Skrondal, A. (2008).Multilevel and longitudinal modeling using Stata. College Station: STATA Press.
Robins, J.M. and Gill, R.D. (1997) Non-response models for the analysis of non
-monotone ignorable missing data. Statistics in Medicine 16(1): 39–56. doi:10.1002/(SICI)1097-0258(19970115)16:1<39::AID-SIM535>3.0.CO;2-D. Rode, J., Rehg, M., Near, J., and Underhill, J. (2007). The effect of work/family conflict
Rogers, S.J. (1996). Mothers’ work hours and marital quality: Variations by family structure and family size.Journal of Marriage and the Family 58(3): 606–617. doi:10.2307/353721.
Rubin, D.B. (1976). Inference and missing data.Biometrika 63(3): 581–592.doi:10.109 3/biomet/63.3.581.
Saris, W.E. and Ferligoj, A. (1995). Life-satisfaction and domain-satisfaction in 10 European countries: Correlation at the individual level. In: Saris, W.E. (ed.). A comparative study of satisfaction with life in Europe. Budapest: Eötvös University Press: 275–279.
Singer, J. and Willett, J. (2003):Applied longitudinal data analysis: Modelling change and event occurrence. Oxford: Oxford University Press.doi:10.1093/acprof:oso/ 9780195152968.001.0001.
Stanca, L. (2012). Suffer the little children: Measuring the effects of parenthood on well-being worldwide. Journal of Economic Behavior and Organization 81(3): 742–750.doi:10.1016/j.jebo.2010.12.019.
Toulemon, L. and Testa, M.R. (2005). Fertility intentions and actual fertility: A complex relationship.Population and Societies 415: 1–4.
Tov, W. (2018). Well-being concepts and components. In: Diener, E., Oishi, S., and Tay, L. (eds.).Handbook of well-being. Salt Lake City: DEF: 30–44.
Twenge, J.M., Campbell, W.K., and Foster, C.A. (2003). Parenthood and marital satisfaction: A meta-analytic review. Journal of Marriage and Family 65(3): 574–583.doi:10.1111/j.1741-3737.2003.00574.x.
Veenhoven, R. (1996). Developments in satisfaction-research. Social Indicators Research 37(1): 1–46.doi:10.1007/BF00300268.
Veenhoven, R., Ehrhardt, J., Ho, M.S.D., and de Vries, A. (1993). Happiness in nations: Subjective appreciation of life in 56 nations 1946–1992. Rotterdam: Erasmus University Rotterdam.
Warshaw, P.R. and Davis, D.F. (1985). Disentangling behavioral intention and behavioral expectation. Journal of Experimental Social Psychology 21(3): 213– 228.doi:10.1016/0022-1031(85)90017-4.
Appendix
Table A-1: Estimated coefficients for fertility expectations with piecewise linear growth models
Women Men
Time (ref: pregnancy year)
Birth year –1.211 *** –1.306 ***
First year –1.578 *** –1.481 ***
Second year –2.145 *** –1.561 ***
Third year –2.333 *** –1.922 ***
High education (ref: low education)
Tertiary education 0.099 –0.128
Partner tertiary education 0.063 0.453 **
Age
Age –0.011 –0.002
Partner’s age –0.078 *** –0.113 ***
Employment status (ref: employed full time)
Unemployed/inactive –0.614 ** –0.789 ***
Works part time 0.036 –0.207
Partner is unemployed/inactive –0.139 0.158
Partner works part time –0.15 –0.182
Marital status (ref: cohabiting)
Married –0.235 0.243
Health (ref: no health problems)
Health problems 0.116 –0.206
Partner health problems –0.452 ** –0.742 ***
Income (ref: first quartile)
Income second quartile 0.077 0.21
Income third quartile 0.173 0.194
Income fourth quartile 0.161 0.27
Use of childcare (ref: no or sporadic use of childcare)
Intense use of childcare 0.169 0.059
Personality traits
Extraversion 0.016 –0.05
Agreeableness 0.211 ** 0.078
Conscientiousness 0.02 0.005
Emotional stability 0.165 ** 0.037
Openness –0.086 –0.027
Constant 1.050 *** 1.219 ***
Table A-2: Estimated coefficients for fertility expectations with piecewise linear growth models, for women, with main covariates
Main independent is “Satisfaction with…
… Partner relationship”… Employment prospects”… Health” … Overall life”
β sign β sign β sign β Sign
Time (ref: pregnancy year)
Birth year –1.933 *** –1.505 *** –2.580 *** –0.585 ***
First year –1.565 *** –3.106 *** –3.122 *** –0.389 ***
Second year –0.791 –1.896 –4.887 *** –0.563 **
Third year –1.522 –0.519 –2.777 –0.599 *
Satisfaction with the domain (ref: pregnancy year)
Satisfaction with… (birth year) 0.170 *** 0.203 *** 0.171 ** 0.561 ***
Missing birth year 0.743 1.217 0
Satisfaction with… (first year) 0.193 ** 0.136 * 0.203 ** 0.282 **
Missing first year 1.624 –0.684 0
Satisfaction with… (second year) 0.250 * 0.286 ** 0.364 ** 0.432 **
Missing second year 0.344 2.281 0
Satisfaction with… (third year) 0.401 * 0.340 * 0.051 0.468
Missing third year 0.402 4.281 0
High education (ref: low education)
Partner tertiary education 0.104 0.125 0.096 0.122
Tertiary education 0.083 0.026 0.045 0.076
Age
Partner’s age –0.007 –0.006 –0.012 –0.005
Age –0.083 *** –0.083 *** –0.074 *** –0.084 ***
Employment status (ref: employed full time)
Partner is unemployed/inactive –0.572 ** –0.601 ** –0.558 * –0.516
Partner works part time –0.016 0.007 0.003 –0.007
Unemployed/inactive –0.153 –0.100 –0.172 –0.164
Works part time –0.146 –0.196 –0.166 –0.145
Marital status (ref: cohabiting)
Married –0.263 –0.257 –0.227 –0.188
Health (ref: no health problems)
Partner health problems 0.134 0.115 0.133 0.126
Health problems –0.438 ** –0.437 ** –0.311 –0.337
Income (ref: first quartile)
Income second quartile 0.073 0.058 0.057 0.056
Income third quartile 0.156 0.193 0.159 0.152
Income fourth quartile 0.122 0.166 0.148 0.119
Use of childcare (ref: no/sporadic use of childcare)
Intense use of childcare 0.233 0.076 0.231 0.289
Personality traits
Extraversion 0.013 0.007 0.006 0.002
Agreeableness 0.198 ** 0.185 * 0.191 ** 0.151
Conscientiousness 0.008 0.012 0.010 0.011
Emotional stability 0.141 * 0.158 ** 0.141 * 0.132
Openness –0.094 –0.072 –0.068 –0.074
Constant 1.032 3.639 1.071 *** 11.06 ***
Table A-3: Estimated coefficients for fertility expectations with piecewise linear growth models, for men, with main covariates
Main independent is “Satisfaction with …
… Partner relationship” … Financial situation” … Leisure time” … Overall life”
β sign β sign β sign β sign
Time (ref: pregnancy year)
Birth year –0.696 –3.734 –3.739 * –2.357 ***
First year –1.450 *** –2.314 *** 0.327 –4.212 ***
Second year –1.328 –1.208 –2.562 *** –1040
Third year –0.758 –4.590 *** –3.132 *** –4.420 *
Satisfaction with the domain (ref: pregnancy year)
Satisfaction with… (birth year) 0.167 ** 0.117 ** 0.054 0.129 *
Missing birth year 0.211 *** –166 –2.124
Satisfaction with… (first year) 0.198 ** 0.128 * 0.160 *** 0.343 ***
Missing first year 0.173 * 0 2.708
Satisfaction with… (second year) 0.216 * –0.053 0.179 * –0.068
Missing second year 0.205 0 0
Satisfaction with… (third year) 0.198 0.418 *** 0.211 * 0.318
Missing third year 0.280 0 0
High education (ref: low education)
Tertiary education –0.103 –0.129 –0.127 –0.119
Partner tertiary education 0.455 ** 0.432 ** 0.464 *** 0.444 *
Age
Age –0.003 –0.003 –0.003 –0.002
Partner’s age –0.112 *** –0.111 *** –0.113 *** –0.113 ***
Employment status (ref: employed full time)
Unemployed/inactive –0.737 *** –0.712 *** –0.888 *** –0.782 *
Works part time –0.300 –0.168 –0.257 –0.218
Partner is unemployed/inactive 0.158 0.143 0.161 0.162
Partner works part time –0.189 –0.196 –0.171 –0.177
Marital status (ref: cohabiting)
Married 0.224 0.209 0.203 0.242
Health (ref: no health problems)
Health problems –0.195 –0.202 –0.233 –0.157
Partner health problems –0.725 *** –0.732 *** –0.740 *** –0.730 **
Income (ref: first quartile)
Income second quartile 0.199 0.191 0.191 0.188
Income third quartile 0.193 0.167 0.184 0.165
Income fourth quartile 0.257 0.182 0.245 0.240
Use of childcare (ref: no/sporadic use of childcare)
Intense use of childcare 0.113 0.056 0.062 0.081
Personality traits
Extraversion –0.058 –0.055 –0.038 –0.065
Agreeableness 0.069 0.071 0.057 0.057
Conscientiousness 0.005 0.001 0.001 –0.001
Emotional stability 0.020 0.034 0.027 0.022
Openness –0.021 –0.027 –0.011 –0.034
Constant 3.654 1.399 *** 1.173 *** 12.490 ***
Table A-4: Comparison between the two-level (individual) and the three-level (couple) piecewise growth models for fertility expectations,
considering the satisfaction with the partner relationship as the main covariant, in the pooled sample of women and men
Two-level model Three-level model
β sign β sign
Time (ref: pregnancy year)
Birth year –1.674 *** –1.675 ***
First year –1.855 *** –1.856 ***
Second year –1.566 *** –1.566 ***
Third year –2.125 *** –2.124 ***
Woman –7.093 *** –7.091 ***
Satisfaction with the partner relationship (ref: pregnancy year)
Satisfaction with the partner relationship (birth year) 0.042 0.042 Sat. with the partner relationship: Woman (birth year) 0.134 * 0.133 *
Missing birth year 1.053 1.053
Satisfaction with the partner relationship (first year) 0.032 0.033 Sat. with the partner relationship: Woman (first year) 0.172 ** 0.172 **
Missing first year 1.355 1.355
Satisfaction with the partner relationship (second year) –0.025 –0.025 Sat. with the partner relationship: Woman (second year) 0.281 ** 0.282 **
Missing second year 2.557 ** 2.557 **
Satisfaction with the partner relationship (third year) –0.021 –0.022 Sat. with the partner relationship: Woman (third year) 0.428 ** 0.428 **
Missing third year 3.247 * 3.247 *
High education (ref: low education)
Tertiary education 0.064 0.064
Tertiary education: Woman 0.046 0.046
Age
Age –0.059 *** –0.059 ***
Age: Woman –0.041 ** –0.041 **
Employment status (ref: employed full time)
Unemployed/inactive –0.782 *** –0.782 ***
Works part time –0.199 –0.199
Unemployed/inactive: Woman 0.649 ** 0.649 **
Works part time: Woman 0.145 0.145
Marital status (ref: cohabiting)
Married –0.013 –0.013
Health (ref: no health problems)
Health problems –0.246 –0.246
Health problems: Woman –0.247 * –0.247 *
Income (ref: first quartile)
Income second quartile 0.131 0.131
Income third quartile 0.168 0.168
Income fourth quartile 0.226 0.226
Use of childcare (ref: no/sporadic use of childcare)
Intense use of childcare 0.189 0.189
Personality traits
Extraversion 0.012 0.012
Agreeableness 0.141 ** 0.141 **
Conscientiousness 0.024 0.024
Emotional stability 0.074 0.074
Openness –0.087 –0.087
Constant 1.035 *** 1.036 ***