38
The Experimental Study of Effective Parameters on
Mean Drop Size in a Mixer-Settler
M. Zaheri1, H. Aboalghasemi1∗, M. Ghannadi Maragheh2, P. Zaheri1, A. Ahmadi1 1- School of Chemical Engineering, University of Tehran, Tehran, Iran.
2- Nuclear Fuel Cycle Research School, Nuclear Science and Technology Research Institute, Tehran, Iran.
Abstract
In this investigation, in order to study the effect of hydrodynamic parameters such as impeller speed and hold-up, two series of experiments have been performed with a single stage horizontal mixer-settler equipped with 2 four-blade impellers. In the first series, 15 experiments were carried out with toluene/water system and in the second series, 60 experiments were carried out with toluene/acetone/water system. Results show that in both systems, when the hold-up is constant, the mean drop size decreases with increasing impeller speed and when the impeller speed is constant, the mean drop size increases with increasing hold-up, however, these manners for any system are different quantitatively. It shows that with the addition of solute (acetone) concentration in the system, the mean drop size decreases. The experimental results were compared with the Desnoyer and Quadros models, of which the Quadros model has a little deviation from Desnoyer model.
Keywords: Mean Drop Size, Hold-Up, Solute, Mixer-Settler, Impeller Speed
∗ Corresponding author: [email protected] 1- Introduction
Many industrial processes (solvent extraction, emulsification, polymerisation in emulsion) involve liquid–liquid dispersions in stirred vessels (mixers) and the knowledge of the resulting drop size distribution characteristics, or more exactly the evolution of this distribution with changes of external mechanical energy input, temperature or composition is of major importance. In solvent extraction processes for instance, the interfacial area of dispersion controls the mass transfer rate and is a key parameter for the design and scaling-up of gravity settlers
that ensure the ultimate liquid phases separation. A large amount of work can be found in the literature concerning the prediction of drop size distributions in turbulent liquid–liquid dispersions in stirred vessels. The sizes of the drops depend on several factors such as impeller geometry, impeller speed, impeller location in the tank, feed phase ratio, and the physical properties of the description of the effect of all these factors on the drop sizes is required [1]. Among all the mean diameters, the Sauter mean diameter, D32, is the most important
Iranian Journal of Chemical Engineering, Vol.8, No. 1 39 area per unit volume, a, which determines
the transfer rates of energy, mass and /or chemical reaction in dispersions. The relationship between the Sauter mean diameter, D32, and the interfacial area per
unit volume, is as follows:
32 6 D
a= φ
(1)
Where, φ is the volume fraction of a dispersed phase (hold-up).
The Sauter mean diameter, D32, is by
definition the ratio of the third to the second moment of the probability density function [3]:
max
min
max
min
d 3
d
32 d 2
d
d p(d) d D
d p(d) d
∂ =
∂
∫
∫
(2)or for any size distribution of discrete entities,
k 3
i i i 1
32 k 2
i i i 1
n d D
n d
=
= =
∑
∑
(3)Investigations were carried out for examination of the effect of parameters on the mean drop size in with and without solute. Some investigators studied the influence of the impeller speed and the dispersed phase hold-up fraction on the mean drop size for different systems (Chatzi et al. [4]; Skelland et al. [5]; Zerfa and Brooks [2]; Kumar et al. [6]; Boye et al. [7]; Ruiz et al. [8]; Ban et al. [9]; Desnoyer et al. [10]; Riberio et al. [11])
2- Correlation for mean drop size
In order to accurately describe the phenomena occurring in an agitated liquid-liquid dispersion, appropriate models and correlations must be developed. A number of relationships have been proposed to describe the effects of column geometry, agitation condition, and physical properties of the liquid-liquid system on the drop size. Zhou and Kresta summarized the correlations proposed by many investigators.
It should be noted that most authors agree on the effect of Weber number on drop size, while the observed hold-up effects of the dispersed phase on the drop size are different, depending on the authors. This fact suggests that the drop coalescence behavior depends on the liquid-liquid systems investigated, and the physicochemical properties of liquid-liquid systems play an important role in controlling the drop size. Some investigators focused their attention on the effect of interfacial tension and the direction of mass transfer on drop size. However, there have been few studies concerning the inherent physiochemical properties of solutes to influence the drop coalescence and breakage. Ban et al. succeed in quantitative prediction of the drop coalescence behavior in the toluene/acetone/water system from the viewpoint of mass transfer [9].
According to the Kolmogoroff theory of isotropic turbulence, drop size depends on We-0.6, that is, N-1.2.
0.6 32
D
(We) D
−
∝ with We=ρcN D2 3
σ (4)
Where D is the impeller diameter, σ and ρc
40 Iranian Journal of Chemical Engineering, Vol. 8, No. 1 density respectively [2].
The most frequently reported correlation is of the form:
0.6 32
D
C f ( )(We)
D φ
− ′
= (5)
Here, C is constant.
The objective of this work is the study of the effect of hold-up and impeller speed on the mean drop size in with and without solute (acetone).
3- Apparatus description
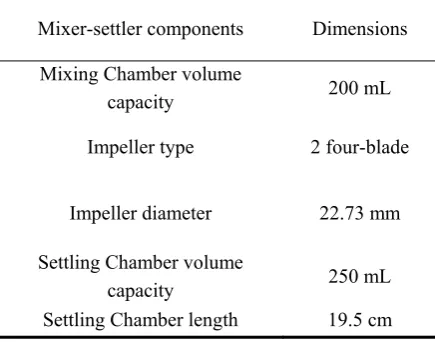
The mixer-settler used in this work is single stage horizontal and contains 2 four-blade impellers. Impeller speed was controlled digitally and the flow rates of pumps were variable. The mixer-settler was made of glass and the flows were co-current. Fig. 1 shows a schematic diagram of the experimental set up. The mixer-settler geometry is tabulated in Table 1.
Table 1. The geometrical characteristics of the
mixer-settler used
Mixer-settler components Dimensions
Mixing Chamber volume
capacity 200 mL
Impeller type 2 four-blade
Impeller diameter 22.73 mm
Settling Chamber volume
capacity 250 mL
Settling Chamber length 19.5 cm
Figure 1. Schematic diagram of the experimental
apparatus
4- Chemical systems used and experi-mental works
The plant was operated with and without solute. Acetone was chosen as the solute, water as a continuous phase and toluene as the dispersed phase. The physical properties of the liquid systems used are given in Table 2. Before the experiments, toluene and water were saturated. After the column was filled with the aqueous phase, the organic phase was dispersed in the aqueous phase. After agitation to attain steady state, drop size and hold-up were measured. In the experiments with solute, the acetone concentrations were 2, 3, 4, and 6wt% in the organic phase and the direction of mass transfer was from the dispersed to the continuous phase. A video technique has been used in order to measure the drop size in the mixer-settler with the help of a digital camera (8 M.P, DSC-F828). The AutoCAD software was used for the measurement of drop sizes and calculation of Sauter mean diameter.
Generally, for the study of effect of hold-up and impeller speed on mean drop size, the experiments were performed at 600, 650, 700, 750 and 800rpm and at hold-up fractions 0.27, 0.30 and 0.32, and for the
Iranian Journal of Chemical Engineering, Vol.8, No. 1 41 study of the effect of impeller location the
experiments were performed at 750, 800 and 850rpm and at hold-up 0.30.
Table 2. Physical properties of liquid systems
Liquid Density
(kg/m3)
Viscosity (mPa.s)
Purity (%)
Water 996 0.96 >99
Toluene 870 0.57 >99
Acetone 790 0.3 >99
5- Experimental results without solute
5.1- The effects of the impeller speed on mean drop size
Fig. 2 and 3 show the influence of the agitation intensity on the drop size for different dispersed phase hold-ups. The plots clearly show that an increase of the impeller speed leads to finer sized drops. Thus, agitation power increases the drop breakage frequency.
D32 va N
0.4 0.5 0.6 0.7 0.8 0.9 1 1.1 1.2 1.3 1.4
550 600 650 700 750 800 850
N (rpm)
D
32(
m
m
)
Φ=0.3253
Φ=0.3030
Φ=0.2738
Figure 2.The effects of impeller speed on D32 in three
hold-ups
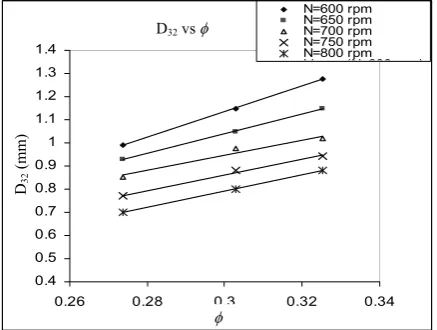
5.2- The effects of the hold-up on mean drop size
Fig. 4 shows the influence of the dispersed phase hold-up fraction on drop size. The plots clearly show that higher hold-ups lead to larger drops. Since the dispersed phase
hold-up measure the volume fraction of the dispersed phase in the total dispersion volume, so the higher in this fraction lead to higher collision frequency between drops. This increased collision frequency promotes drop coalescence and, thus, increases drop sizes.
ln(D32) vs ln(N)
6 6.2 6.4 6.6 6.8 7 7.2 7.4
6.35 6.41 6.47 6.53 6.59 6.65 6.71
ln(N in rpm)
ln
(D32
in
μ
m)
Φ=0.3253
Φ=0.3030
Φ=0.2738
Figure 3. Logarithmic variation of D32 with impeller
speed in three hold-ups
D32 vs Φ
0.4 0.5 0.6 0.7 0.8 0.9 1 1.1 1.2 1.3 1.4
0.26 0.28 0.3 0.32 0.34
Φ D32
(mm)
N=600 rpm N=650 rpm N=700 rpm N=750 rpm N=800 rpm Li (N 600 )
Figure 4. Variation of D32 with hold-up in five
impeller speeds
6- Experimental results with solute
6.1- The effects of solute (acetone) concent-ration on mean drop sizes
The resulting interfacial tension versus the acetone concentration curve is presented in φ
φ φ
D32
(mm)
N (rpm)
D32
(mm)
D32 vs φ
φ
In (N in rpm)
φ φ φ
In (D32) vs in (N)
In
(D
32
in
μ
42 Iranian Journal of Chemical Engineering, Vol. 8, No. 1 Fig. 5. Interfacial tension between water and
toluene decreases with increasing of acetone concentration. The effect of acetone concentration on drop size is shown in Figs. 6, 7 and 8. The experiments were carried out in three hold-ups and five impeller speeds. As shown, when acetone concentration increases, interfacial tension between toluene and water decreases, therefore mean drop size reduces. water/toluene/aceton 0 5 10 15 20 25 30 35 40
0 2.5 5 7.5 10 12.5 15 17.5 20
Acetone wt% In te rf ac ia l te ns io n
Figure 5. Interfacial tension between water and
toluene versus acetone concentration
Φ=0.3253 0.45 0.55 0.65 0.75 0.85 0.95 1.05 1.15 1.25 1.35
0 1 2 3 4 5 6 7
Concentration of aceton (wt%)
D 32( m m ) N=600 rpm N=650 rpm N=700 rpm N=750 rpm N=800 rpm
Figure 6. The effects of acetone concentration on D32
at φ= 0.3253
Φ=0.3030 0.45 0.55 0.65 0.75 0.85 0.95 1.05 1.15 1.25 1.35
0 1 2 3 4 5 6 7
Concentration of acetone(wt%)
D3 2 (m m ) N=600 rpm N=650 rpm N=700 rpm N=750 rpm N=800 rpm
Figure 7. The effects of acetone concentration on D32
at φ= 0.3030
Φ=0.2738 0.45 0.55 0.65 0.75 0.85 0.95 1.05 1.15 1.25 1.35
0 1 2 3 4 5 6 7
Concentration of acetone(wt%)
D32 (m m ) N=600 rpm N=650 rpm N=700 rpm N=750 rpm N=800 rpm
Figure 8. The effects of acetone concentration on D32
at φ= 0.2738
6.2- The effects of impeller speed on mean drop size
Fig. 9 shows the influence of the agitation intensity on the drop size for three different dispersed phase hold-ups. The results indicate that when D32 is plotted versus the
impeller speed for each acetone concentration (2, 3, 4 and 6 wt.%), the curves present the same trend. Therefore, the figures are plotted at 6 wt % of the acetone concentration. The plot clearly shows that increasing the impeller speed leads to finer drop size. Thus, agitation power increases drop breakage frequency. In comparison with the condition of without acetone, the slope of the linear relation between Ln(N) and Ln(D32) decreases and it reduces by
increasing the acetone concentration.
Ln(D32) vs Ln(N)
6 6.2 6.4 6.6 6.8
6.35 6.41 6.47 6.53 6.59 6.65 6.71
Ln(N in rpm)
Ln (D 32 i n μ m) Ф=0.3253 Ф=0.3030 Ф=0.2738
Figure 9. Logarithmic variation of D32 with impeller
speed in the presence of 6wt% acetone
D32
(mm)
φ = 0.2738
Concentration of acetone (wt%)
D32
(mm)
φ = 0.3253
Concentration of acetone (wt%)
D32
(
mm
)
φ = 0.3030
Concentration of acetone (wt%)
Interfacial tension Water/toluene/acetion Acetone (wt%) φ φ φ
Lin(D32) vs Ln (N)
Ln (N in rpm)
Iranian Journal of Chemical Engineering, Vol.8, No. 1 43
6.3- The effects of hold-up on mean drop size
Fig. 10 shows the influence of hold-up fraction on drop size in different impeller speeds. The results indicate that when D32 is
plotted versus the hold-up for each acetone concentration (2, 3, 4 and 6 wt.%), the curves present the same trend. Therefore, the figures are plotted at 6 wt % of the acetone concentration. The plots clearly show that higher hold-ups lead to larger drops. Also, in comparison with the condition of without acetone, the effect of hold-up on drop size decreases and by increasing the acetone concentration, this reduction increases.
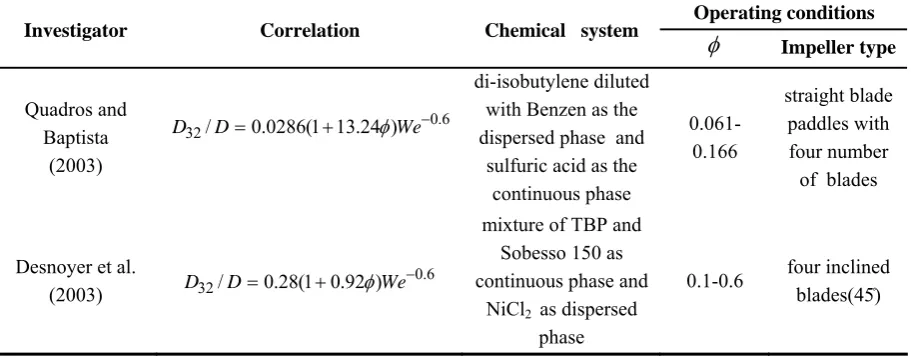
The experimental results were compared with Desnoyer and Quadros models that are tabulated in Table 3. For the experiments with solute, there were no models or experimental data for comparison. Absolute average relative deviation was calculated by:
i i
32 32
N exp mod el
32 i 1
exp
D D
( ) ( )
1 D D
%AARD 100
D
N ( )
D
=
−
=
∑
× (6)D32 vs Φ
0.4 0.45 0.5 0.55 0.6 0.65 0.7 0.75 0.8
0.26 0.28 0.3 0.32 0.34
Φ
D32
(mm)
N=600 N=650 N=700 N=750 N=800
Figure 10. The effects of hold-up on D32 in
the presence of 6wt% acetone
Table 4 shows the results of the comparison. As shown, the Desnoyer model has a good agreement with the experimental data. Generally operating conditions, the physical properties of system and apparatus geometry play an important role in controlling the drop sizes.
Table 3. Drop size correlations for liquid-liquid dispersion in stirred vessels
Operating conditions
Investigator Correlation Chemical system φ
Impeller type
Quadros and Baptista
(2003)
6 . 0 32/D=0.0286(1+13.24 )We−
D φ
di-isobutylene diluted with Benzen as the dispersed phase and
sulfuric acid as the continuous phase
0.061-0.166
straight blade paddles with four number of blades
Desnoyer et al. (2003)
6 . 0 32/D=0.28(1+0.92 )We−
D φ
mixture of TBP and Sobesso 150 as continuous phase and
NiCl2 as dispersed
phase
0.1-0.6 four inclined blades(45۫)
D32
(mm)
D32 vs φ
44 Iranian Journal of Chemical Engineering, Vol. 8, No. 1
Table 4. The results of the comparison of experimental data with the Quadros and Desnoyer models
System Quadros model Desnoyer model
%AARD
Toluene /water 65 12.34
Toluene /acetone(2 wt%)/water 62.55 8.14
Toluene /acetone(3 wt%)/water 61.81 7.56
Toluene /acetone(4 wt%)/water 60.39 5.17
Toluene /acetone(6 wt%)/water 55.47 11.91
7- Conclusions
After testing, observation and study, we can conclude that:
• Interfacial tension between water and toluene decreases when the acetone concentration increases and as a result, D32 decreases. By increasing 6wt% of
acetone, D32 decreases over 51%.
• By increasing the impeller speed in constant hold-up, D32 decreases in with
and without acetone. Also, the slope of the linear relation between Ln(N) and Ln(D32)
for different phase hold-ups has a range between -1.22 and -1.3 in without acetone condition and a range between -0.98 and -1.21 in the presence of acetone. This slope increases by increasing hold-up and decreases by increasing acetone concentration.
• According to the Kolmogoroff theory of isotropic turbulence, the drop size depends on We-0.6 that is N-1.2. It is shown
for the water/toluene system and for water/acetone/toluene with a lower concentration of acetone, that this dependence agrees with classical theory.
• By increasing hold-up, D32 increases and
these variations are linear in with and
without acetone conditions approximately. Also, the slope of variation of D32 versus
hold-up, decreases by increasing acetone concentration.
• The experimental results in with and without acetone conditions were compared with Quadros and Baptista and Desnoyer models, which have a slight deviation from the Desnoyer model.
8- Nomenclature
a The interfacial area per unit volume
C′ Constants
d Drop diameter
32
D Sauter mean diameter, L
D Impeller diameter, L
N Impeller speed, T-1
We Impeller Weber number (=ρcN2D3/σ)
max
d Maximum stable drop diameter, L
min
d Minimum stable drop diameter, L
Greek symbols
φ
Volume fraction of dispersed phasec
ρ
Density of continuous phase, M/L3Iranian Journal of Chemical Engineering, Vol.8, No. 1 45
References
[1] Singh, K.K., Mahajani, S.M., Shenoy, K.T. and Ghosh., S.K., "Representative drop sizes and drop size distributions in A/Odispersions in continuous flow stirred tank", Hydro-metallurgy (2007).
[2] Zerfa, M. and Brooks, B.M., "Prediction of vinyl choloride drop sizes in stabilized liquid-liquid agitated dispersion", Chemical Engineering Science, 51 (12), 3223-3233 (1996).
[3] Zhou, G. and Kresta, S.M., "Evolution of drop size distribution in liquid-liquid dispersions for various impellers", Chemical Engineering Science, 53 (11), 2099-2113 (1998).
[4] Chatzi, E. G., Boutris, C. J. and Kiparissides, C., "On-Line monitoring of drop size distributions in agitated vessels.1.Effect of temperature and impeller speed", Industrial Engineering Chemical Research. 30, 536-543 (1991).
[5] Skelland, A.H.P. and Kanel, J.S., "Transient drop size in agitatid liquid-liquid systems, as influenced the direction of mass transfer and surfactant concentration", Industrial Engine-ering Chemical Research. 31, 2556-2563 (1992).
[6] Kumar, S., Ganvir, V., Satyanand, C., Kumar, R. and Gandhi, K. S., "Alternative mechanisms of drop breakup in stirred vessels", Chemical Engineering Science, 53 (18), (1998).
[7] Boye, A.M., Lo, M-y. A. and Ayazi Shamlou, P. "The effect of two-liquid phase rheology on drop breakage mechanically stirred vessels", Chemical Engineering Com-mercial, 143, 149-167 (1996).
[8] Ruiz, M.C., Lermanda, P. and Padilla, R., "Drop size distribution in batch mixer under breakage conditions", Hydrometallurgy, 63, 65-74 (2002).
[9] Ban, T., Kawaizumi, F., Nii, S., and Takahashi, K., "Effect of surface activities of extractants on drop coalescence and breakage in a mixer-settler", Industrial Engineering Chemical. Research, 41 (22), (2002).
[10] Desnoyer, C., Masbernat, O. and Gourdon, C., "Experimental study of drop size distributions at high phase ratio in liquid– liquid dispersions", Chemical Engineering Science, 58, 1353 – 1363 (2003).