Object-Based Image Analysis Technique for
Gully Mapping using Topographic Data at Very
High Resolution (VHR)
Antonio Francipane
1*, Francesca Mussomè
1†, Giuseppe Cipolla
1‡&
Leonardo V. Noto
1§1 Dipartimento di Ingegneria Civile, Ambientale, Aerospaziale, dei Materiali (DICAM),
Università degli Studi di Palermo, viale delle Scienze, 09142 Palermo, Italy
[email protected], [email protected],
[email protected], [email protected]
Abstract
An accurate mapping of gullies is important since they are still major contributors of sediment to streams. Mapping gullies in many areas is difficult because of the presence of dense canopy, which precludes the identification through aerial photogrammetry and other traditional remote sensing methods. Moreover, the wide spatial extent of some gullies makes their identification and characterization through field surveys a very large and expensive proposition.
This work aims to develop an object-based image analysis (OBIA) to detect and map gullies based on a set of rules and morphological characteristics retrieved by very high resolution (VHR) imagery. A one-meter resolution LiDAR Digital Elevation Model (DEM) is used to derive different morphometric indexes, which are combined, by using different segmentation and classification rules, to identify gullies. The tool has been calibrated using, as reference, the perimeters of two relatively large gullies that have been measured during a field survey in the Calhoun Critical Zone Observatory (CCZO) area in the Southeastern United States.
* Coordinates simulations and created the first stable version of this document † Made simulations in eCognition
‡ Created the first draft of this document § Masterminded the project
Engineering Volume 3, 2018, Pages 725–730
1
Introduction
Among the different types of soil erosion, gully erosion can be considered as a form of accelerated erosion. The presence of significant gully erosive processes may affect soil productivity, restrict land use, and lead to an increase of risk to infrastructure.
Identifying gullies requires a very precise definition of such landforms. (Poesen, Nachtergaele, Verstraeten, & Valentin, 2003) classified gullies as permanent gullies, ephemeral gullies, and bank gullies, while (Peasley & Taylor, 2009) defined gully erosion as a process that causes the removal of soil through concentrated surface runoff and characterized by incised channels greater than 30 cm, and generally restricted to streams with order lower than three.
While gullies can be mapped through conventional field surveying, this task is an intensive and expensive activity. In fact, identifying the edges of relatively large gullies can be difficult, even from in-situ observations. One cheaper and more expeditious way to detect gullies can be achieved in terms of morphological characteristics. Since Digital Elevation Models (DEMs) provide the most important source of quantitative morphometry, they are a popular choice for mapping gullies. So far, one of the main historical obstacles for using of DEMs for mapping gullies at landscape scale has been the relatively low resolution that characterized past DEMs. The recent widespread availability of very high resolution (VHR) imagery, such as LIDAR data (Roering, et al., 2013), has drastically changed this constraint, leading to a remarkable growth in the availability of terrain information providing a basis for the development of new methodologies for analyzing Earth surfaces (Tarolli, Arrowsmith, & Vivoni, 2009).
Different procedures have been developed to operate on these high resolution DEM data. They can be roughly classified as (a) pixel-based (or using per-pixel approach) and (b) object-based (i.e., using object-based image analysis - OBIA), which analyzes spatial data using the concept of the image object (Blaschke, Object based image analysis for remote sensing, 2012) (Blaschke, et al., 2014) (Eustace, Matthew, & Christian, 2009) (Shruthi, Kerle, & Jetten, 2011) (Johansen, Taihei, Tindall, & Phinn, 2012) (D’Oleire-Oltmanns, Marzolff, Tiede, & Blaschke, 2014). While the performance of the traditional pixel-based approaches depends entirely on the information of single pixels and the direct neighbourhoods, the second group of methods still exploit pixel information but through a procedure of pixels grouping (i.e., segmentation). Additional features such as homogeneity of the region and within-region variation can be addressed.
This work aims to develop and assess an object-based procedure to detect gullies based on their morphological characteristics retrieved from LiDAR DEM. The framework is used in the Calhoun Critical Zone Observatory (CCZO) where several gullies have been observed and mapped and where a very high resolution (i.e., 1 m) LiDAR DEM is now available.
2
Material and Methods
2.1
Study Area
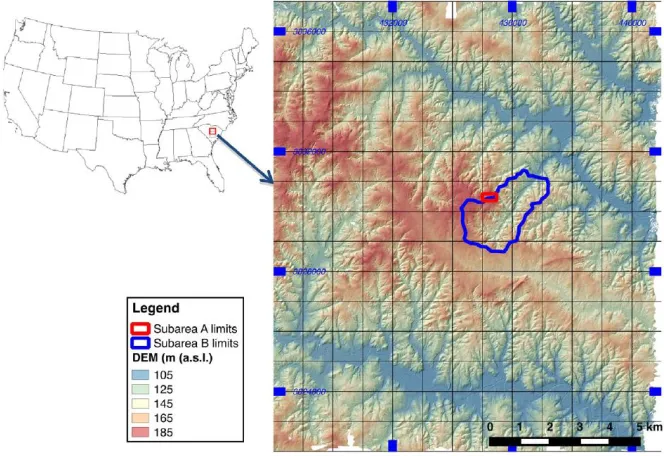
The CCZO is located in the USA’s Southern Piedmont that extends from Virginia to Alabama, and is part of the CZO project, i.e., a project funded by National Science Foundation for the observation and the study of nine US natural ‘‘critical zones”. By the mid-20th century, nearly 18 cm of soil over more than 10 million ha were estimated to have been lost to erosion. An estimated 200 km2 of actively eroding gullies and severely eroded soils initially dissected the Sumter National Forest.
subareas have been identified to test and apply the proposed method. The first, called SUBAREA-A, covers an area of approximately 1 km2 where two gullies have been identified and mapped for the calibration of the method aimed to the gully identification. The second subarea (SUBAREA-B, with an area of 4.3 km2) corresponds to the Holcombe’s Branch watershed, a tributary of Tyger River.
2.2
Morfometric Indexes
The methodology builds on the use of different morphometric indexes able to detect the presence of specific landforms, which can be interpreted as part of a gully.
The Topographic Position Index (TPI) (Guisan, Weiss, & Weiss, 1999) has been already used to detect gullies by (Evans & Lindsay, 2010). The TPI is defined as the difference between a cell elevation value z and the average elevation 𝑧̅𝑎 of the neighborhoods around that cell within the kernel of size .
Positive values mean the cell is higher than its surroundings while negative values mean it is lower. If
z is significantly higher than 𝑧̅𝑎, then the cell is likely at or near the top of a hill or ridge. Significantly
low values of z (and then of TPI) suggest the cell is at or near the bottom of a valley.
The TPI was derived in GRASS GIS by means of the existing r.neighbors function; this function requires the definition of kernel size among the other optional Inputs.
Surface slope and curvature, which are the first and second spatial derivative of the terrain elevations, respectively, are two of the basic terrain parameters widely used in terrain analysis (Evans I. , 1979) and landform classification (Schmidt & Hewitt, 2004). In particular, the profile curvature, PC, (i.e., curvature of the surface in the steepest direction) and tangential curvature, TC, (i.e., curvature of the contour) are the most frequently calculated topographic attribute (Gallant & Wilson, 2000).
The slope, S, and the two curvatures above mentioned were derived in GRASS GIS using the
r.slope.aspect function, which generates raster maps of slope, aspect, curvatures and partial derivatives from an elevation raster map.
The flow accumulation, FA, is defined as the total number of cells, including non-neighbouring cells that drain into a selected cell. It was derived using the GRASS GIS command r.fill.dir and here used to discriminate between river and banks of the river.
3
Results and Discussion
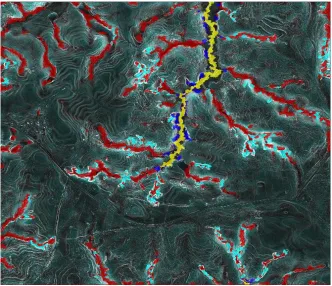
In order to detect gully edges, we used the software eCognition Developer 9.0, which is a powerful development environment for object-based image analysis. Within eCognition, we used different values of shape (i.e., description of an image object using its sub-objects such as length, width, length/width ratio, etc.) and compactness (i.e., the "closeness" of pixels clustered in an object by comparing it to a circle), applied to different morphometric indexes layers, to generate different segmentations. Once the segmentation was obtained, we defined different sets of rules based on the definition of different thresholds for the morphometric indexes above discussed. As already said in section 2.1, the two gullies in SUBAREA-A (Figure 1) were used for the calibration of the method aimed to the gully identification. Above the several combinations, the best identification of gullies was obtained using the following steps and showed in Figure 2:
1. segmentation of the TPI layer using a shape = 0.9 and a compactness = 0.3;
2. classification of first level gullies by means of the rule given by the combination of:
a. mean (TPI) < 1.5;
b. standard deviation (FA) < 50,000;
3. classification of second level gullies by means of the rule given by the combination of:
a. mean (S) > 20;
b. min (PC) < -0.3;
c. min (TC) < 0.25;
4. classification of river by means of the rule FA > 30,000;
4
Conclusions
In this work, an object-based method for gully mapping using topographic data at very high resolution (VHR) has been described and tested. The methodology is based on the joint use of three morphometric indexes, used as detection variables, together with other morphometric variables, used only for selection purposes, within a well-defined procedural chain that involves different spatial analysis techniques and image analysis algorithms. The main results of the applied methodology have demonstrated its capability to provide an efficient tool for gully detecting, mapping, and analyzing.
References
Blaschke, T. (2012). Object based image analysis for remote sensing. ISPRS J. Photogramm. Remote Sens., 65, 2-16. Retrieved from http://dx.doi.org/10.1016/j. isprsjprs.2009.06.004
Blaschke, T., Hay, G., Kelly, M., Lang, S., Hofmann, P., Addink, E., . . . Tiede, D. (2014). Geographic object-based image analysis – towards a new paradigm. ISPRS J. Photogramm. Remote Sens., 87, 180-191.
D’Oleire-Oltmanns, S., Marzolff, I., Tiede, D., & Blaschke, T. (2014). Detection of gully affected areas by applying object-based image analysis (OBIA) in the Region of Taroudannt, Morocco.
Remote Sensing, 6, 8287–8309. Retrieved from http://dx.doi.org/10.3390/rs6098287
Eustace, A., Matthew, P., & Christian, W. (2009). Give me the dirt: detection of gully Innovations in Remote Sensing and Photogrammetry. Springer-Verlag, Berlin Heidelberg, 255-269. Evans, I. (1979). An Integrated System of Terrain Analysis and Slope Mapping. Final Report on Grant
DA-ERO- 591–73-G0040, University of Durham.
Evans, M., & Lindsay, J. (2010). High resolution quantification of gully erosion in upland peatlands at the landscape scale. Earth Surf. Process. Landforms, 35, 876–886. Retrieved from http://dx.doi.org/10.1002/esp.1918
Gallant, J., & Wilson, J. (2000). Primary topographic attributes. In Terrain Analysis: Principles and Applications (p. 479). Chichester: John Wiley & Sons.
Guisan, A., Weiss, S., & Weiss, A. (1999). GLM versus CCA spatial modeling of plant species distribution. Plant Ecol., 143, 107–122.
Johansen, K., Taihei, D., Tindall, D., & Phinn, S. (2012). Object-based monitoring of gully extent and volume in North Australia using LiDAR data. Proceedings of the 4th GEOBIA, (p. 168). Peasley, B., & Taylor, S. (2009). MER – Soil and Land Resource Condition in NSW: Water Erosion –
Monitor and Evaluate Gully Erosion. NSW DECC.
Poesen, J., Nachtergaele, J., Verstraeten, G., & Valentin, C. (2003). Gully erosion and environmental change: importance and research needs. Catena, 50, 91–133. Retrieved from http://dx.doi.org/10.1016/S0341-8162(02)00143-1
Roering, J., Mackey, B., Marshall, J., Sweeney, K., Deligne, N., Booth, A., . . . Cerovski-Darriau, C. (2013). ‘You are HERE’: connecting the dots with airborne lidar for geomorphic fieldwork.
Geomorphology, 200, 172– 183.
Schmidt, J., & Hewitt, A. (2004). Fuzzy land element classification from DTMs based on geometry and terrain position. Geoderma, 121, 243–256. Retrieved from http://dx.doi.org/ 10.1016/j.geoderma.2003.10.008
Shruthi, R., Kerle, N., & Jetten, V. (2011). Object-based gully feature extraction using high spatial resolution imagery. Geomorphology, 134, 260–268. Retrieved from http://dx. doi.org/10.1016/j.geomorph.2011.07.003