Volume 3, 2018, Pages 364–371
HIC 2018. 13th International Conference on Hydroinformatics
Multi-objective and multi-criteria analysis for optimal
pump scheduling in water systems
Silvia Carpitella
1,4∗, Bruno Brentan
2, Idel Montalvo
3, Joaqu´ın Izquierdo
4, and
Antonella Certa
11
DIID - Universit´a degli Studi di Palermo, Viale delle Scienze, Palermo, 90128, Italy
2 CRAN - Universit´e de Lorraine, 2 Rue Jean Lamour, Vandoeuvre-le-Nancy, 54500, France 3
IngeniousWare GmbH, Jollystrasse 11, Kahlsruhe, 76137, Germany
4 FluIng - Universitat Polit`ecnica de Val`encia, 5C Camino de Vera, s/n, Valencia, 46022, Spain
Abstract
This contribution focuses on the problem of optimal pump scheduling, a fundamental element in pursuing operation optimization of water distribution systems. A combined approach of multi-objective optimization and multi-criteria analysis is herein suggested to first find the Pareto front of non-dominated solutions and then to rank them based on a set of weighted criteria. The Non-Dominated Sorting Genetic Algorithm (NSGA-II) is proposed to solve the multi-objective problem, while the Technique for Order of Preference by Similarity to Ideal Solution (TOPSIS) is used to achieve the final ranking.
1
Introduction
Water distribution network (WDN) operation is responsible for significant energy consumption. Optimal management can be crucial to improve the hydro-energetic efficiency of WDNs, through pump operation at lower prices and leakage reduction by suitable pressure control. Taking into account the complexity of these systems and the highly non-linear nature of the hydraulic equations describing them, hydraulic models coupled with optimization algorithms have been widely applied to design optimal operation strategies.
Several works in the literature have proposed solutions for the optimal pump scheduling problem. Among the used techniques, Linear Programming [1], Dynamic Programming [2] and evolutionary algorithms, such as Genetic Algorithms [3, 4] and Particle Swarm Optimization [5] can be highlighted.
Despite single-objective optimization is able to find interesting solutions, problem-solving using it may be complex, mainly for the application of bio-inspired algorithms, and requires special attention to the constraints. Constraints can be managed through penalty functions, which increase the value of the objective function when constraints are violated. However, penalty functions are hard to be selected and can affect directly the performance of the opti-mization process. In contrast, multi-objective optiopti-mization introduces a new perspective and
the constraints of the problem may be treated as objectives to meet. Multi-objective algorithms (MOAs) have been widely applied in urban hydraulics. Instead of a single solution, the final response of an MOA is a set of solutions, the so-called Pareto front, which water utility staff can use as an aid in decision-making.
Considering the problem of optimal scheduling of pumps and valves in WDNs, leak reduction by pressure management and minimal pressure of the system are conflicting objectives. This is also the case for energy saving, which requires lower pump operation. Finally, tank level oscillations are also considered. Despite an MOA can be useful to propose various optimal operation solutions, the final decision picked out from the Pareto front may be hard for the operators.
With this perspective, we propose to manage the solutions obtained from the multi-objective optimization process with a suitable multi-criteria decision-making (MCDM) method able to rank the Pareto front solutions.
The literature [6, 7] strongly supports the use of MCDM methods to achieve high effec-tiveness in decision-making, and several techniques can be applied to ranking purposes [8,9]. Among others, the Technique for Order of Preference by Similarity to Ideal Solution (TOPSIS), originally proposed by Hwang and Yoon [10] and then further developed in [11], is able to rank a wide number of alternatives on the basis of various evaluation criteria.
A combined approach of these two perspectives is aimed at first finding the Pareto optimal set of solutions and then ranking or classifying them [12] to aid decision-making. This approach can be considered as a driver in implementing the alternative that represents the best trade-off according to the various considered criteria. The process will be supported by analysing feedbacks coming from a team of experts.
2
Optimal pump scheduling
Algorithms for optimum pump scheduling typically combine pumps’ statuses within an oper-ational horizon for reducing energy costs. This means to find the best combination of pumps’ statuses guaranteeing safe operation of the WDN, while expending a minimum amount of en-ergy. The optimization problem may be stated in terms of energy cost,F1, for the pump system
as:
F1=
N p
X
i=1
P e
X
t=1
Q(αi,t)H(αi,t)γ
ηi,t
∆tct; (1)
where N p is the number of pumps in the system working during time horizon Pe; Q(αi,t) is
the pumped flow andH(αi,t) is the hydraulic head for pumpioperated under statusαat time
stept, with efficiencyηi,t. Finally,γ is the specific weight of the water, ∆t the time step, one
hour in this work, andct is the energy cost at time stept.
As an operational problem, the solution of the pump scheduling is constrained by the mini-mum pressurePminin the system; the oscillation of tank levels between their maximum,Tk,max,
and minimum,Tk,min; and the number of status switches during the operational horizon. To
avoid penalty functions for treating these constraints, a set of objectives, F2, F3, F4,
respec-tively, can be written for the multi-objective optimization process. For the three mentioned constraints the objective functions are:
F2=
N n
X
j=1
P e
X
t=1
F3=
N t
X
k=1
P e
X
t=1
|Tk,t−Tk,min|+ N T
X
i=1
P e
X
t=1
|Tk,t−Tk,max|; (3)
F4=
N p
X
i=1
P e
X
t=1
si,t; (4)
where, for a water network having N n demand nodes and N t tanks, Pj,t is the pressure at
demand nodej, Tk,t is the water level in tankk, andsi,t is the number of status switches for
pumpiduring the time horizon.
3
Multi-objective optimization and multi-criteria analysis
3.1
Non-dominated sorting genetic algorithms - NSGA-II
The NSGA-II is a Genetic Algorithm development for multi-objective problems, proposed in [13]. In each iteration, NSGA-II improves the fitness of a population of candidate solutions to a Pareto front according to various objective functions. Through evolutionary strategies (e.g. crossover, mutation and elitism), the population is organized by Pareto dominance. Similarly, sub-groups on the Pareto front are suitable evaluated, what eventually promote a diverse front of non-dominated solutions.
3.2
The TOPSIS to rank Pareto optimal solutions
The TOPSIS is based on the concept of distance to a positive ideal solution and to a negative ideal solution (aka nadir). The best alternative is characterized by the shortest distance to the former, and the largest to the later.
As input data, TOPSIS uses a decision matrix contanining assessment of alternatives under given evaluation criteria, and the vector of criteria weights reflecting the perceptions of the experts involved in the analysis.
To rank the set of alternatives, TOPSIS implements the following phases.
1. Statement of the evaluationgij of each alternative iunder each criterionj.
2. Computation of the weighted and normalized decision matrix where the generic element uij is:
uij =wj·zij,∀i,∀j. (5)
wj being the weight of criterion j, andzij the score of generic solutioni under criterion
j, normalized by:
zij=
gij
pPn i=1gij2
,∀i,∀j. (6)
3. Identification of the ideal pointA∗ and of the nadir pointA−:
A∗= (u∗1, . . . , u∗k) =
(max
j uij|j∈I
0
),(min
j uij|j∈I
00
)
, (7)
A−= (u−1, . . . , u−k) =
(min
j uij|j∈I
0
),(max
j uij|j∈I
00
)
, (8)
12000
Energy cost
0 12 50
#109
Pressure deficit
100
Tank level deficits
6 4
150
4000
2 0
200
80 0 100
0 120
Switches of the pumps
140 160
Tank level deficits
180
Pressure Deficit
10 200 12
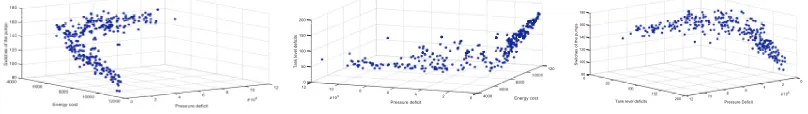
Figure 1: 3-D representation of the Pareto front for the optimal pump scheduling.
4. Computation of the distance from each alternativeito the ideal pointA∗and to the nadir pointA−:
Si∗= v u u t
k
X
i=1
(uij−u∗j)2, i= 1. . . n. (9)
S−i = v u u t
k
X
i=1
(uij−u−j)2, i= 1. . . n. (10)
5. Calculation of the closeness coefficient Ci∗ for each solution i to represent how well i performs with respect to the positive ideal solution:
Ci∗= S
−
i
Si−+Si∗,0≤C
∗
i ≤1,∀i. (11)
6. Ranking the alternatives on the basis of the calculated closeness coefficients. Specifically, referring to two generic solutions i andz, ifCi∗ ≥Cz∗ then solutioni must be preferred to solutionz.
4
Case study
The combined approach for optimal pump scheduling is applied to the D-town network, a benchmark WDN presented in [14]. This network is formed by 396 nodes, 13 pumps and 4 pressure reducing valves. It has been explored in the literature from the energy and leakage management points of view.
The NSGA-II algorithm implemented in Matlab was run using 900 random solutions to find the Pareto front for the optimal pump scheduling problem. Figure 1 presents a 3-D represen-tation of the Pareto front considering the schedule of the pumps. It can ve highlighted that the more expensive the operation, the lower the deficit of pressure. This correlation is clear, since more expensive operations are related to longer use of pumps, thus puting more hydraulic head into the system. The optimal operational cost increases when the number of switches decreases. Larger number of switches allows better pump management, saving more energy, even if this can impair the future behaviour of the pumps. Lastly, tank deficit increases with the operational costs, since the higher the hydraulic head in the network, the higher the volume overflowed from the tanks.
0 12 0.1 0.2
12000
Resilience
0.3
Pressure Deficit 0.4
Energy cost 0.5
5000 0 4000
42 12 44 46
12000
Pressure Uniformity
48
Pressure Deficit 50
Energy cost 52
2 0 40005000 0
52 0.1 0.2
12
Resilience
0.3
Pressure Uniformity 0.4
Pressure Deficit 0.5
2 42 0
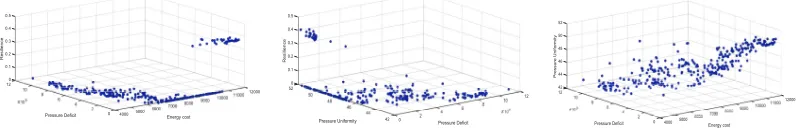
Figure 2: Representation of the criteria for each solution of the Pareto front.
• Operational cost obtained from the Pareto front.
• Operational lack of service, herein considered as pressure deficit at the demand nodes.
• Pressure uniformity (P U) parameter, for evaluating pressure compliance. This parameter allows to assess the pressure in the system in terms of the difference between the opera-tional and the minimal and average pressures in the system. Less uniform pressure zones, with high pressure diference values, are found in the network corrresponding to bigger values ofP U.
• The resilience of the network, calculated as proposed in [15].
To identify the correlations of each criteria with respect to the solutions in the Pareto front, Figure 2 presents a 3-D representation of the criteria parameters.
The TOPSIS methodology was carried out to rank a set of 315 Pareto solutions. Each solution was codified with a code, P Sn, n varying from 1 to 315, and was quantitatively
evaluated under the four given criteria, respectively identified asC1,C2, C3 andC4. The first
three criteria have to be minimized whereas the fourth has to be maximized. The ideal and the nadir points for the weighted, normalized decision matrix are, respectively: A∗= (8.60E− 03; 0.00E+00; 1.26E−02,4.51E−02) andA−= (2.11E−02; 4.23E−02,1.53E−02,0.00E+00). Three scenarios were then analysed: the first considers equal assignement of weights; in the second scenario a lower importance is given to the economic aspect, whereas the third scenario contemplates the prominence of the cost with respect to the other features.
After implementing TOPSIS and achieving the complete ranking of the 315 alternatives, we provide the set of the ten best solutions, the ones in the first ten positions in the ranking accord-ing to the closeness coefficient. Results for the three scenarios and the numerical evaluations of the criteria are given in Tables 1 to 3.
By observing the reported results, it is possible to note some variations in the final rankings. The solutionP S49 appears to be the more suitable trade-off among the optimal alternatives,
according to the evaluations of the considered criteria, occupying the first position in two considered scenarios, and the second position in the last scenario.
To evaluate the effects of leakage in the optimal solution, leaks were added for each pipe. The leakage model (see next equation) considers the pressure-driven model, in which the pressure in the leakage orifice of a pipem is taken as the mean value between the upstream,Pu
m,t, and
the downstream,Pd
m,t, pressures. Coefficientsβ andαdepend on the leakage features; in this
work, the adopted values are 10−6 and 0.9, respectively.
Qleakt,m =β·(P
u
m,t+Pm,td
2 )
Table 1: Final ranking for the vector of criteria weights [0.25, 0.25, 0.25, 0.25]
Ranking position Solution C1 C2 C3 C4 Ci∗
1 P S49 9.32E+03 0.00E+00 5.08E+01 4.36E-01 0.876997066
2 P S203 9.39E+03 0.00E+00 5.04E+01 4.31E-01 0.87518652
3 P S218 8.79E+03 1.83E-01 4.86E+01 3.95E-01 0.87194253
4 P S47 9.25E+03 9.79E-01 4.71E+01 3.95E-01 0.863532413
5 P S50 1.00E+04 0.00E+00 5.03E+01 4.13E-01 0.855952728
6 P S196 1.01E+04 0.00E+00 5.03E+01 4.10E-01 0.852093356
7 P S234 9.66E+03 0.00E+00 5.02E+01 3.93E-01 0.851803008
8 P S302 1.03E+04 0.00E+00 5.17E+01 4.13E-01 0.848682341
9 P S175 1.01E+04 0.00E+00 5.02E+01 3.93E-01 0.842288929
10 P S1 1.05E+04 0.00E+00 5.08E+01 4.08E-01 0.84207829
Table 2: Final ranking for the vector of criteria weights [0.10, 0.30, 0.30, 0.30]
Ranking position Solution C1 C2 C3 C4 Ci∗
1 P S49 9.32E+03 0.00E+00 5.08E+01 4.36E-01 0.943693148
2 P S203 9.39E+03 0.00E+00 5.04E+01 4.31E-01 0.943618474
3 P S50 1.00E+04 0.00E+00 5.03E+01 4.13E-01 0.929216493
4 P S196 1.01E+04 0.00E+00 5.03E+01 4.10E-01 0.925949449
5 P S302 1.03E+04 0.00E+00 5.17E+01 4.13E-01 0.924835185
6 P S1 1.05E+04 0.00E+00 5.08E+01 4.08E-01 0.920890314
7 P S169 1,06E+04 0,00E+0 5,07E+01 4,07E-01 0.91954257
8 P S218 8.79E+03 1.83E-01 4.86E+01 3.95E-01 0.919142038
9 P S47 9.25E+03 9.79E-01 4.71E+01 3.95E-01 0.919006964
10 P S289 1.11E+04 0.00E+00 5.11E+01 4.10E-01 0.91892125
Table 3: Final ranking for the vector of criteria weights [0.40, 0.20, 0.20, 0.20]
Ranking position Solution C1 C2 C3 C4 Ci∗
1 P S218 8.79E+03 1.83E-01 4.86E+01 3.95E-01 0.794510671
2 P S49 9.32E+03 0.00E+00 5.08E+01 4.36E-01 0.787181766
3 P S203 9.39E+03 0.00E+00 5.04E+01 4.31E-01 0.783915221
4 P S47 9.25E+03 9.79E-01 4.71E+01 3.95E-01 0.777539553
5 P S234 9.66E+03 0.00E+00 5.02E+01 3.93E-01 0.760784162
6 P S50 1.00E+04 0.00E+00 5.03E+01 4.13E-01 0.756493058
7 P S196 1.01E+04 0.00E+00 5.03E+01 4.10E-01 0.751291207
8 P S302 1.03E+04 0.00E+00 5.17E+01 4.13E-01 0.745726008
9 P S175 1.01E+04 0.00E+00 5.02E+01 3.93E-01 0.743955655
In terms of the four criteria, the solutionP S49evaluated under the leakage condition presents
an increase of energy consumption and of P U, while the resilience decreases. In the leakage scenario, the pumps work out of the optimal operational point, resulting in lower efficiency.
As leakage changes the operational point of pumps and the pressure in the network, P U increases, thus pointing to lower pressure uniformity in the system.
5
Conclusions
The management of WDNs requires great attention in the context of urban and climate changes. The optimal schedule of pumps involves many physical and operational constraints, turning single-objective optimization hard, since the use of penalty functions modifies the search space and often creates local minima. In contrast, multi-objective optimization results in a Pareto front of solutions, but the final selection of a unique solution is a hard task for real-time oper-ation. In this regard, this work presents a multi-objective approach coupled to a multicriteria analysis for pump scheduling. The ranking of 315 Pareto solutions has been carried out in the addressed case study, with the aim to select the most suitable solution according to the evalu-ation of four criteria, namely cost, operevalu-ational lack of service, presure uniformity and network resilience. Three scenarios, considering different weights attributed to the mentioned criteria, have been taken into account. The final selected solution presents interesting features in terms of cost and operational indexes, such as P U and resilience. The evaluation of this solution under a leakage scenario, points to the modifications of the performance indexes, resulting in cost increase and resilience reduction.
Acknowledgements
Part of this work has been developed under the support of the UPV mobility program for PhD students, awarded to the first author.
References
[1] P.W. Jowitt and Ch.Xu. Optimal valve control in water-distribution networks. J. Water Res. Plan. Mgmnt., 118, 455—472, 1990.
[2] P.W. Jowitt and G. Germanopoulos. Optimal pump scheduling in water-supply networks. J. Water Res. Plan. Mgmnt.. 118, 406—422, 1992.
[3] P.F. Boulos, Z. Wu, Ch. Orr, M. Moore, P. Hsiung, and D. Thomas. Optimal pump operation of water distribution systems using genetic algorithms. Distribution System Symposium, 2001. [4] R. Farmani, P. Ingeduld, D. Savic, G. Walters, Z. Svitak, and J. Berka. Real-time modelling of a
major water supply system. Proceedings of the Institution of Civil Engineers-Water Management 160, 103—108, 2007.
[5] B.M. Brentan and E.Luvizotto Jr. Rening pso applied to electric energy cost reduction in water pumping. Water Res. Mgmnt., 4, 19—30, 2014.
[6] S. Hamdan and A. Cheaitou. Supplier selection and order allocation with green criteria: An mcdm and multi-objective optimization approach. Comput. Oper. Res., 81, 282-–304, 2017.
[8] L. Cruz-Reyes, E. Fernandez, P. Sanchez, C.A. Coello, and C. Gomez. Incorporation of implicit decision maker preferences in multi-objective evolutionary optimization using a multi-criteria clas-sication method. Appl. Soft Comput., 50, 48—57, 2017.
[9] I.A. Baky. Interactive topsis algorithms for solving multi-level non-linear multi-objective decision-making problems. Appl. Soft Comput., 38, 1417—1433, 2014.
[10] C.L. Hwang and K. Yoon. Multiple attribute decision making: Methods and applications. Springer Verlag, New York, 1981.
[11] C.L. Hwang, Y.J. Lai, and T.Y. Liu. A new approach for multiple objective decision making. Comput. Oper. Res., 20,889-–899, 1993.
[12] M. Ancˇau and C. Caizar. The computation of pareto-optimal set in multicriterial optimization of rapid prototyping processes. Comput. Ind. Engrg., 58, 696—708, 2010.
[13] K. Deb, A. Pratap, S. Agarwal, and T.A.M.T Meyarivan. A fast and elitist multiobjective genetic algorithm: Nsga-ii. IEEE Trans. Evol. Comput., 6,182–197, 2002.
[14] Ch. Stokes, W.Wu, G.Dandy, et al. Battle of the water networks ii: Combining engineering judgement with genetic algorithm optimisation. WDSA 2012: 14th Water Distribution Systems Analysis Conference, Adelaide, South Australia, 77, 2012.
![Table 1: Final ranking for the vector of criteria weights [0.25, 0.25, 0.25, 0.25]](https://thumb-us.123doks.com/thumbv2/123dok_us/8878604.1818358/6.612.103.509.536.673/table-final-ranking-vector-criteria-weights.webp)
