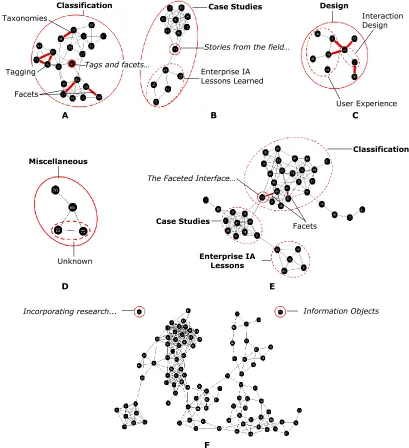
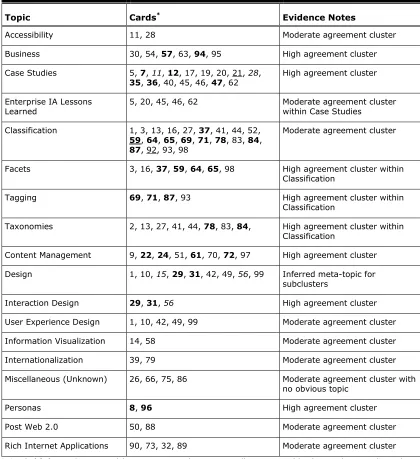
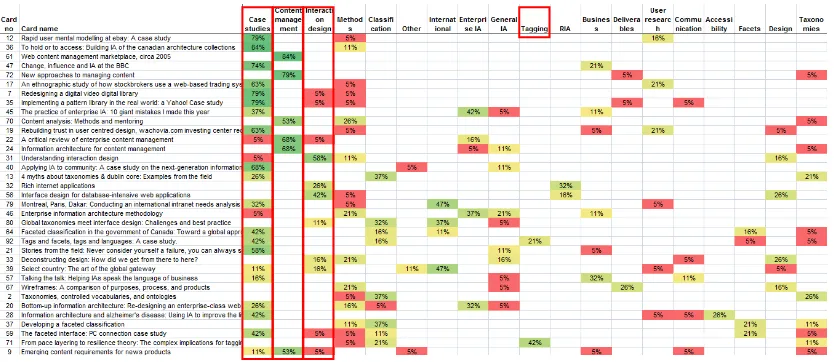
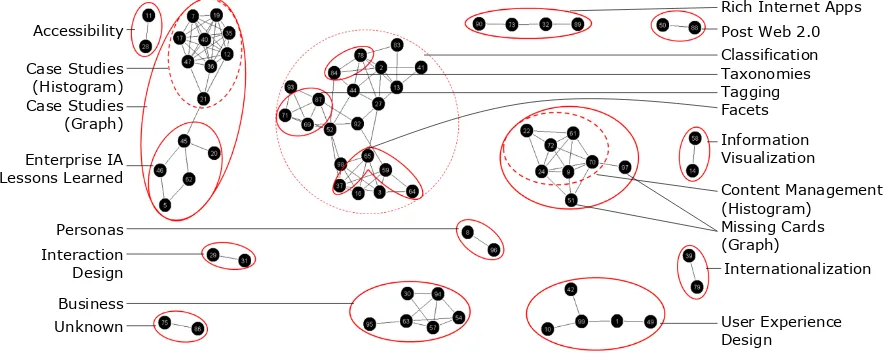
Analyzing Card-Sorting Data Using Graph Visualization
Full text
Figure

Related documents
And because it shares the same robust central database and security model, MEDIATOOLS WEB ACCESS offers the same accurate, real-time reporting that has made
Financial literacy is important for promoting savings behaviour for both rural and urban financial consumers as well as female and male individuals.. We show that there is scope
Accident investigation Accident investigation Safety video Safety video Written judgment Written judgment Accident statistics Accident statistics Others Others. Construction
According to the theory of selection and passive learning (Jovanovic, 1982), while there is a lot to be learned about the underlying but unobservable endowment of
And then this paper analyzes various case studies on green infrastructure as water sensitive urban landscape design, which are categorized by city-scale's case studies such as
is negative, however, estimated desired saving is negative for a large fraction of families.) Recall that to control for individual-specific saving behavior we have predicted f3
Given that Dutch insurers generally hold capital levels well in excess of the regulatory requirements (De Haan and Kakes 2010) and given Rauh’s (2009) finding that risk
Marketing, marketing strategy, car distribution, market entry, Bentley, Lamborghini, used cars, Leonhardt Group, Balkan..
