A Data-driven Approach for Optimal Control parameters
in WWTP: the VEAS Experience in Scandinavia
Piciaccia Luca
1, Croce Danilo
2, Basili Roberto
2, Pettersen Jonas
1, Ryfors Pia
11
VEAS Vannhuset, Bjerkåsholmen 125, 3470 Slemmestad, Norway
2
Department of Enterprise Engineering, University of Roma, Tor Vergata, Italy
Corresponding author:
[email protected]
Abstract
VEAS is the largest WWTP in Norway, where inflow is collected through a combined sewer system, i.e., storm water runoff is combined in a common conduit with wastewater from homes, businesses, and industry and delivered to the plant. From a process perspective this already high degree of variability is further compounded by return flows from the plant itself. The VEAS plant is fully located in cavern and is operated 24/7. Cavern location requires low footprint and consequently high surface load. The VEAS process features a “single-shot” sedimentation and has a record-low water retention time of 3 hours. This highly efficient configuration is sensitive to variation in the inflow water parameters and internal plant recirculation flows, 25 measured parameters have been identified as impacting the effectiveness of the sedimentation process. Due to the high non-linearity of the parameters influence, even extensive use of classic non-linear statistical analysis has failed to clearly identify the main performance drivers of the process.
In this paper we investigate the use of Kernel-based and Neural methods for the learning of the optimal control parameters in the context of industrial plants. The main objective is to define an automatic way to identify and tune the most relevant parameters of the plant (e.g., dosage of chemicals, sump level setting) to minimize the final water turbidity. The adopted machine learning framework enables the automatic analysis of the evolution of the plant behavior over time, i.e. exploits sensors readings stored for a long time period (one year), to develop a predictive model of the future behavior of the system.
1
Introduction
VEAS is the largest Norwegian Waste Water treatment Plant (WWTP) and its operation is essential for maintaining the Oslo fjord water at the requested quality level. Vestfjorden Avløpsselskap, VEAS, is fully owned by a consortium of municipalities (Aker, Bærum and Oslo).
The plant and the administration services are located on the coast at Bjerkås in the municipality of Asker. The plant features a wide spectrum of equipment and advanced processes. Wastewater from more than 650’000 inhabitants in Oslo, Asker and Bærum is conveyed through the VEAS main tunnel
Engineering
EPiC Series in Engineering
Volume 3, 2018, Pages 1648–1655
HIC 2018. 13th International Conference on Hydroinformatics
(43 km, full bore, 3 meter hydraulic diameter) from the branch-in points in each municipality to the WWTP at Bjerkås in Asker. The plant is entirely located in cavern and is operated 24/7. In addition to efficient wastewater cleaning, VEAS contributes to the re-use of organic nutrients through the production of stabilized, hygenized and lime-added VEAS-soil (38’000 ton/year), appreciated as soil integrator by the region’s farmers, together with nitrogen product supplied to the fertilizers industry (4’000 ton/year). VEAS produces yearly 78 GWh via biogas, used to generate electricity and heat.
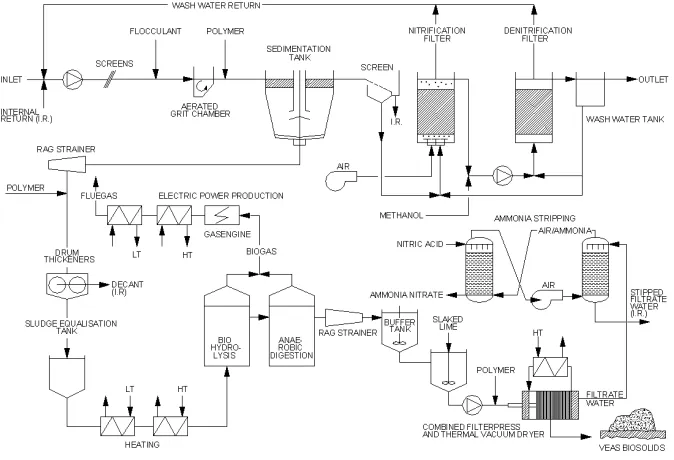
The process of interest consists of fine screens coagulant dosing in aerated grit chambers, also used as air flocculators, followed by deep sedimentation tanks for single point removal of primary, chemical and biological sludge. The water then flows to an up-flow biofilm nitrification and post de-nitrification. The sludge is extracted from the bottom of the sedimentation tanks and processed in drum thickeners followed by two-stage anaerobic digestion with biogas production, filter pressing and vacuum drying operation. The reject water with high ammonia content is exploited by air stripping yielding nitrogen product. See figure 1. The inlet water exhibits low concentration of solids and solute due to combined sewers. The temperature of the incoming sewage over the year is typically between 5 and 16 °C, +/-2°C. The pre-precipitation starts in the grit chambers (not shown). This step retention time is 5 - 13 minutes.
Figure 1 The VEAS concept for nitrogen removal
The mixing device for ferric chloride PIX is placed at the inlet of the channel. The PAX (polyaluminium chloride with high basicity) mixer, is submerged in the middle of the grit chambers. The addition of anionic polymer is essential for the formation and settling of flocks. The addition point of polymer is at the end of the channels leading to the sedimentation tanks.
The sewage water flows from the grit chambers to the sedimentation tanks. The small surface area in the sedimentation tanks results in operation at high surface loads. The daily operation surface load
A Data-driven Approach for Optimal Control Parameters in WWTP: ... L. A. Piciaccia et al.
The efficiency of the sedimentation process experienced some instability over time and a more predictable performance is desired. A full model of the process is not available due to the large-number multivariate non-linear character of the involved variables (over 20 independent variables). Previous attempts with extensive use of classic statistical analysis have failed to clearly identify the main performance drivers of the process. The process is now controlled through heuristic algorithms delivering an adequate average performance with infrequent process divergence.
As highlighted in [1] and [2] sedimentation and its performance has a major impact on the whole wastewater treatment process although no satisfying model is available, from the lack of knowledge on the physical phenomena to the difficulties to establish the associated partial differential equations. Nevertheless, the vast amount of data that can be acquired from the sensors readings suggest this is a big-data scenario, where huge amount of information can be acquired from the plant (millions of parameter measurements per year). The data can be exploited to support the optimization of the plant performance and, most important, to enable predictive control of the system behavior. We see mining this data source as the key to solving the complex problems associated with the full-scale plant control. In this paper, we investigate the application of data-driven methods to enable more robust strategies for the control parameters of the VEAS plant.
In particular, we propose the design, implementation and evaluation of Kernel-based and Neural methods for the learning of the optimal control parameters in the context of industrial plants, with VEAS sedimentation processes as the study subject.
The main objective is to define an automatic way to tune some of the parameters of the plant (i.e. the usage of chemicals) to optimize the final water turbidity. The adopted machine-learning framework aims at enabling the automatic analysis of the evolution of the plant behavior over time, i.e. the sensors readings stored in a long time period (one year), to develop a predictive model of the future behavior of the system in terms of (i) the prediction of future satisfactory plant status given the actual sensors reading, (ii) the estimation of Chemicals dosagenecessary to obtain a satisfactory quality of water turbidity at varying plant loads and (iii) the identification of the most influential parameters and variables both internal and external to the plant.
Our final aim is to support the development of robust and effective AI agents able to enhance the management strategy of the plant, e.g. raising warnings when problematic statuses are predicted or propose intervention by addressing those driving parameters, which affect the overall process.
In the structure of this paper, Section 2 provides a formalization of the targeted problem as well as the adopted data-driven framework. Section 3 provides a first experimental evaluation that addresses the above points. Finally, Section 4 derives the conclusions and describes future research steps for a complete data-driven control of the plant.
2
Data-driven Approach, Optimal WWTP Control parameters
2.1
Modeling the parameters
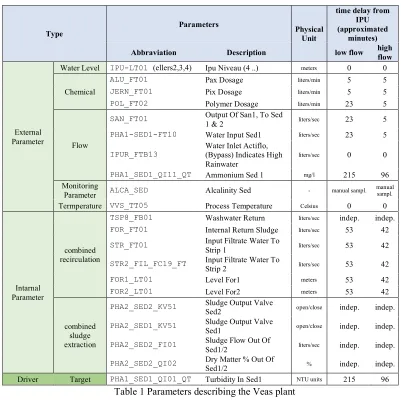
Plant parameters are monitored and logged through a Distributed Control System with a sampling frequency of 1 minute, the following table lists the parameters used for this study, together with their units of measurement and the delay from Time 0 i.e. from the time at which the water is pumped into the plant from the sump.
A Data-driven Approach for Optimal Control Parameters in WWTP: ... L. A. Piciaccia et al.
Type
Parameters Physical Unit
time delay from IPU (approximated
minutes)
Abbraviation Description low flow high flow
External Parameter
Water Level IPU-LT01 (ellers2,3,4) Ipu Niveau (4 ..) meters 0 0
Chemical
ALU_FT01 Pax Dosage liters/min 5 5
JERN_FT01 Pix Dosage liters/min 5 5
POL_FT02 Polymer Dosage liters/min 23 5
Flow
SAN_FT01 Output Of San1, To Sed 1 & 2 liters/sec 23 5
PHA1-SED1-FT10 Water Input Sed1 liters/sec 23 5
IPUR_FTB13 Water Inlet Actiflo, (Bypass) Indicates High Rainwater
liters/sec 0 0
PHA1_SED1_QI11_QT Ammonium Sed 1 mg/l 215 96 Monitoring
Parameter ALCA_SED Alcalinity Sed - manual sampl.
manual sampl.
Termperature VVS_TT05 Process Temperature Celsius 0 0
Intarnal Parameter
combined recirculation
TSP8_FB01 Washwater Return liters/sec indep. indep.
FOR_FT01 Internal Return Sludge liters/sec 53 42
STR_FT01 Input Filtrate Water To Strip 1 liters/sec 53 42
STR2_FIL_FC19_FT Input Filtrate Water To Strip 2 liters/sec 53 42
FOR1_LT01 Level For1 meters 53 42
FOR2_LT01 Level For2 meters 53 42
combined sludge extraction
PHA2_SED2_KV51 Sludge Output Valve Sed2 open/close indep. indep.
PHA2_SED1_KV51 Sludge Output Valve Sed1 open/close indep. indep.
PHA2_SED2_FI01 Sludge Flow Out Of
Sed1/2 liters/sec indep. indep.
PHA2_SED2_QI02 Dry Matter % Out Of Sed1/2 % indep. indep.
Driver Target PHA1_SED1_QI01_QT Turbidity In Sed1 NTU units 215 96
Table 1 Parameters describing the Veas plant
The time delay is pivotal in understanding the effect of the chemicals, which are added at the early stages of the wastewater journey, on the turbidity that is measured at the outflow from the sedimentation stage. The plant return flows, with their chemical content, are deemed to play an important role in the sedimentation process, they also appear with their specific time delay.
Two time delays classes are used, one for the “low flow-rate” normal plant operation under “dry” i.e. not rainy conditions and one for “high flow-rate” during stormy weather and/or snow melting. Under high flow-rate the plant operates at minimum retention time. The tags, i.e. the unique variable identifier also used in the DCS, are grouped in the table for ease of reading, but are treated individually in the analysis. In this study, in order to support the prediction of future satisfactory plant status, we will consider as target parameter the one located the last row of the table (PHA1_SED1_QI01_QT) that represents the quality of water at the end process. In the following section, we will discuss how the above problem can be mapped into a classification task.
A Data-driven Approach for Optimal Control Parameters in WWTP: ... L. A. Piciaccia et al.
2.2
Predictive analytics via Neural Kernel methods
Different machine learning algorithms exist in order to exploit data evidences and acquire a predictive model able to solve or automatize a target task, as discussed in [4][8]. These have been tailored to serve several and different applications, ranging from pattern recognition in images to automatic control of cars.
In this work, among the existing machine learning methods, the Support Vector Machine (SVM) learning algorithm, discussed in [5] and [6] will be employed as it provides an efficient and scalable environment. SVM is a class of methods for constructing classifiers with a strong mathematical foundation, which guarantees good predictive performances in terms of the quality of classification on data processed by non-trained machine learning algorithms. The theoretical foundation of this method is given by statistical machine learning, discussed in [5].
More formally, in this work the goal of a statistical learning algorithm is to construct a mapping from inputs xto outputs y, where y ∈{1, … , C}, with C being the number of classes. If C = 2, this is called binary classification (in which case we often assume y ∈ {0, 1}); if C > 2, this is called multiclass classification. One way to formalize the problem is through function approximation. We assume 𝑦 =
𝑓(𝐱) for some unknown hypothesis function f, and the goal of learning is to estimate the function f
given a labeled training set, and then to make predictions using 𝑦) = 𝑓(𝐱)*, a function estimation. Our main goal is to make predictions on novel instances, meaning ones that we have not seen before (this is called generalization), since predicting the response on the training set is trivial. So, we need data to acquire a prediction function, preferably a large set. We thus assume we have available a set of measurements (x,, y,) or (x,, g,), i = 1, …, N, known as the training data, with which to construct our
prediction function. Given the distribution of the training dataset the SVM learning algorithm is used to derive a 𝑓(𝐱)*.
In our case a satisfactory plant status has the meaning of a plant state where the water at the end of the first cycle of the process exhibits a turbidity less or equal to 14 Nephelometric Turbidity Units (NTU). At the same time, we can extract from the system all the evidences captured by sensors reported in Table 1. The former will be used to model our hypothesis function 𝑓(𝐱), while the latter will support the acquisition of a (large-scale) training dataset. We thus model our task as a classification task where each instance 𝐱 reflect specific snapshots of data points captured in the plant while the prediction function 𝑦) = 𝑓(𝐱)* is expected to assign each instance to the set of satisfactory states (leading to a turbidity less than 14) or to the complementary set of states which will result in an non satisfactory turbidity.
Each item is 𝐱 modeled as a multidimensional vector whose dimensions report does reflect each of the measures captured by the system, as shown in table 1: IPU_LT01, IPU_LT02, IPU_LT03, IPU_LT04, ALU_FT01, JERN_FT01, POL_FT02, SAN1_FT01, PHA1-SED1-FT10-MM, … . Useful additional features are derived as synthesis of the system characterization: e.g., high flow (= true if IPUR_FTB13 > 0 ) and San Override (= true if SAN1_FT01 > 550 ) indicate particular plant conditions. Finally, since the plant feed is dependent from variations associated with the human behavior that are time dependent, e.g., the amount of water received during Monday morning is different from a typical Sunday afternoon, we added the following features, Day of the week, Month, Hour of day. We added as many Boolean dimensions as months in a year, a day in a week and hours in a day. These are recorded in synch with the time-stamp of the snapshot. For example, if the snapshot is generated at 2018 Feb 2, at 20:30pm, the following features will be initialized: February, Friday, 20pm.
A Data-driven Approach for Optimal Control Parameters in WWTP: ... L. A. Piciaccia et al.
Since the different properties characterize heterogeneous physical phenomena, a standard normalization is applied to each dimension so that in the training dataset each property has a mean equal to zero and a variance equal to one.
Finally, since water flows in the plant, appropriate time delays are taken into account so that the water whose turbidity is evaluated at time t is associated with the correct parameters that account for such flow: e.g. when a high-flow is experienced (last column of Table 1) the parameter of IPU-LT01 will be taken at time t – 296 minutes, or the SAN_FT01 will be taken at time t – 296 + 5 minutes.
3
Experimental Evaluation
In order to validate the quality of the proposed predictive methodology, we here report the empirical evaluation of the adopted methods applied to real data provided by VEAS. In particular, we adopted optimized formulation of Support Vector Machines [3,4] that allows training a classifier as discussed in the previous section. In a nutshell, given the sensor measurements with respect to a water flow transient in the plant, the classifier is trained to predict if the necessary injected chemical quantity along with the other parameters, will lead to a satisfactory or unsatisfactory final status of the plant, i.e., turbidity value T ≤ 14 .
Percentage examples
Cumulative
Percentage System Prediction Real Turbidity 84,6% 84,6% T ≤ 14 or T > 14 T ≤ 14 or T > 14
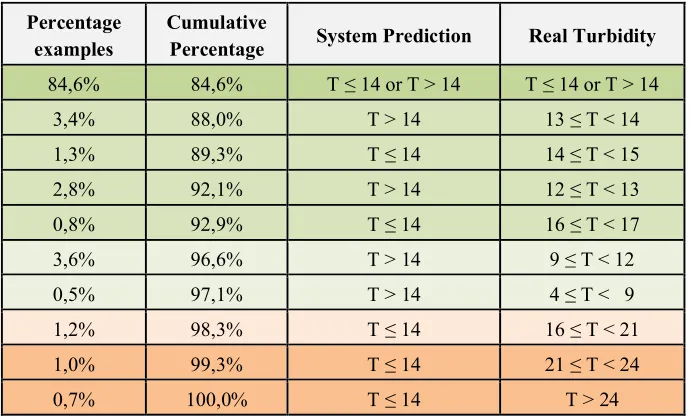
3,4% 88,0% T > 14 13 ≤ T < 14 1,3% 89,3% T ≤ 14 14 ≤ T < 15 2,8% 92,1% T > 14 12 ≤ T < 13 0,8% 92,9% T ≤ 14 16 ≤ T < 17 3,6% 96,6% T > 14 9 ≤ T < 12 0,5% 97,1% T > 14 4 ≤ T < 9 1,2% 98,3% T ≤ 14 16 ≤ T < 21 1,0% 99,3% T ≤ 14 21 ≤ T < 24 0,7% 100,0% T ≤ 14 T > 24 Table 2 Results, in terms of accuracy, of the prediction of satisfactory plant status
The adopted learning methods are extremely efficient [3]. Efficiency is an important aspect to consider, since the overall body of evidences provided by VEAS consists of more than 220,000 observations (measured between 01/11/16 and 25/04/17) each reporting more than 30 sensors, leading to datasets consisting of millions of data points.
We modeled the examples as discussed in Section 2, while the kernel-methods implemented within KeLP [7] are used. The best parameters (i.e. the kernel function underlying the learning process and the SVM parameter measuring the trade-off between training errors and the margin of the decision function) are estimated over a development set.
Table 2 reports the results ranked in terms of accuracy, i.e., the percentage of times the system correctly detected a satisfactory or non-satisfactory plant status. The prediction is thus considered correct if a satisfactory state is assigned to the class of states with T ≤ 14 NTU while a non satisfactory state to a T > 14 NTU. The results are really remarkable: the simple analysis of the information gathered by the
A Data-driven Approach for Optimal Control Parameters in WWTP: ... L. A. Piciaccia et al.
sensors allowed our model to predict 84.6% of times a correct plant status within the narrowest deviation band. When we relaxed our constraints to industrial standard accuracy, i.e., plant conditions within the control capability of the plant, the 97% of predictions were correct. Only when considering plant departures, i.e., those predictions judged as satisfactory while the real turbidity was out of scale, as reported from the last three rows of Table 2, the model did not perform satisfactorily, but neither did the real life industrial plant that has diverged from the acceptable oscillation band, typically due to equipment failure.
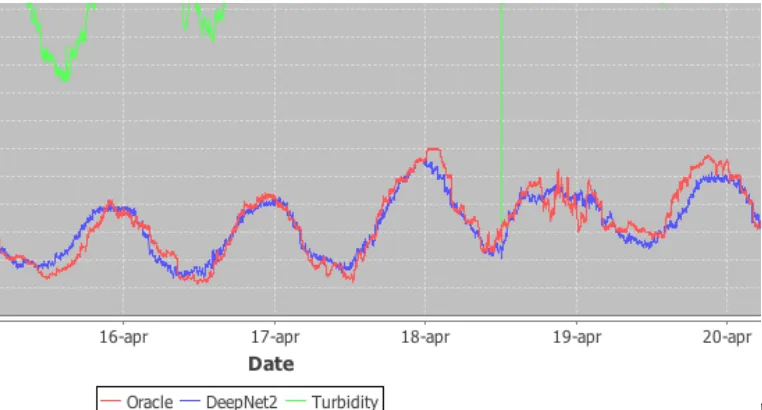
The same machine learning formulation is adopted to address point (ii) to support the estimationof Chemicals dosage. In particular, the adopted framework allows deriving very efficient and effective regressors that, given the readings captured with respect to a specific water flow status, suggest the specific amount of chemicals to inject in a timely fashion. Figure 3 shows the results of a Support Vector Regressor [5], trained over the same dataset used in the evaluation described so far, where the value of polymer POL_FT02 is removed from the set of observed features and considered as target parameter to be learned by the regressor. Results are impressive, given the high correlation between the predicted dosage (in blue) and the original injected chemical (in red).
Figure 3 – The machine learning prediction for the chemical injection flow (in Blue) compared to the amount
of chemical actually dosed in the actual plant (in Red).
Finally, in order to address the point (iii) and identify the most influential parameters, the machine learning predictor has also enabled the analysis of the phenomena in terms of relative influence of selected parameter sets through ablation analysis, i.e. running the predictor with specific features removed from the learning data (e.g., the information about temperature characterized by the VVS TT05 parameter) and evaluating the performance degradation with that specific information missing. These results, due to the page number constraint on this paper, will be the subject of a second publication.
A Data-driven Approach for Optimal Control Parameters in WWTP: ... L. A. Piciaccia et al.
4
Conclusions
It is possible and beneficial to approach complex plant control strategies through big data technology, since this approach can deliver practical solution even for real time constrained applications:
a) The predictive model achieves a narrow band accuracy of about 85% in predicting optimal status of the plant. This accuracy reaches more than 94% including all satisfactory but slightly suboptimal plant performances.
b) A regression model acquired over the data from VEAS allows to automatically predict the amount of chemicals to inject in the system at any given time to obtain a satisfactory status. c) A first Ablative Analysis carried out over the model acquired at point a) suggests that important
findings over the system can be automatically derived, i.e. identifying the physical parameters which strongly influence the plant status, previously considered entirely driven by the chemical parameters.
The above results are crucial for VEAS, as the correct value of turbidity and its permanence within the assigned fluctuation band is essential for the optimal operation of the subsequent water treatment stages. Excess TOC (total organic carbon) lowers the performance of the nitrification and de-nitrification stages and requires costly chemicals to drive the nitrogen removal process to the expected efficiency, required to satisfy the plant license to operate.
Future work will consider the implementation of closed loop control of the water treatment section of the plant through a more detailed evaluation of the regression model and its interaction with the connected plant sections and processes. Moreover, the ablative analysis results will be used for assessing the architecture of the future control system developments and evaluating physical modifications of the plant hardware taking advantage of the new awareness of parameters influence on the process.
References
[1] Gernaey K.V., Jeppsson Ulf LU, Vanrolleghem P.A. and Copp J.B. Benchmarking of Control Strategies for Wastewater Treatment Plants - In IWA Scientific and Technical Report. eISBN: 9781780401171. 2014. [2] Cadet C., Dos Santos Martins V. and Dochain D. Dynamic modeling of clarifier - thickeners for the control of wastewater treatment plants: a critical analysis. In 19th International Conference on System Theory, Control and Computing - Joint Conference SINTES 19, SACCS 15, SIMSIS 19, Oct 2015, Cheile Gradistei, Romania.
[3] Hsieh C.-J., Chang K.-W., Lin C.-J., Keerthi S. S. and Sundararajan S. A. Dual Coordinate Descent Method for Large-scale Linear SVM. In Proceedings of the 25th international conference on Machine learning - ICML '08 (pp. 408-415). New York, New York, USA: ACM Press.
[4] Bishop, C. M. (2006). Pattern Recognition and Machine Learning. [5] Vapnik, V. N. (1998). Statistical Learning Theory.
[6] Basili, R., & Moschitti, A. (2005). Automatic Text Categorization: from Information Retrieval to Sup- port Vector Learning. Aracne.
[7] Filice S., Castellucci G., Croce D. and Basili R.: Kelp: a kernel-based learning plat- form for natural language processing. In: Proceedings of ACL: System Demonstrations. Beijing, China (July 2015)
[8] Ian Goodfellow, Aaron Courville, Yoshua Bengio. Deep Learning. Book in preparation for MIT Press. 2015.
A Data-driven Approach for Optimal Control Parameters in WWTP: ... L. A. Piciaccia et al.