R E S E A R C H A R T I C L E
Open Access
Cost-effectiveness of nivolumab plus
ipilimumab as first-line therapy in
advanced renal-cell carcinoma
Bin Wu
1, Qiang Zhang
2and Jie Sun
3*Abstract
Background:Nivolumab plus ipilimumab improves overall survival and is associated with less toxicity compared with sunitinib in the first-line setting of advanced renal-cell carcinoma (RCC). The current study aimed to assess the cost-effectiveness of nivolumab plus ipilimumab for first-line treatment of advanced RCC from the payer
perspectives high- and middle-income regions.
Methods:A decision-analytic model was constructed to evaluate the health and economic outcomes of first-line sunitinib and nivolumab plus ipilimumab treatment associated with advanced RCC. The clinical and utility data were obtained from published reports. The cost data were acquired for the payer perspectives of the United States (US), United Kingdom (UK), and China. Sensitivity analyses were performed to test the uncertainties of the results. Quality-adjusted life-years (QALYs) and incremental cost-effectiveness ratios (ICERs) were used.
Results:Nivolumab plus ipilimumab gained 0.70–0.76 QALYs compared with sunitinib. Our analysis determined the following ICERs for nivolumab plus ipilimumab over sunitinib in first-line advanced RCC treatment: US $ 85,506 /QALY; UK $ 126,499/QALY; and China $ 4682/QALY. Sensitivity analyses found the model outputs to be most affected for body weight and for the prices of nivolumab, sunitinib and ipilimumab.
Conclusions:Nivolumab plus ipilimumab as first-line treatment could gain more health benefits for advanced RCC in comparison with standard sunitinib, which is considered to be cost-effective in the US and China but not in the UK.
Keywords:Renal cell carcinoma, Nivolumab, Ipilimumab, Sunitinib, Cost-effectiveness
Introduction
The Global Burden of Disease 2015 Study presented that kidney cancer accounted for 1.60% of disease burden
asso-ciated with neoplasms and ranked 14th in deaths [1, 2].
As the most lethal of the prevalent types of kidney cancer, nearly 30% of patients with renal cell carcinoma (RCC) have locally advanced or metastatic disease at diagnosis because they are generally asymptomatic at disease onset [3,4]. Over the last decade, targeted agents, such as suniti-nib and everolimus, which inhibit the vascular endothelial growth factor receptor (VEGFR) or the mammalian target of rapamycin (mTOR) pathways, have become the stand-ard care for treating advanced RCC. However, despite
notable improvements in health outcomes by these new agents, advanced RCC is still incurable with a median overall survival (OS) of 2 years. [5–7] Therefore, it is ne-cessary to develop novel agents for controlling advanced disease.
New agents under the class of immune checkpoint in-hibitors have the potential to provide improved survival benefits and improve the quality of life for patients with advanced cancer who previously had few treatment op-tions. [8] These benefits can be gained through
anti-bodies inhibiting the cytotoxic T lymphocyte–associated
protein 4 (CTLA-4) or the programmed cell death 1
(PD-1) pathway, either alone or in combination [9, 10].
Recently, nivolumab, a PD-1 inhibitor, has shown sur-vival superiority over everolimus in second-line treat-ment of metastatic RCC and has been recommended by the clinical guideline [11]. In comparison with sunitinib, * Correspondence:scilwsjtu-sunjie@yahoo.com
3Department of Urology, Ren Ji Hospital, School of Medicine, Shanghai Jiaotong University, Shanghai, China
Full list of author information is available at the end of the article
the recent CheckMate 214 trial showed nivolumab plus ipilimumab was well tolerated and significantly reduced the risk of death by 32% (hazard ratio [HR] for death, 0.63; P< 0.001) for intermediate- and poor-risk patients with advanced or metastatic advanced RCC who were previously untreated in comparison with sunitinib [12]. The nivolumab plus ipilimumab (CTLA-4 inhibitor) strategy was granted U.S. Food and Drug Administration (FDA) approval as a first-line treatment for adults with advanced RCC.
Due to the high cost of immune checkpoint inhibitors, it is unclear whether the promising nivolumab plus ipilimu-mab treatment would be cost-effective for patients with ad-vanced RCC. One recent systematic review showed the transferability and generalizability of conclusions from the cost-effectiveness analysis are limited because the cost in-puts are region-specific [13]. The current study investigated the economic outcomes of introducing nivolumab plus ipi-limumab as first-line therapy to the present standard care of patients with advanced RCC in the US, UK and China for the extent of transferability and generalizability, which are the representatives of high- and middle-income regions, respectively.
Materials and methods Model structure
A Markov model was developed to evaluate the costs and health outcomes of treating advanced RCC with sunitinib and nivolumab plus ipilimumab. The model included three discrete health states reflecting different characteris-tics of the disease: PFS, progressed disease (PD) and death
(Fig. 1). Because the treatment schedules in CheckMate
214 trial was arranged by using week as the unit, the cycle length of the Markov model was set to be one week [14]. The time horizon was 10-year because 5-year survival rate was lower than 10%, and the initial health state for all of the patients was progression-free survival [15]. During each one-week cycle, the patients either remained in their assigned health state or progressed to a new health state. It was assumed that patients cannot go back to previous health states. The hypothetical patient demographics when entering the model matched those of the patients in
the CheckMate 214 trial: 62 years old and 72.8% male, with previously untreated advanced RCC with a clear-cell component [12]. Model development and data analysis were performed in the R statistical environment (version 3.4.2; R Development Core Team, Vienna, Austria).
The main outcomes were expected life years (LYs), quality-adjusted life-years (QALYs) and cost. Cost and QALYs were discounted at an annual rate of 3% in the United States, 3.5% in the United Kingdom and 5% in
China [16, 17]. The costs are shown in 2017 US dollars.
Incremental cost-effectiveness ratios (ICERs), presented as cost per additional QALY gained, were examined. Accord-ing to the published literatures, the cost-effectiveness thresholds in US, UK and China were$150,000, $65,000 and $27,351 (3× the per capita gross domestic product of China in 2017), respectively [16,17].
Clinical data
Clinical efficacy and safety data were obtained from the CheckMate 214 trial [12]. In intermediate- and poor-risk advanced RCC patients, the 18-month OS rate with nivolumab plus ipilimumab was 75% and was 60% with sunitinib (HR: 0.66, 95% confidence interval [CI]: 0.53– 0.82). The median PFS was 11.6 months with nivolumab plus ipilimumab and 8.4 months with sunitinib.
Accord-ing to the results of goodness of fit measured by the R2
statistic, the Weibull survival function S(t) = exp(−αtβ) and Log-logistic survival function S(t) = 1/(1 +αtβ) were employed for fitting the Kaplan–Meier PFS and OS probabilities of the sunitinib and nivolumab plus ipili-mumab strategy, respectively. The estimated parameters of the Weibull survival function and Log-logistic model
are shown in Table 1, and calibration curve showed in
Additional file1. The duration of the PFS and PD phases
in two competing strategies was calculated using the area under the PFS and OS survival curves. The differ-ence between the OS and PFS estimated from the para-metric survival models was used for calculating the probability from PD to death. [18] After the disease pro-gressed, about 66, 15.8 and 33% of patients in the US, UK and China would receive second-line active treat-ment according to previous reports [19–21].
Advanced RCC
Sunitinib
Progression-free survival
Progressed disease M
Death M
Nivolumab plus ipilimumab
Cost and utility estimates
This analysis adopted the third-party payer, the National Health Service and health care perspectives in the US, UK and China, respectively, which only considered direct medical costs, including the first- and second-line treat-ment, management of treatment-related serious adverse events (SAEs), routine follow-ups and monitoring, best
supportive care (BSC) and terminal care (Table 2). For
comparability, costs for three countries were reported in 2017 US dollars. GBP and Chinese Yuan were converted
into US dollars by using the following exchange formula: 1US $ = GBP 0.7075 and 1US $ = CNY 6.8. US and UK costs associated with health care services were inflated to 2017 values according to the US and UK consumer price
index. [22, 23] As previous study done, we therefore
adopted the approach of taking the average increase in the index for the previous three years when local index is lack [23]. Because the Chinese health care costs were con-trolled by the government and kept stable, the Chinese costs were not inflated in the current analysis.
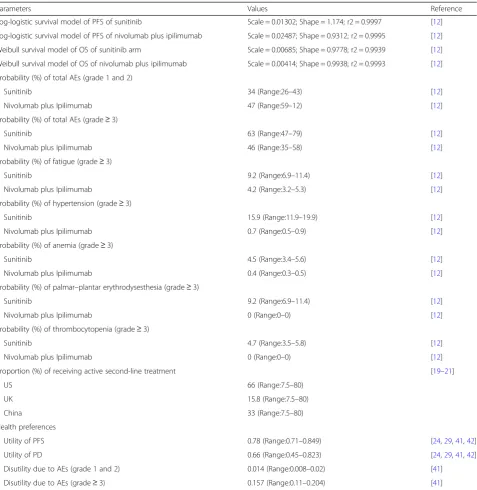
Table 1Key clinical and health preference data
Parameters Values Reference
Log-logistic survival model of PFS of sunitinib Scale = 0.01302; Shape = 1.174; r2 = 0.9997 [12]
Log-logistic survival model of PFS of nivolumab plus ipilimumab Scale = 0.02487; Shape = 0.9312; r2 = 0.9995 [12]
Weibull survival model of OS of sunitinib arm Scale = 0.00685; Shape = 0.9778; r2 = 0.9939 [12]
Weibull survival model of OS of nivolumab plus ipilimumab Scale = 0.00414; Shape = 0.9938; r2 = 0.9993 [12]
Probability (%) of total AEs (grade 1 and 2)
Sunitinib 34 (Range:26–43) [12]
Nivolumab plus Ipilimumab 47 (Range:59–12) [12]
Probability (%) of total AEs (grade≥3)
Sunitinib 63 (Range:47–79) [12]
Nivolumab plus Ipilimumab 46 (Range:35–58) [12]
Probability (%) of fatigue (grade≥3)
Sunitinib 9.2 (Range:6.9–11.4) [12]
Nivolumab plus Ipilimumab 4.2 (Range:3.2–5.3) [12]
Probability (%) of hypertension (grade≥3)
Sunitinib 15.9 (Range:11.9–19.9) [12]
Nivolumab plus Ipilimumab 0.7 (Range:0.5–0.9) [12]
Probability (%) of anemia (grade≥3)
Sunitinib 4.5 (Range:3.4–5.6) [12]
Nivolumab plus Ipilimumab 0.4 (Range:0.3–0.5) [12]
Probability (%) of palmar–plantar erythrodysesthesia (grade≥3)
Sunitinib 9.2 (Range:6.9–11.4) [12]
Nivolumab plus Ipilimumab 0 (Range:0–0) [12]
Probability (%) of thrombocytopenia (grade≥3)
Sunitinib 4.7 (Range:3.5–5.8) [12]
Nivolumab plus Ipilimumab 0 (Range:0–0) [12]
Proportion (%) of receiving active second-line treatment [19–21]
US 66 (Range:7.5–80)
UK 15.8 (Range:7.5–80)
China 33 (Range:7.5–80)
Health preferences
Utility of PFS 0.78 (Range:0.71–0.849) [24,29,41,42]
Utility of PD 0.66 (Range:0.45–0.823) [24,29,41,42]
Disutility due to AEs (grade 1 and 2) 0.014 (Range:0.008–0.02) [41]
Disutility due to AEs (grade≥3) 0.157 (Range:0.11–0.204) [41]
Based on the CheckMate 214 trial, sunitinib was pre-scribed at a dose of 50 mg/day for 4 weeks followed by 2 weeks off treatment [12]. Nivolumab and ipilimumab were administered intravenously at a dose of 3 mg/kg and 1 mg/kg, respectively, every 3 weeks for four doses (induction phase), followed by nivolumab monotherapy at a dose of 3 mg/kg every 2 weeks (maintenance phase). To calculate the dosage of nivolumab and ipilimumab agents, we assumed a typical patient weighed 71.4 kg in the US, 78.7 kg in the UK and 59 kg in China, and the range (29–112 kg) was used in the sensitivity analysis [16, 24, 25]. Based on previous reports, the maximum treatment duration of nivolumab plus ipilimumab was
two years [16, 26]. The medication cost of sunitinib
would be adjusted because the actual dosage intensity of sunitinib was 67% of the planned dosage [27]. The prices of sunitinib, nivolumab and ipilimumab in the US (Aver-age Wholesale Price) and UK were collected from public
databases and literature, respectively [26,28]. The
Chin-ese price of nivolumab is $1362/100 mg. Because ipili-mumab are still unavailable in the Chinese market, we estimate its price by multiplying the price of ipilimumab in UK and the ratio of the price of nivolumab between UK and China. Other cost data were collected from pub-lished literature [19,21,23,24,26,28–35].
The analysis included grade 3/4 adverse events (AEs) that had notably different probabilities between the arms of the CheckMate 214 trial: fatigue, hypertension, anemia,
palmar–plantar erythrodysesthesia and thrombocytopenia
[12]. The recommended management of AEs might be found in the clinical guidelines [36,37]. The costs of man-aging AE per event in the US, UK and China were ex-tracted from literatures. [19,21,32–34,38–40]
Mean health utility scores for PFS and PD state were de-rived from published literature (Table1) [24,29,41, 42]. The disutility values due to grade 1/2 and 3/4 AE were in-cluded in this analysis [41].
Sensitivity analysis
One-way and probabilistic sensitivity analyses were used to test the uncertainty in the model. In the one-way sen-sitivity analyses, to identify key model input parameters that had substantial impact on the model outcome, rele-vant parameters were adjusted one-by-one to their re-spective low and high values, which are listed and
illustrated in Tables 1and 2. The ranges of the
parame-ters used in the one-way sensitivity analyses were ob-tained from the published literature; when reported data were not available, a range of ±25% of the base-case value was used. An assumed 50% discount of the price of sunitinib, ipilimumab and nivolumab were used for one-way sensitivity analyses. The results of the one-way sensitivity analyses are presented in a Tornado diagram. For the probabilistic sensitivity analyses (PSA), parame-ters were sampled using the Monte Carlo method to run 1000 replicated outcomes. Based on the ISPOR-SMDM Modeling Good Research Practices Task Force report on model parameter estimation and uncertainty, the values of the input parameters were sampled from lognormal distributions for costs and fromβdistributions for utility values and probabilities or proportions with an assumed standard deviation of 25% from mean values [43]. The price of sunitinib, ipilimumab and nivolumab were fixed in the PSA due to branded drugs. Cost-effectiveness ac-ceptability curves were generated to present the prob-abilities of cost-effectiveness.
Table 2Cost (US $) estimates (expected value [range])
Parameters United States United Kingdom China
Price of sunitinib per 50 mg 601.9 (301–601.9)#[28] 145.7 (72.87–145.7)#[35] 275.2 (137.6–275.2)#[21]
Price of ipilimumab per 50 mg 7324 (3662–7324)#[28] 4875 (2438–4875)#[26] 4655 (2328–7324)a #
Price of nivolumab per 100 mg 2670 (1335–2670)# 31 1426 (713.1–1426)#[26] 1362 (680.9–1362)#
Cost of follow-up and monitoring per cycle 422 (348.1–495.8) [30] 75.78 (48.32–103.2) [35] 6.13 (4.9–8.58) [21]
Cost of second-line active treatment per patient 27,936 (26,429–29,443) [32] 15,012 (14,793–15,231) [35] 21,081 (11,927–26,628) [21]
Cost of BSC per cycle 1213 (987–1438) [31] 88.23 (70.53–105.9) [35] 52.53 (49.1–69.21) [39]
Cost of terminal care per patient 10,713 (8570–12,856) [24,32] 10,366 (8566–12,849) [19] 1893 (1564–2346) [45]
Cost of managing AEs (grade≥3) per event
Fatigue 139 (1.06–2018) [32–34] 483.6 (0–967.2) [38] 110.3 (82.72–137.9) [21]
Hypertension 201.9 (1.08–6533) [32–34] 27.3 (0–54.6) [38] 12.35 (9.26–15.44) [21]
Anemia 4638 (3326–5949) [32–34] 3242 (3097–3388) [38] 508.2 (381.2–635.3) [21]
Palmar–plantar erythrodysesthesia 118.8 (3.43–1748) [32–34] 131.3 (98.48–164.1) [19] 15.21 (8.85–21.57) [40]
Thrombocytopenia 4014 (1716–9391) [34] 4927 (4764–5091) [38] 3395 (2546–4244) [21]
Cost of drug administration per unit 292 (219–365) [16] 405.3 (304–506.7) [26] 17.65 (13.24–22.06) [21]
a
Results
Base-case analysis
For the advanced RCC patients, nivolumab plus ipilimu-mab instead of sunitinib provided an additional 1.17 life years. Compared with the sunitinib strategy, the mean incremental costs and QALYs of the nivolumab plus ipi-limumab were $ 65,114 and 0.76, $ 94,356 and 0.75 and $3286 and 0.70 for the population in the US, UK and China, respectively. The ICERs for the nivolumab plus ipilimumab versus the sunitinib were $ 85,506 in the US,
$126,499 in the UK and $4682 in China (Table3).
Sensitivity analysis
The one-way sensitivity analyses revealed that the results of the model were more sensitive to body weight be-cause this variable had the greatest impact on ICER, which showed that the nivolumab plus ipilimumab strat-egy would become more favorable as the body weight
decreased (Fig.2). Other considerable influential
param-eters in the US were the prices of sunitinib and nivolu-mab, in the UK were the HR of OS for nivolumab plus ipilimumab versus sunitinib, the median OS time of su-nitinib treatment and the prices of nivolumab, and in China were the prices of nivolumab, sunitinib and ipili-mumab. Model results were robust to changes in other model inputs, including the cost of second-line active treatment, costs and disutilities related to AEs.
Compared to the sunitinib strategy, the cost-effectiveness acceptability curves showed that the nivolumab plus ipili-mumab produced nearly 80.1, 9.2 and 65.2% probabilities of cost-effectiveness when the threshold was equal to $150,000, $65,000 and $27,351 in the US, UK and China, respectively (Fig.3).
Discussion
Reports of a clinical benefit from nivolumab plus ipilimu-mab therapy in a clinical study caused great excitement among both oncologists and patients [12]. However, the widespread use of these agents comes with a sharp increase
in health resource consumption, which is of concern to cli-nicians and administrators [44]. This evaluation first inves-tigated the cost-effectiveness of nivolumab plus ipilimumab for patients with newly diagnosed advanced RCC, and our results are of great significance in high- and middle-income settings. The results suggested that the nivolumab plus ipilimumab therapy produced an additional 0.66 life years and > 0.70 QALYs compared with standard sunitinib treatment with a substantial augment of cost, leading to average incremental cost-effectiveness ratios of $85,880/ QALY in the US, $126,483/QALY in the UK and $9866 /QALY in China. At a willingness-to-pay threshold values of $150,000, $65,000 and $27,351 per QALY gained in the US, UK and China, this main finding indicated that the nivolumab plus ipilimumab strategy was a cost-effective therapeutic approach in the US and China, but not in the UK. The acceptability curve also demonstrated this finding that a majority of certainty was achieved by nivolumab plus ipilimumab at the threshold of $150,000 in the US and $27,351/QALY in China, and a paucity of certainty at the threshold of $65,000/QALY in UK, respectively.
One recent publication reported the results of economic evaluations of nivolumab as second-line therapy for ad-vanced RCC from the payer perspective of the US [16], which presented an ICER of $146,532/QALY versus evero-limus that indicated that nivolumab is cost-effective. How-ever, another economic study found that second-line immunotherapy with pembrolizumab versus chemother-apy for bladder cancer is cost-effective in the US, but not in the UK, Canada and Australia. These results are similar to our findings for the US and UK. The potential reason might be the gaps of the prices of sunitinib, nivolumab and ipilimumab between the US and UK. We noted that the price of sunitinib in the US is about four times that in the UK, and nivolumab and ipilimumab are about two times as much. This gap leaded the incremental cost of nivolumab plus ipilimumab against sunitinib to be higher in UK ($94,356) than in US ($ 65,114), which yielded the unfavorable results in UK and favorable results in US.
Table 3Summary of Cost ($) and Outcome Results in the base-case analysis
Strategy Cost Expected LYs QALYs ICERa Comments
United States
Sunitinib 297,693 3.01 2.04 NA Cost-effective
Nivolumab plus ipilimumab 362,807 4.18 2.80 85,506
United Kingdom
Sunitinib 75,034 3.01 2.02 NA Not cost-effective
Nivolumab plus ipilimumab 169,390 4.18 2.77 126,499
China
Sunitinib 97,846 3.01 1.96 NA Cost-effective
Nivolumab plus ipilimumab 101,132 4.18 2.66 4682
a
Because the drug prices varied across the different regions due to local affordability and market assess scheme, the economic evaluation needs to consider a diversity of health settings for easy transferability among different regions.
The results of one-way sensitivity analysis found that body weight had the greatest impact on the model out-come. One recent study that evaluated the cost-effective-ness of nivolumab versus everolimus in patients with advanced RCC in the US also found that average body weight had the greatest impact on the ICER for nivolumab versus everolimus (base case US $51,714; range US $8863–$94,566) [24]. The potential reason for this is that the dosage of sunitinib treatment is administered regardless of body weight, and the dosage of nivolumab and
ipilimumab need to be adjusted according to the body weight. More dosages of nivolumab and ipilimumab are needed in patients with high body weight, which might in-crease barriers to affordability. We suggest that nivolumab and ipilimumab might be paid for per patient or per treat-ment cycle instead of per vial.
Our analyses have several weaknesses. First, modeling with Weibull and Log-logistic function to project long-term PFS and OS beyond the observational time of the trial is an inevitable limitation of this study. Second, this trial-based study could not wholly track the natural disease course in the real world. This approach could not adequately reflect effectiveness and resource consumption in routine clinical practice. Third, the present study did not solely consider nivolumab monotherapy as second line treatment after the
A
B
C
disease progressed because it is only one of alternatives in the subsequently systemic therapy due to their comparable efficacy [4], whose cost also only had a paucity of impact in sensitivity analyses. Fourth, we did not measure the budget impact of nivolumab plus ipilimumab treatment on society. Wide prescription of these agents might intensively raise the financial burden. Fifth, the costs of grade 1/2 AEs were excluded and the impact of immune-related AEs (irAEs) were did not solely considered due to no evidence indicat-ing the notably difference of managindicat-ing irAEs and non-irAEs, which might underestimate or overestimate the benefits of nivolumab plus ipilimumab. Fortunately, eco-nomic outcomes were not sensitive to all parameters re-lated to AEs. Sixth, due to the absence of head-to-head trials, the current analysis did not include other competing agents, such as pazopanib that is a cost-effective option in
comparison with sunitinib [27, 35,41]. The current study
needs to be updated by including these novel competing al-ternatives. Finally, due to the heterogenicity of payer per-spectives, such as the mixed public and private payer in the US, the finding should be conservatively generalized to other regions. However, because the findings of this evalu-ation reflected the general clinical conditions of managing advanced RCC, it might be a valuable reference for decision-makers.
In conclusion, in patients with advanced RCC in the contexts of the US and China, nivolumab plus ipilimu-mab is likely to be cost-effective in these countries, but not in the UK.
Additional file
Additional file 1:Calibration curve: progression-free and overall survival. Predicted data (dotted line) were plotted along with the observed data from CheckMate 214 trial (solid line). (PDF 38 kb)
Abbreviations
AEs:Adverse events; BSC: Best supportive care; CTLA-4: cytotoxic T lymphocyte–associated protein 4; FDA: Food and Drug Administration; HR: Hazard ratio; ICERs: Incremental cost-effectiveness ratios; mTOR: Mammalian target of rapamycin; PD: Progressed disease; PD-1: Programmed cell death 1; PSA: Probabilistic sensitivity analyses; QALYs: Quality-adjusted life-years; RCC: Renal-cell carcinoma; SAEs: Serious adverse events; UK: United Kingdom; US: United States; VEGFR: Vascular endothelial growth factor receptor
Acknowledgements
No one need to be acknowledged.
Funding
This study was supported by the Fourth Round of the Three-year Action Plan on Public Health Discipline and Talent Program (Evidence-based Public Health and Health Economics, No. 15GWZK0901) from the Shanghai Health Commission.
Availability of data and materials No additional data are available.
Authors’contributions
JS contributed to the conception, design of the primarily model and interpreted the results. BW developed the economic model, performed the analyses and drafted the manuscript. BW and QZ collected and reviewed data. BW, QZ and JS provided clinical input, validated the model assumptions. All authors read and approved the final manuscript.
Ethics approval and consent to participate
This economic analysis was based on a literature review and modeling techniques; this study did not require approval from an Institutional Research Ethics Board.
Consent for publication Not applicable.
Competing interests
None of the authors have anything to declare.
Publisher’s Note
Springer Nature remains neutral with regard to jurisdictional claims in published maps and institutional affiliations.
Author details
1Medical Decision and Economic Group, Department of Pharmacy, South Campus, Ren Ji Hospital, School of Medicine, Shanghai Jiaotong University, Shanghai, China.2Department of Clinical Oncology, Putuo Hospital, Shanghai University of Traditional Chinese Medicine, Shanghai, China.3Department of Urology, Ren Ji Hospital, School of Medicine, Shanghai Jiaotong University, Shanghai, China.
Received: 10 July 2018 Accepted: 31 October 2018
References
1. Global, regional, and national disability-adjusted life-years (DALYs) for 315 diseases and injuries and healthy life expectancy (HALE). 1990–2015: a systematic analysis for the Global Burden of Disease Study 2015.Lancet. 2016;388(10053):1603–58.
2. Fitzmaurice C, Allen C, Barber RM, et al. Global, regional, and National Cancer Incidence, mortality, years of life lost, years lived with disability, and disability-adjusted life-years for 32 Cancer groups, 1990 to 2015: a systematic analysis for the global burden of disease study. Jama Oncol. 2017;3(4):524–48.
3. Bhatt JR, Finelli A. Landmarks in the diagnosis and treatment of renal cell carcinoma. Nat Rev Urol. 2014;11(9):517–25.
4. Amzal B, Fu S, Meng J, Lister J, Karcher H. Cabozantinib versus everolimus, nivolumab, axitinib, sorafenib and best supportive care: a network meta-analysis of progression-free survival and overall survival in second line treatment of advanced renal cell carcinoma. PLoS One. 2017;12(9):e0184423. 5. Sheng X, Chi Z, Cui C, et al. Efficacy and safety of sorafenib versus sunitinib
as first-line treatment in patients with metastatic renal cell carcinoma: largest single-center retrospective analysis. Oncotarget. 2016;7(19):27044–54. 6. Fernandez-Pello S, Hofmann F, Tahbaz R, et al. A systematic review and
meta-analysis comparing the effectiveness and adverse effects of different systemic treatments for non-clear cell renal cell carcinoma. Eur Urol. 2017; 71(3):426–36.
7. Gu W, Zhu Y, Wang H, et al. Prognostic value of components of body composition in patients treated with targeted therapy for advanced renal cell carcinoma: a retrospective case series. PLoS One. 2015;10(2):e0118022. 8. Zhang T, Xie J, Arai S, et al. The efficacy and safety of anti-PD-1/PD-L1
antibodies for treatment of advanced or refractory cancers: a meta-analysis. Oncotarget. 2016;7(45):73068–79.
9. Ribas A, Wolchok JD. Cancer immunotherapy using checkpoint blockade. Science. 2018;359(6382):1350–5.
10. Luke JJ, Ott PA. PD-1 pathway inhibitors: the next generation of immunotherapy for advanced melanoma. Oncotarget. 2015;6(6):3479–92. 11. Bamias A, Escudier B, Sternberg CN, et al. Current clinical practice guidelines
for the treatment of renal cell carcinoma: a systematic review and critical evaluation. Oncologist. 2017;22(6):667–79.
12. Motzer RJ, Tannir NM, McDermott DF, et al. Nivolumab plus Ipilimumab versus Sunitinib in advanced renal-cell carcinoma. New Engl J Med. 2018; 378(14):1277–90.
13. Petrou P. A systematic review of economic evaluations of tyrosine kinase inhibitors of vascular endothelial growth factor receptors, mammalian target of rapamycin inhibitors and programmed death-1 inhibitors in metastatic renal cell cancer. Expert Rev Pharmacoecon Outcomes Res. 2018;18(3):255–65. 14. Elbasha EH, Chhatwal J. Theoretical foundations and practical applications
of within-cycle correction methods. Med Decis Mak. 2016;36(1):115–31.
15. Abdel-Rahman O. Clinical correlates and prognostic value of different metastatic sites in metastatic renal cell carcinoma. Future Oncol. 2017; 13(22):1967–80.
16. Sarfaty M, Leshno M, Gordon N, et al. Cost effectiveness of Nivolumab in advanced renal cell carcinoma. Eur Urol. 2018;73(4):628–34.
17. Xiao J, Sun JF, Wang QQ, Qi X, Yao HY. Health economic evaluation reporting guideline and application status. Zhonghua Yu Fang Yi Xue Za Zhi. 2017;51(3):276–80.
18. Chouaid C, Luciani L, LeLay K, et al. Cost-effectiveness analysis of Afatinib versus Gefitinib for first-line treatment of advanced EGFR-mutated advanced non-small cell lung cancers. J Thorac Oncol. 2017;12(10):1496–502. 19. Edwards SJ, Wakefield V, Cain P, et al. Axitinib, cabozantinib, everolimus,
nivolumab, sunitinib and best supportive care in previously treated renal cell carcinoma: a systematic review and economic evaluation. Health Technol Assess. 2018;22(6):1–278.
20. Remak E, Charbonneau C, Negrier S, Kim ST, Motzer RJ. Economic evaluation of sunitinib malate for the first-line treatment of metastatic renal cell carcinoma. J Clin Oncol. 2008;26(24):3995–4000.
21. Wu B, Dong B, Xu Y, et al. Economic evaluation of first-line treatments for metastatic renal cell carcinoma: a cost-effectiveness analysis in a health resource-limited setting. PLoS One. 2012;7(3):e32530.
22. US Department of Labor. Calculators.https://www.bls.gov/data/inflation_ calculator.htm. Accessed 30 Mar 2018.
23. Tikhonova IA, Huxley N, Snowsill T et al. Economic Analysis of First-Line Treatment with Cetuximab or Panitumumab for RAS Wild-Type Metastatic Colorectal Cancer in England. Pharmacoeconomics. 2018;36(7):837–51. 24. McCrea C, Johal S, Yang S, Doan J. Cost-effectiveness of nivolumab in
patients with advanced renal cell carcinoma treated in the United States. Exp Hematol Oncol. 2018;7:4.
25. Akaza H, Naito S, Ueno N, et al. Real-world use of sunitinib in Japanese patients with advanced renal cell carcinoma: efficacy, safety and biomarker analyses in 1689 consecutive patients. Jpn J Clin Oncol. 2015; 45(6):576–83.
26. Meng Y, Hertel N, Ellis J, et al. The cost-effectiveness of nivolumab monotherapy for the treatment of advanced melanoma patients in England. Eur J Health Econ. 2018;19(8):1163–72.
27. Delea TE, Amdahl J, Diaz J, Nakhaipour HR, Hackshaw MD. Cost-effectiveness of pazopanib versus sunitinib for renal cancer in the United States.J Manag Care Spec Pharm. 2015;21(1):46–54 54a-b.
28. RED BOOK Online. 2017.http://www.micromedexsolutions.com/. Accessed 24 Oct 2017.
29. Hoyle M, Green C, Thompson-Coon J, et al. Cost-effectiveness of temsirolimus for first line treatment of advanced renal cell carcinoma. Value Health. 2010;13(1):61–8.
30. Benedict A, Figlin RA, Sandstrom P, et al. Economic evaluation of new targeted therapies for the first-line treatment of patients with metastatic renal cell carcinoma. BJU Int. 2011;108(5):665–72.
31. Henk HJ, Chen C, Benedict A, Sullivan J, Teitelbaum A. Retrospective claims analysis of best supportive care costs and survival in a US metastatic renal cell population. Clinicoecon Outcomes Res. 2013;5:347–54.
32. Perrin A, Sherman S, Pal S, et al. Lifetime cost of everolimus vs axitinib in patients with advanced renal cell carcinoma who failed prior sunitinib therapy in the US. J Med Econ. 2015;18(3):200–9.
33. Hansen RN, Hackshaw MD, Nagar SP, et al. Health care costs among renal cancer patients using pazopanib and sunitinib. J Manag Care Spec Pharm. 2015;21(1):37–44 44a-d.
34. Liou SY, Stephens JM, Carpiuc KT, et al. Economic burden of haematological adverse effects in cancer patients: a systematic review. Clin Drug Investig. 2007;27(6):381–96.
35. Amdahl J, Diaz J, Sharma A, et al. Cost-effectiveness of pazopanib versus sunitinib for metastatic renal cell carcinoma in the United Kingdom. PLoS One. 2017;12(6):e0175920.
36. Brahmer JR, Lacchetti C, Schneider BJ, et al. Management of Immune-Related Adverse Events in Patients Treated With Immune Checkpoint Inhibitor Therapy: American Society of Clinical Oncology Clinical Practice Guideline. J Clin Oncol. 2018;36(17):1714–68.
37. Isobe T, Hayashi M, Tsubata Y. Clinical practice guidelines for the adverse events in medical oncology. Nihon Rinsho. 2015;73(Suppl 2): 45–50.
combination with interferon-alpha2a compared with sunitinib. Br J Cancer. 2010;102(1):80–6.
39. Jia Q. Cost-effectiveness of durogesic, morphine sulphate controlled-release tablets and oxycontin for advanced cancerous pain. Chinese Journal of Clinical Rational Drug Use. 2016;9(9):63–4.
40. Yu-mei T, Fang-zhan G, Hong-wu Z, et al. The effectiveness of Chinese herbal fumigation for hand-foot syndrome caused by capecitabine. Qinghai Medical Journal. 2017;07:68–70.
41. Amdahl J, Diaz J, Park J, Nakhaipour HR, Delea TE. Cost-effectiveness of pazopanib compared with sunitinib in metastatic renal cell carcinoma in Canada. Curr Oncol. 2016;23(4):e340–54.
42. de Groot S, Redekop WK, Versteegh MM, et al. Health-related quality of life and its determinants in patients with metastatic renal cell carcinoma. Qual Life Res. 2018;27(1):115–24.
43. Briggs AH, Weinstein MC, Fenwick EAL, et al. Model parameter estimation and uncertainty analysis: a report of the ISPOR-SMDM modeling good research practices task force working Group-6. Medical Decision Making: An International Journal of the Society for Medical Decision Making. 2012;32(5):722–32. 44. Tartari F, Santoni M, Burattini L, et al. Economic sustainability of anti-PD-1
agents nivolumab and pembrolizumab in cancer patients: recent insights and future challenges. Cancer Treat Rev. 2016;48:20–4.

![Table 2 Cost (US $) estimates (expected value [range])](https://thumb-us.123doks.com/thumbv2/123dok_us/9487150.1931637/4.595.55.543.99.309/table-cost-us-estimates-expected-value-range.webp)


