http://www.sciencepublishinggroup.com/j/jbed doi: 10.11648/j.jbed.20170204.14
The Effect of Foreign Direct Investment on Economic
Growth in Ghana
Isaac Nketsiah
1, Matthew Quaidoo
21
Directorate of Research, Innovation and Consultancy, University of Cape Coast, Cape Coast, Ghana 2
Department of Economics, University of Cape Coast, Cape Coast, Ghana
Email address:
isaac.nketsiah@ucc.edu.gh (I. Nketsiah), matthew.quaidoo@ucc.edu.gh (M. Quaidoo)
To cite this article:
Isaac Nketsiah, Matthew Quaidoo. The Effect of Foreign Direct Investment on Economic Growth in Ghana. Journal of Business and Economic Development. Vol. 2, No. 4, 2017, pp. 227-232. doi: 10.11648/j.jbed.20170204.14
Received: May 17, 2017; Accepted: June 12, 2017; Published: July 25, 2017
Abstract:
This study examines the relationship between Foreign Direct Investment and Economic Growth as well as some selected macroeconomic variables such as inflation, gross fixed capital formation, trade openness and government spending in Ghana for the period 1983 to 2012 by means of time series analysis. This study employs Least Squares to examine the possible effects among the investigated series. The results suggest that, the impact of foreign direct investment on economic growth in Ghana is significantly positive. These findings will be useful for making appropriate policies by policy makers, investors and the government. Hence, there should be economic as well as foreign policy reforms aimed at attracting more investors to boost the Ghanaian economy.Keywords:
Foreign Direct Investment, Time Series Analysis, Macroeconomic Variables, Least Squares, Economic Growth1. Introduction
Developing economies like Ghana promotes economic growth by means of attracting foreign direct investment (FDI) [7]. FDI can be defined as the ‘‘cross-border investments which are made by an investor with the view to establishing a lasting financial interest in an industry or enterprise and trying to exert a degree of influence on the operations of the enterprise and where the foreign investor holds an interest of at least 10% in equity capital’’ [6]. A study by Lipsey in 2001 concluded that internationalized production comes as a result of foreign direct investment - FDI is the investment that involves some degree of control of the acquired or created firm which is in any other country apart from the investors’ country [13]. FDI and portfolio investment are different because of the involvement in the control of the investment.
FDI is seen as one of the main indicators of economic growth and it is believed to bring about certain benefits to national economies. FDI inflows make investible funds available to developing economies and also make technology transfer possible, with long lasting effect on the economy [3]. Moreover, a large and growing body of literature has showed that FDI plays major role in economic development of a country. For instance, according to the United Nation
Conference on Trade and Development (UNCTAD) investment policy review of Ghana, FDI flows to Sub-Saharan Africa since 1994 have averaged over USD 4.3 billion, more than double the average for 1986-1991 period of USD 1.7 billion a year [20]. In 1997, Nigeria primarily due to its oil reserves topped the list of the largest FDI recipients in the African continent with estimated inflows of USD 1.5 billion [19]. According to GIPC Quarterly Report (2007), foreign equity accounted for about 75% of overall equity finance in Ghana [11]. Ghana’s share of FDI quadrupled from 2005 to $636m in 2006. This, per the 2008 World Investment Report, represents 19.4% of gross fixed capital formation [21].
variation in time from one host country to another [12]. It is worth noting that, the findings of these researchers vary because of different methodologies employed. For example Balasubramanyam, Salisu, and Sapsford (1996) analyzed how FDI affects economic growth in developing economies using cross-sectional data and Ordinary Least Square regression and found that FDI affects economic growth positively especially in host countries that utilize an export promoting strategy [2]. However, the story is different from countries using an import substitution strategy. Hence, the study in reference found out that FDI has a positive effect on economic growth.
Some hold the opinion that the contribution of FDI to economic development is not as obvious as most researchers claim. Nevertheless, there are still some researchers who think that FDI does not contribute positively to the economic growth of the host country. Frimpong and Oteng-Abayie (2006), using time series data covering the period from 1970 to 2005, studied the causal link and the direction of causality between FDI and GDP growth for Ghana for the pre and post structural adjustment programme (SAP) periods and established there was no causality between the two variables [10]. Demirsel et al. (2014) analyzed the relationship between FDI and economic growth in Turkey by using the data covering the time period between 2002 and 2014; and applying unit root test, Johansen cointegration test, and variance decomposition, the study found that there was no relationship between these variables in the long run [4].
The foregoing discussions point to the fact that there has been no consensus on FDI and economic growth nexus. Therefore, the purpose of this paper is to examine the effect of Foreign Direct Investment on Economic Growth in Ghana for the period 1983-2012 using time series data. This study expands the scope since it uses current data available at www.wdi.org.
2. Data Sources and Variable Definitions
The study employed mainly secondary sources of data for its analysis over the period 1983 - 2012. The data were drawn from the World Development Indicators 2012 and Africa Development Indicators 2012- World Bank, and UNCTAD 2012.
The choice of these variables is as a result of their interrelationship and interdependence.
2.1. Net Foreign Direct Investment (FDI) Inflow
As defined earlier, FDI is cross-border investments which are made by an investor with a view to establishing a lasting financial interest in an industry or enterprise and trying to exert a degree of influence on the operation of the enterprise and where the foreign investor holds an interest of at least 10% in equity capital [6]. The net FDI used in this study is the difference between inward and outward FDI in million US dollars. Similarly, foreign direct investment should generally be expected to exert a positive effect on real output, as it is considered as cross-border investments. It is therefore
expected that an increase in the net inflow of FDI will lead to an increase in aggregate output and hence its rate of growth. Thus the coefficient of FDI is expected to be positive (β3 > 0). The annual Net FDI data were extracted from the World Development Indicators 2012, World Bank.
2.2. Gross Fixed Capital Formation
Gross fixed capital formation (GFCF) includes land improvements, plant, machinery, and equipment purchases; and the construction of roads, railways, schools, offices, hospitals, private residential dwellings, and commercial and industrial buildings. Todaro and Smith (2003) defined it as ‘‘increasing a country's stock of real capital’’ [17]. Theoretically, capital (K) measured by gross domestic capital formation as a percentage of GDP is expected to exert a positive impact on the rate of growth of GDP. Consequently, the study expects the coefficient of capital to be positive (β2 > 0). Thus, the higher the rate of investment of capital, the higher the rate of real GDP growth, ceteris paribus. The annual data were extracted from World Development Indicators 2012, World Bank.
2.3. Inflation (Consumer Prices)
Inflation as measured by the consumer price index reflects the annual percentage change in the cost to the average consumer of acquiring a fixed basket of goods and services that may be fixed or change at specified intervals, such as annually. Inflation is expected to proxy the general macroeconomic instability, therefore is expected to be negatively related to growth (β6 < 0).
2.4. GDP (Constant)
GDP is the sum of gross value added by all resident producers in the economy plus any product taxes and minus any subsidies not included in the value of production. It is calculated without making deductions from depreciation of fabricated assets or for depletion and degradation of natural resources. GDP gives us indication about the country’s total income and the total expenditure on its output of goods and services. The annual data were extracted from World Bank (2012) Development Indicators.
2.5. Trade Openness (% of GDP)
2.6. Government Consumption Spending
General government final consumption expenditure is made up of all government current expenditures for the acquisition of goods and services (including compensation of employees). It also consists of expenditures on national defence and security, but excludes government military expenditures that are a part of government capital formation. It is expected that government expenditure will boost the economy, hence, positive effect on real output. Thus, the coefficient of government expenditure is expected to be positive (β5 > 0). The annual data were extracted from World Development Indicators 2012, World Bank.
3. Methodology
In estimating the effect of FDI on growth in many developing countries including Ghana, the basic aggregate production function (APF) which has been extensively used in econometrics studies will be adopted. The APF model has been used byFeder (1983) and Fosu (1990) [8] [9]. Production Functions, especially in the Cobb Douglas form, are widely
used to represent the relationship of an output to inputs. It is worth noting that, the factors of production, given available technology, determine the level of output in an economy. That is:
Yt = AtLtβ1Ktβ2 (1)
Where Y denotes the aggregate production of the economy (real GDP) at time t and K, L, A denotes the amount of capital (gross domestic fixed capital formation), labour stock and total factor productivity (TFP) or productivity term, respectively. β1 and β2 are the output elasticities of labour and
capital, respectively. These values are constants determined by available technology. Output elasticity measures the responsiveness of output to a change in levels of either labour or capital used in production, ceteris paribus.
On the assumption that technology is fixed, any increase in the amount of labour or capital will increase the output in the economy. In this case, A captures the TFP of growth in output not accounted for by increase in labour and capital. Since this study seeks to investigate the effects of FDI on economic growth through changes in TFP, TFP therefore is a function of FDI and other factors. Thus, it is assumed that: A = f (FDI, TRADE, GOV, INF) = FDIβ3TRADEβ4GOVβ5INFβ6 (2) Where, FDI: Net Foreign Direct Investment Inflow
TRADE: Trade liberalization (Trade as percentage of GDP)
GOV: Government Expenditure
INF: Inflation (which is expected to proxy general macroeconomic instability)
Empirical Specification of the model
By: substituting (2) into (1) we obtain;
Y=Lβ1Kβ2FDIβ3TRADEβ4GOVβ5INFβ6 (3) Here, Y refers to economic growth (dependent variable). From (3), the specific empirical model for estimating real GDP growth for Ghana, after taking the natural logs is
InY = β0 + β1InLt + β2InKt + β3InFDIt + β4InTRADEt + β5InGOVt + β6lnINFt + et (4)
Where all the variables are as previously defined except et,
which represents the error term, t, is time and In denotes natural logarithm. Equation (4) shows the long-run equilibrium relationship which is also seen as a log transformation.
4. Empirical Results and Discussion
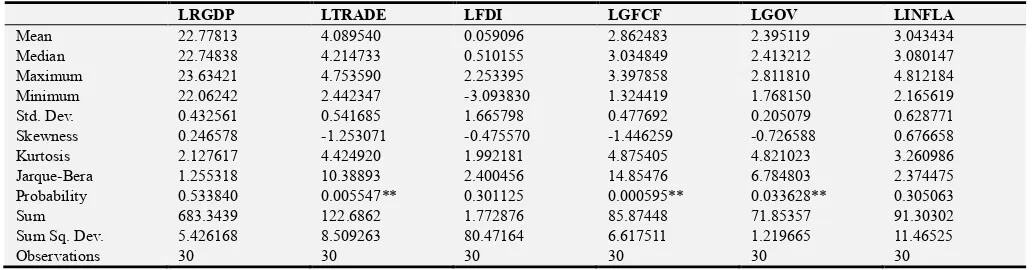
Table 1 presents summary statistics of the variables. Sample mean, standard deviation, skewness and kurtosis, and
the Jacque-Bera statistic and p-value have been reported. The LFDI has a larger standard deviation among all the variables, which supports the general intuition that FDI is highly volatile. The coefficient of skewness is low and negatively skewed with the exception of LRGDP and LINFLA. From the p-values, the null hypothesis of LRGDP, LFDI and LINFLA normally distributed at 5% level of significance cannot be rejected. The standard deviation compared to the mean is low which indicates small coefficient of variation.
Table 1. Descriptive Statistics-Individual Samples.
LRGDP LTRADE LFDI LGFCF LGOV LINFLA
Mean 22.77813 4.089540 0.059096 2.862483 2.395119 3.043434
Median 22.74838 4.214733 0.510155 3.034849 2.413212 3.080147
Maximum 23.63421 4.753590 2.253395 3.397858 2.811810 4.812184
Minimum 22.06242 2.442347 -3.093830 1.324419 1.768150 2.165619
Std. Dev. 0.432561 0.541685 1.665798 0.477692 0.205079 0.628771
Skewness 0.246578 -1.253071 -0.475570 -1.446259 -0.726588 0.676658
Kurtosis 2.127617 4.424920 1.992181 4.875405 4.821023 3.260986
Jarque-Bera 1.255318 10.38893 2.400456 14.85476 6.784803 2.374475
Probability 0.533840 0.005547** 0.301125 0.000595** 0.033628** 0.305063
Sum 683.3439 122.6862 1.772876 85.87448 71.85357 91.30302
Sum Sq. Dev. 5.426168 8.509263 80.47164 6.617511 1.219665 11.46525
Unit Root Test
To ensure that the variables are stationary and that shocks are only temporary and will dissipate and revert to their long run mean, we test for stationarity or unit roots. The Augmented Dickey-Fuller (ADF) (Dickey & Fuller, 1979) and Phillips-Perron (PP) (Phillips & Perron, 1988) tests are used to determine whether there are unit roots or not [5] [16]. The results indicate that all the data were stationary at levels at 5% significant level. Hence, it is possible for Least Square estimation to be employed.Ordinary Least Squares (OLS) is one of the simplest methods of linear regression. Its goal is to closely "fit" a function with the data. It does so by minimizing the sum of squared errors from the data.
The main criteria for a good estimator obtained from a small sample under OLS are unbiasedness; least-variance; efficiency; least mean-square-error (MSE) and sufficiency. The OLS have the least variance within the class of linear unbiased estimators. It may well be that the other non-linear
or biased estimators from other methods have a smaller variance. However, the comparison a of the OLS estimates is restricted traditionally to the class of linear unbiased estimators, which are popular because they are easy to analyze and understand [22]. The unit root results are as follows:
Table 2. ADF and PP Unit Root Test on Variables.
ADF Test PP Test
Levels 1
st
Difference Levels 1st
Difference Conclusion
RGDPY 0.0000 0.0000 0.0000 0.0000 I (0)
TRADE 0.0001 0.0000 0.0001 0.0000 I (0)
GOV 0.0000 0.0001 0.0000 0.0000 I (0)
FDI 0.0002 0.0000 0.0003 0.0000 I (0)
INFL 0.0004 0.0000 0.0000 0.0000 I (0)
GFCF 0.0000 0.0000 0.0000 0.0000 I (0)
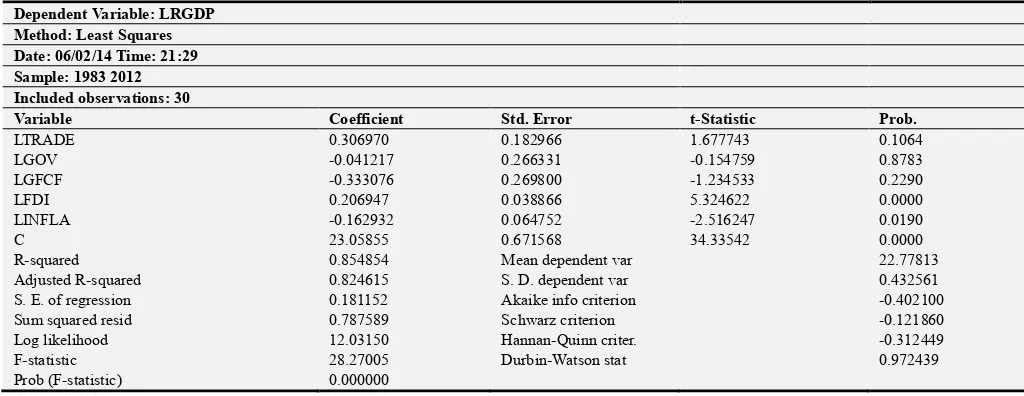
Table 3. The Ordinary Least Squares results are displayed below.
Dependent Variable: LRGDP Method: Least Squares Date: 06/02/14 Time: 21:29 Sample: 1983 2012 Included observations: 30
Variable Coefficient Std. Error t-Statistic Prob.
LTRADE 0.306970 0.182966 1.677743 0.1064
LGOV -0.041217 0.266331 -0.154759 0.8783
LGFCF -0.333076 0.269800 -1.234533 0.2290
LFDI 0.206947 0.038866 5.324622 0.0000
LINFLA -0.162932 0.064752 -2.516247 0.0190
C 23.05855 0.671568 34.33542 0.0000
R-squared 0.854854 Mean dependent var 22.77813
Adjusted R-squared 0.824615 S. D. dependent var 0.432561
S. E. of regression 0.181152 Akaike info criterion -0.402100
Sum squared resid 0.787589 Schwarz criterion -0.121860
Log likelihood 12.03150 Hannan-Quinn criter. -0.312449
F-statistic 28.27005 Durbin-Watson stat 0.972439
Prob (F-statistic) 0.000000
From the table, we can form the long term equation for growth rate (GDPY) in relation to the other economic indicators as below:
GDPYt = 23.0586 + 0.3070TRADEt - 0.0412GOVt – 0.3331GFCFIt + 0.2069FDIt- 0.1629INFLAt (5)
The results show that the constant term literally indicate the coefficient (23.0586) at which trade, government expenditures, gross domestic fixed capital formation, FDI and inflation were zero. The 23.0586 coefficient indicates that holding the explanatory variables constant, growth will increase by 23.0586.
The model is interpreted in units since both the dependent and independent variables are in logs.
It is worth noting that, inflation which is used to capture macroeconomic instability is appropriately signed. That is, inflation is significant at 5% but inversely related to growth since the coefficient is negative. Being significantly negative implies that, if the general price level increases by 1%, growth will fall by 0.1629. Andinuur (2013) corroborated this result, using annual time series data covering the period
1980 to 2011 to explore linkages between inflation, foreign direct investment and economic growth in Ghana [1]. The study found that GDP growth relates negatively with inflation both in the long run and short run, and noted there was no directional causal relationship from inflation to GDP and FDI [1].
Theoretically, capital, that is Gross Fixed Capital Formation (GFCF) is expected to contribute positively to growth of GDP. However, from the results, since the coefficient of capital in the long-run growth equation is negative and insignificant, it implies that in the long-run, an increase in capital has no potential of stimulating growth in Ghana.
that, in the long run, trade openness of Ghana is expected to stimulate growth by 0.3070. This is in line with results obtained by Frimpong and Oteng-Abayie (2006) that, trade openness effect on growth implies that trade liberalization of the economy and export promotion since 1984 has been positive but not significant [10]. On this score, channels such as access to advance technology from abroad, greater access to inputs for production and access to broader market that raise efficiency of domestic production must be encouraged to ensure openness to trade and thus, stimulate growth.
The results also show that government spending is insignificant with negative coefficient of -0.0412. Though insignificant, this implies that, all other things being equal, a Cedi increase in government spending is expected to cause a decrease in economic growth by only 0.0412.
The results suggest that, the impact of foreign direct investment (FDI) on growth is positive. This is substantiated by the positive coefficient of 0.2069. FDI is statistically significant at 1%, implying that an increase in FDI will augment RGDP by 0.2069. This positive result is comparable to that by Balasubramanyam, Salisu, and Sapsford (1996) in a study on how FDI affects economic growth in developing economies, as mentioned earlier [2]. Olofsdotter (1998) also provides a similar analysis, in support of this finding, using cross sectional data and discovers that an increase in the stock of FDI is positively related to growth and that the effect is stronger for host countries with a higher level of institutional capability as measured by the degree of property rights protection and bureaucratic efficiency in the host country [15]. More recent studies on the subject lend credence to this finding. Andinuur (2013), exploring the linkages between inflation, foreign direct investment and economic growth in Ghana using annual time series data covering the period 1980 to 2011, finds that GDP growth
relates positively with foreign direct investment both in the long run and short run [1]. Also, in Kenya, graphical trend analysis of FDI and GDP by Njeru (2013) in a similar study reveals a significant, strong and direct positive relationship between the two variables, computing the Pearson correlation for GDP and FDI inflow data series [14].
5. Conclusion
The study examined the effect of foreign direct investment on economic growth in Ghana, using inflation as proxy to capture macroeconomic instability. The study used 30-year time series data from 1983-2012. The Augmented Dickey-Fuller (ADF) and Philips-Peron (PP) tests - econometric technique were used to determine the stationarity or unit roots of the variables. The conclusion drawn from the study is that foreign direct investment (FDI) has positive significant effect on economic growth in Ghana between the periods 1983-2012.
The results have policy implications. There is the need to properly monitor FDI-utilizing projects. This is because, it is necessary to avoid the misutilization and mismanagement of the foreign capital resources. Again, projects that help SMEs in the consumer goods sector have a relatively high potential for reducing unemployment and poverty, as this sector benefits individuals in both urban and rural areas. Thus, it will be in the right direction to allocate more FDI projects to such sectors.
Consequently, FDI may be very helpful in boosting economic growth especially under aegis of appropriate monetary, fiscal and the trade policies. We should walk the talk, so to speak to ensure that policies to boost FDI are strictly implemented.
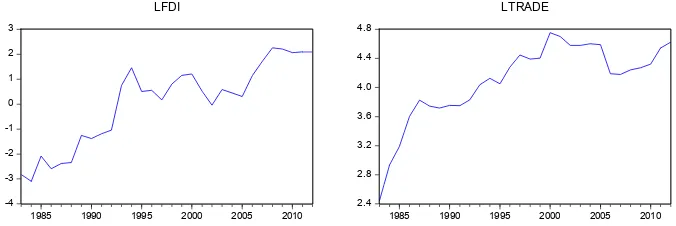
Appendix
22.0 22.4 22.8 23.2 23.6 24.0
1985 1990 1995 2000 2005 2010
LRGDP
2.0 2.5 3.0 3.5 4.0 4.5 5.0
1985 1990 1995 2000 2005 2010
LINFLA
1.6 1.8 2.0 2.2 2.4 2.6 2.8 3.0
1985 1990 1995 2000 2005 2010
LGOV
1.0 1.5 2.0 2.5 3.0 3.5
1985 1990 1995 2000 2005 2010
Figure 1. Graph showing the Ordinary Least Squares results.
References
[1] Andinuur, J. (2013). Inflation, Foreign Direct Investment and Economic Growth in Ghana. University of Ghana. Retrieved from
http://ugspace.ug.edu.gh:8080/handle/123456789/5334. [2] Balasubramanyam, V. N., Salisu, M., & Sapsford, D. (1996).
Foreign direct investment and growth in EP and IS countries.
The Economic Journal, 92–105.
[3] Carkovic, M. V., & Levine, R. (2002). Does foreign direct investment accelerate economic growth? Retrieved from https://papers.ssrn.com/sol3/papers.cfm?abstract_id=314924. [4] Demirsel, M. T., Adem, Ã., Mucuk, M., & others. (2014). The
Effect Of Foreign Direct Investment On Economic Growth: The Case Of Turkey. In Proceedings of International Academic Conferences. International Institute of Social and Economic Sciences. Retrieved from
https://ideas.repec.org/p/sek/iacpro/0702081.html.
[5] Dickey, D. A., & Fuller, W. A. (1979). Distribution of the estimators for autoregressive time series with a unit root.
Journal of the American Statistical Association, 74 (366a), 427–431.
[6] Duce, M. (2003). Definitions of foreign direct investment (FDI): A methodological note. Banco de Espana. Retrieved from
https://pdfs.semanticscholar.org/909c/6a2602ca411cda488df5 241750cd3dc881aa.pdf.
[7] Eduardo. F (1998) “How Does Foreign Direct Investment Affect Growth?” Journal of International Economics, Vol. 45, pp. 115-35.
[8] Feder, G. (1983). On exports and economic growth. Journal of Development Economics, 12 (1–2), 59–73.
[9] Fosu, A. K. (1990). Exports and economic growth: the African case. World Development, 18 (6), 831–835.
[10] Frimpong, J. M., & Oteng-Abayie, E. F. (2006). Bivariate causality analysis between FDI inflows and economic growth in Ghana. Retrieved from
https://mpra.ub.uni-muenchen.de/351/.
[11] GIPC (2007), GIPC Quarterly Report, January 2007, Accra; Ghana Investment Promotion Centre. University of Minnesota Department of finance ‘working paper’ Online
www.ssrn.com.
[12] Lall S. (2002) FDI and development: research issues in the emerging context. Edited by Bora B. (2002) Foreign Direct Investment Research Issues. Routledge London, New York. [13] Lipsey, R. E. (2001). Foreign direct investment and the
operations of multinational firms: concepts, history, and data. National bureau of economic research. Retrieved from http://www.nber.org/papers/w8665.
[14] Nketsiah, I. and Ameyibor, J. (2017) ‘‘Determining the relationship between stock returns and inflation – evidence from the Ghana Stock Exchange’’. Research Journal of Economics & Business Studies, 6 (9), 11-17
[15] Njeru, B. N. (2013). The impact of foreign direct investment on economic growth in Kenya. University of Nairobi. Retrieved from
http://erepository.uonbi.ac.ke/handle/11295/58592.
[16] Olofsdotter, K. (1998). Foreign direct investment, country capabilities and economic growth. Review of World Economics, 134 (3), 534–547.
[17] Phillips, P. C., & Perron, P. (1988). Testing for a unit root in time series regression. Biometrika, 335–346.
[18] Todaro, M., & Smith, S. (2003). Development economics.
Pearson Education.
[19] Townsend I. (2003). ‘‘Does Foreign direct Investment accelerate economic growth in less developed countries?’’ (online).www.stolaf.edu/people/tjf/townsend_thesis.
[20] UNCTAD (2000). World Investment Report 2000. New York: United Nations.
[21] UNCTAD (2002). World Investment Report 2002. Geneva: UNCTAD.
[22] UNCTAD (2008). World Investment Report 2008. New York: United Nations.
[23] Wonnacott, R. J., & Wonnacott, T. H. (1970). Econometrics. New York: Wiley.
[24] WorldBank (2012). World Development Indicators 2012.
Washington: The World Bank. -4
-3 -2 -1 0 1 2 3
1985 1990 1995 2000 2005 2010
LFDI
2.4 2.8 3.2 3.6 4.0 4.4 4.8
1985 1990 1995 2000 2005 2010