ISSN: 2146-4138 www.econjournals.com
Inflation and Corruption Relationship: Evidence from Panel Data in
Developed and Developing Countries
Haşim Akça
Çukurova University, Faculty of Economic and Administrative Sciences, Department of Finance, Adana, Turkey. Email: [email protected]
Ahmet Yilmaz Ata
Gaziantep University, Faculty of Economic and Administrative Sciences, Department of Economics, Gaziantep, Turkey. Email: [email protected]
Coşkun Karaca
Cumhuriyet University, Faculty of Economic and Administrative Sciences, Department of Finance, Erzurum, Turkey. Email: [email protected]
ABSTRACT: Corruption, which is defined as the illegal and benefit-oriented usage of public power, is a fact that has an impact on the macro-economic performance of economy in the scope of cause and effect. Within this framework, there is a strong cause and effect interaction between inflation, an important economic parameter, and corruption. Inflation is defined as not only a financial factor results in corruption but also an economic problem results from corruption. With this particular study, the relationship between inflation and corruption was tried to be tested one-way. In this context, the impact of inflation, growth, trade gap, the quality of legislation, the efficacy of government, political stability and responsibility variables on corruption was tested through panel data method concerning to the 2002-2010 period of totally 97 countries from three different income-level group. It was found as a result of the empirical data that the inflation has a statistically significant and positive effect on corruption in all these 97 countries from three different income-level groups.
Keywords: Inflation; Corruption; Panel Data JEL Classifications: D02; D40; D72; D73; D82
1. Introduction
The case of corruption, which is defined as “the misuse of public power for private purposes” (Gray and Kaufman, 1998: 7; Rose-Ackerman, 1999: 91; Bardhan, 1997: 1321; Klitgaard, 1988: 23; Lambsdorff, 2007: 16), is a versatile concept which is in various forms and functions and which has many reasons and results (Aidt, 2003: 632).
Quite a few economic, political and social dynamics can be reasons for the corruption activities to appear. However, the dynamics that result in corruption can be shown in a simple model as follows (Klitgaard, 1998: 75):
In this equation, states the level of corruption; states the power of monopoly; the judicial discretion and states accountability. Hereunder; the level of corruption is defined by the power of monopoly, the judicial discretion and accountability. While having the power of monopoly and judicial discretion increase the level of corruption, the accountability decreases it. The power of monopoly and judicial discretion is more commonly seen in economies in which public interventions are much. Accordingly, it can be said that corruption is more prominent in societies which are headed by interfering governmental structures although it is seen more or less in all economies depending on the factors peculiar to the countries.
also dealt with as an economic fact due to its effects on social welfare and development (Andving et al., 2000: 9; Luo, 2004:121).
The subject of corruption was under investigation of sociology, political science, history, public administration and the science of law until 1980s inclusively. The economic analysis of corruption began by 1980s and later it provided inspiration for more extensive studies. (Abed and Gupta, 2002:3). In these studies, especially the economic results of corruption were focused on, but economic reasons of corruption were also studied.
Although there were results different from each other, the common point that was reached at the end of the studies about the economic results of corruption was that the effect of corruption on economy was negative. The biggest damage of corruption on economy is the decrease in investments and deceleration in the economic growth and development. Nevertheless, it is another approach that corruption affects the distribution of the existing resources in economy and their effective usage negatively and it causes inflation and inequality in the distribution of income (Al-Marhubi, 2000: 199). The analysis about corruption and its economic reasons showed that many factors are effective on the relationship between these two facts. Inadequacy of capacity that occurs when the supply cannot meet the demand is one of the primary factors which results in corruption (Adaman et al., 2001: 18). The role and the policies of the state, poverty, the structure of tax system, inequality in the distribution of income, commercial limitations, inflation, low wages, and the competition power of economy, index of openness, unrecorded economy and low employment are the other factors which can cause corruption (Akcay, 2001: 44-45).
When both factors result in corruption and the effects of corruption are considered, the terms of “inflation” and “corruption” have become the basis of an important research field. In the literature of economics, there are not enough recent studies on the relationship between corruption and inflation even though plenty of researches were done on corruption and its economic reasons. Particularly, there are scarcely any applied studies on this subject in the literature. Most of these studies are about the effect of corruption on inflation. In this particular study, it was firstly aimed to contribute to the related literature on the “inflation-corruption” topic. In this scope, the effect of inflation on corruption in 97 countries from low, middle and high income levels in the period between 2002 and 2010 will be analyzed through panel data prediction method considering the relationship between the variables of corruption, inflation, growth, and legislation quality, the efficacy of government, political balance and responsibility.
2. The Relationship Between Corruption and Inflation 2.1. Literature Review
Although corruption is a fact that has been seen in nearly all societies since antique ages, the economic reasons and results of corruption could not be investigated empirically because it was difficult to measure. However, the initiator studies about the measurement of corruption and the ability to reach the data sources thanks to the increase in the databases enhanced the number of empirical studies carried out on “corruption-inflation”. These studies were mostly done in order to investigate the relationship between one or several components that constitute the reasons and results and corruption (Ata, 2009: 268).
It is seen that the method which has generally been used in applied studies is multi-country estimates depending on cross-sectional and/or panel data. It is also observed that the corruption perceptions indexes which are calculated by highly reliable international institutions have been used quite often. Within the last quarter century period, one of the research fields in the scope of “the economic analysis of corruption” has been realized about the relationship of “inflation-corruption”.
Even though there are plenty of recent studies on corruption and its economic reasons, the studies which focus on the relationship between inflation and corruption were not at the desired level (Piplica, 2011: 471). In the limited number of these studies, however; it was found out that there is a strong relationship between corruption and inflation. There are various arguments about the direction of this interaction in the literature, though.
While some of the studies expressed that inflation causes corruptions, some of them claimed that this interaction was in the opposite direction, that is, corruptions cause inflation.
corruption index of ICRG was used as the dependent variable in the model. The variable of inflation, import/GDP and the index of political rights were used as independent variables. The researchers reached in their study that the change (the increase) in the rate of inflation caused a positive and statistically significant effect on corruption. That is, some findings which showed that important changes in the raise of prices increased corruption were obtained.
Paldam (2002) dealt with the reasons of corruption in the economic and cultural framework in his study. Paldam investigated the factors that revealed corruption in 100 developed and developing countries in the scope of economic and cultural models by using the corruption perceptions indexes of Transparency International for 1999 and tested these models with least squares method and cross-sectional analysis. Paldam took factors such as economic development, growth, inflation, economic freedoms and unfair distribution of income into the extent of this analysis. Inflation can effect corruption for a short period of time like 5 or 10 years. Hereunder, the increases in inflation raise corruption.
Getz and Volkema (2001) investigated the interaction between corruption and economic and cultural factors through least squares method and cross-sectional analysis. In the end of the study, they included the economic development, the economic ambiguity and the bureaucratic structure as part of economic conditions into the investigation scope of the study. Economic ambiguity is defined as the increase in general level of prices. According to the findings obtained, it was concluded that corruption goes up when the economic ambiguity, in other words, inflation increase.
Ata (2009) handled the factors resulting in corruption in his study in terms of economic and social factors and it was found out that inflation causes corruption by taking the average four-year (2004-2007) values of 25 European Union member countries and analyzing through cross-sectional data analysis method.
Similarly Tosun (2002) analyzed the economic factors resulting in corruption for the 1982-1995 periods of 44 countries through panel data method and he presented that there was a statistically significant and positive relationship between inflation and corruption.
On the other hand, Al-Marhubi (2000), who provided a significant contribution to the literature about the relationship between corruption and inflation, claim that corruption increase inflation. The writer tested the relationship between corruption and inflation in his study in which he used cross-sectional data of 41 countries. The average annual inflation values of 41 countries for the years between 1980 and 1995 were taken as the dependent variable. Corruption indexes prepared by Transparency International and Business International were used as the data about corruptions. In his analysis, the writer found a positive relationship between corruptions and inflation. In other words, high inflation was observed in economies in which corruption was seen intensively (Al-Marhubi, 2000: 201). Similarly, Abed and Davoodi (2002), Smith-Hillman (2007), Samimi et al. (2012), Piplica (2011), Ekpo (1985), Bahmani-Oskooee and Nasir (2002), Oweye and Bendarfdaf (1996) investigated the effect of corruption on general level of prices in their studies and concluded that corruption increased the prices.
Consequently, it can be said that there is a positive relationship between inflation and corruption according to the findings obtained from empirical studies in which corruption was taken as the dependent variable and inflation as the independent variable, or vice versa. These studies were shown in Table 1.
Table 1. Studies on Inflation-Corruption nexus
Corruption Inflation
Braun and Di Tella (2004) Dep.variable -
Paldam (2002) Dep.variable -
Getz and Volkema (2001 Dep.variable -
Ata (2009) Dep.variable -
Tosun (2002) Dep.variable -
Al- Marhubi (2000) - Indep. variable
Abed and Davoodi (2002) - Indep. variable
Samimi et al. (2012) - Indep. variable
Piplica (2011) - Indep. variable
2.2. Theoretical Framework
According to the findings of scientific studies, there is a significant and positive relationship between the change in the inflation rate and corruption. That is, a significant change in prices has an increasing impact on corruption (Braun and Di Tella, 2004: 79). We can talk about many reasons that cause the interaction between inflation and corruption. These reasons can be explained as follows:
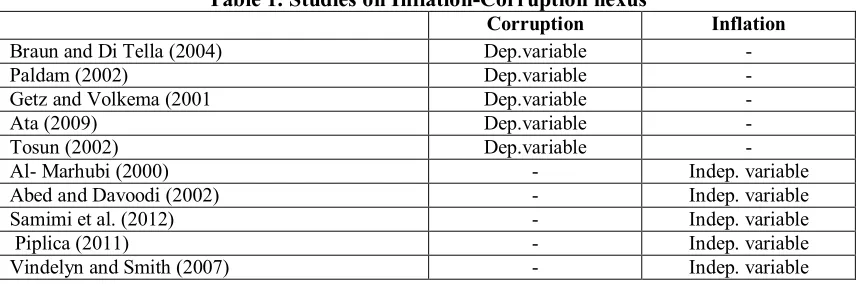
It is commonly believed by the public that inflation, which can be defined as the increase in general level of prices due to the raise in money supply, causes moral erosion (Paldam, 2002: 221) and creates more opportunities for illegal and unethical behaviours such as jugglery or cheating (Braun and Di Tella, 2004: 80). Accordingly, the increase in inflation and fast change also results in corruptions. According to this view, the countries which have low inflation rates should be also the ones which have low corruption rates. The inflation and corruption index data of ten countries which has the lowest corruption rates in 2009 that were presented in Figure 1 shows a characteristic verifying this consideration. According to the data, the countries in which the lowest corruption rates are observed are the ones which also have very low inflation rates (single-digit numbers).
Figure 1. The relationship of Corruption-Inflation (2009)
Source: Transparency International (2009); Corruption Perceptions Index, 2009 and World Economic Forum (2009); Global Competitiveness, Report 2009.
High inflation is an agent which brings about revenue loss of individuals and groups, decay of the income distribution, increase in rent-seeking activities and emerge of ambiguity in economy (Al-Marhubi, 2000: 199; Husted, 1999: 340; Haider et al., 2011: 3).
Within this scope, inflation affects the purchasing power of individuals and groups negatively by lowering the real wage level (Tosun, 2002: 81). Individuals and groups must fulfil their needs although their purchasing power decreases. This might result in corruptions as individuals and groups can look for illegal methods (Al-Marhubi, 2000: 200). Along the same line, inflation that also causes the decrease in the value of the money reduces the real incomes of civil servants employed in the public sector, spoils the distribution of income and supports the large capital owners. The imbalance in the distribution of income naturally stimulates corruption behaviours (Husted, 1999: 342; You and Khagram, 2005: 5; Gupta et al., 1998: 21).
lubberliness of bureaucracy and this leads private sector to illegal behaviours and civil servants who are defeated by inflation to corruption so as to meet their recurring expenditure level. Briefly, high inflation might affect the economic degeneration by determining the usage of public resources, increasing rent seeking and lobbying activities (Rahmani and Yousefi, 2009: 3).
Furthermore, inflation’s increasing rent-seeking activities and effect on spreading corruption are seen less common in developed countries which has political stability and in which the quality of legislation and the rule of law are dominant. Typical characteristics of industrialized countries which have high income can be described with a low level of bureaucratic corruption which is provided by low inflation, strong growth and better governance (Huang and Wei, 2003: 3). On the other hand, less developed countries with low income face with many difficulties such as governance with weak economic performance, high level of corruption, high inflation caused by seigniorage addiction in order to finance the public expenditures and stagnant growth. Distorted macroeconomic policies that these countries follow instigate high inflation by causing large budget and current account deficits (Haider et al., 2011: 8). Weak institutions that are under pressure in a period like which high inflation is seen, property rights that cannot conserve investors and political instability has created a suitable environment for corruption (Samimi et al., 2012: 392).
Ambiguity in economic life that is caused by inflation might result in unfulfilled functions of price1 (Tosun, 2002: 81). The relationship between corruption and inflation has focused most on the function of “the transfer of knowledge” in terms of the functions of price. Accordingly, the price cannot fulfil the function of “the transfer of knowledge” due to the rapid change in inflation and this causes increase in corruptions. The existence of high and changeable inflation raises the ambiguity about the future prices. A situation like this will make the supervision of individual behaviours more costly. (Braun and Di Tella, 2004: 79-80). Hereunder, it is quite difficult and costly to take the prices that salesmen report under control due to the continuous change in an environment like this. In other words, it is meant that public officials can show the invoice amount more than normal and sellers can show it less than normal in environments in which inflation is high and changes rapidly (Tosun, 2002: 82). This provides suitable conditions for illegal and unjustified benefits. Inflation might contribute the spread of corruption by increasing the thoughts and tendencies such as looking for speculative earning, engrossing and hitting the jackpot.
Getz and Volkema (2001: 12) think that the existence of economic depressions caused by inflation, unemployment and recession results in an increase in corruptions because appearance of problems like these in economy is an important factor which generates a loss of trust towards the central authority. In this context, the existence of inflation raises corruptions as it increases the ambiguity in economic life and lack of confidence (Paldam, 2002: 222). The fluctuation of inflation rates limits the prices’ function of “the transfer of knowledge”. In this case, price revisions between time of procurement and of delivery in public procurement costs become a current issue. While a part of revisions are based on legitimate price escalation, another part of them might cause corruptions (Celen, 2007: 94).
Inflation could influence corruptions implicitly, too. The increase of inflation can lower the investments and economic growth and it can make the level of corruption higher due to these indirect effects (Braun and Di Tella, 2004: 80). Invariably, inflation pushes disparity of income distribution in society up and this might result in the enlargement of corruptions. (Paldam, 2002: 222).
Conversely, the relationship between inflation and corruption could cause an effect bilaterally. The increase in corruptions both makes public incomes decrease (capital stocks escape to other countries and this makes the resources which can be taxed and therefore tax incomes decrease) and public expenditures increase (in the economies in which corruption is widespread, the governments
1
carry out more public expenditures as they cannot be used effectively and pursuant) and finally governments appeal more monetizing and all of these can result in inflation (A-Marhubi, 2000: 1999; Çelen, 2007: 112). Moreover, corruption can bring about a raise in general level of prices as an additional cost element (Ekpo, 1985: 315).
As a consequence, it is possible to say that there is a strong relationship between inflation and corruption (Al-Marhubi, 2000: 1999). This can be a two-way relationship, from inflation to corruption and from corruption to inflation. The common belief in the relationship from inflation to corruption is that the increase and rapid change in inflation results in escalation in corruptions.
3. Econometrical Analysis 3.1. Methodology
In this study, it was aimed to investigate the relationship between corruption and inflation, the rule of law, the efficacy of the formation and implementation of government policies, the relationships between the political stability of the governments and corruption through balanced panel data method. The panel data method which has lots of advantages is preferred more and more in both macro and micro level econometric studies (Davidson and MacKinnon, 1999: 296).
Having both cross sectional and time dimensions in panel data set provides some advantages such as controlling the heterogeneity of the predictions, increasing the degree of freedom level and reaching more reliable parameters (Baltagi, 2005: 4-9; Hsiao, 2006: 7). Panel data regression model is shown below in the simplest way (Greene, 2003: 285):
(1)
expresses K (amount) variables that do not include fixed term. In term which shows heterogeneity and individual effects, expresses the observable effects such as race, gender and place or non-observable individual or group specific effects. This model general display of which is presented can be enlarged depending on assumptions made about fixed term, slope coefficient and error term. In the fixed effects model that is used in predicting the equation 1, it is assumed that each section has unobservable and invariant characteristics over time and these characteristics are considered by allowing each section to have different fixed term through dummy variables. In the random effects model, however; it is accepted that the differences between the sections are accidental and each section is allowed to have different fixed terms (Greene, 2003: 293). Panel least squares model (LSV) is a very limited model as it does not take effects that are private for each section into consideration. On the other hand, if you are certain that the neglected fixed effects and random effects are independent, using the panel least squares method will provide more accurate results. For this reason, the homogeneity of the effects belonging to the countries will be tested through Lagrange Multipliers (LM) test which is suggested by Breusch and Pagan (1980) and (Brooks, 2008). Under the dearth hypothesis that shows that the variances of the unit effects are zero, LM test has 1 degree of freedom chi-square distribution (Greene, 2003: 299).
At the end of LM test, two models can be talked about if the dearth hypothesis is refused. These models are named as the fixed effects model when non-observable effects and explanatory variables are related with each other and as random effects model when non-observable effects and explanatory variables are not related with each other. In order to choose the most accurate method in the study, the model is predicted with random effects method first and then it is determined if the error term in the model is related with the independent variables through Hausman test.
3.2. Model and Data Set
In this chapter of the study, the factors which are effective on corruption in countries were investigated as in three different group levels according to their income levels through panel data method. This discrimination that is made by the World Bank, the first group consists of 28 high-income countries with over $ 12275 high-income; the second groups consists of 30 middle-high-income countries with between $ 3975 and $ 12275 income and the third group consists of 39 low-income countries with below $ 1005 income. As analyzing the years before 2002 results in the decrease in the amount of cross sections, the period between 2002 and 2010 was selected as the research period and a balanced panel was established with reference to annual data of this period. The data set which is used in model analysis was obtained from the database of the World Development Indicators (WDI). In the analysis, the panel regression model that will be used based on Braun and Tella (2004) and Al-Marhubi (2000) is as follows:
(2) In the regression equation above, the subscript of expresses the country, the subscript of expresses the corruption rate6 within the time period for the country at time. indicates the inflation rate with the consumer prices, indicates the annual growth rate in Gross Domestic Product. The variable of consists of exogenous variables of
which are thought to be related with the control of corruption in the countries. Summary information and descriptive statistics about the variables are shown in Table 2.
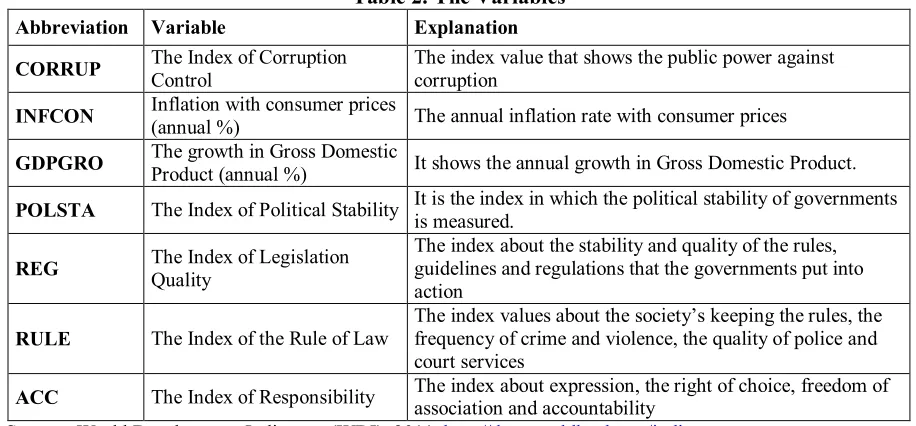
Table 2. The Variables
Abbreviation Variable Explanation
CORRUP The Index of Corruption
Control
The index value that shows the public power against corruption
INFCON Inflation with consumer prices
(annual %) The annual inflation rate with consumer prices
GDPGRO The growth in Gross Domestic
Product (annual %) It shows the annual growth in Gross Domestic Product.
POLSTA The Index of Political Stability It is the index in which the political stability of governments is measured.
REG The Index of Legislation
Quality
The index about the stability and quality of the rules, guidelines and regulations that the governments put into action
RULE The Index of the Rule of Law
The index values about the society’s keeping the rules, the frequency of crime and violence, the quality of police and court services
ACC The Index of Responsibility The index about expression, the right of choice, freedom of association and accountability
Source: World Development Indicators (WDI), 2011. http://data.worldbank.org/indicator
4. Results
Three models based on assumptions about how the fixed term is are used so as to predict the relationship between the variables. These are “pooled regression” (pooled OLS), “fixed effects” and “random effects”, respectively. The first phase in choosing the correct method is carrying out the LM test which tests the homogeneity of the country effects. The null hypothesis in which random effect model turns into pooled regression model is tested if the variance of the unit effects is found as zero through LM test.
H0: Pooled Regression, σ2α = 0 H1: Random Effect, σ
2 α > 0
error terms are not related with independent variables is rejected by Hausman test and the hypothesis that presents that fixed affects are invalid altogether is also rejected in F tests. According to the results of these two tests, fixed effects model provides the most reliable predictions. Table 3 introduces the prediction results that are made by using this approach.
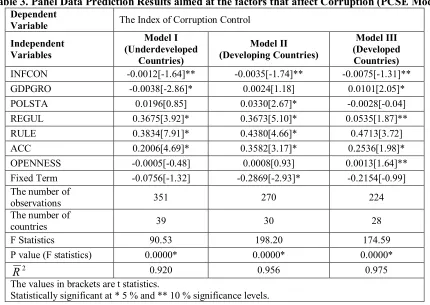
Table 3. Panel Data Prediction Results aimed at the factors that affect Corruption (PCSE Model)
Dependent
Variable The Index of Corruption Control
Independent Variables
Model I (Underdeveloped
Countries)
Model II (Developing Countries)
Model III (Developed
Countries)
INFCON -0.0012[-1.64]** -0.0035[-1.74]** -0.0075[-1.31]**
GDPGRO -0.0038[-2.86]* 0.0024[1.18] 0.0101[2.05]*
POLSTA 0.0196[0.85] 0.0330[2.67]* -0.0028[-0.04]
REGUL 0.3675[3.92]* 0.3673[5.10]* 0.0535[1.87]**
RULE 0.3834[7.91]* 0.4380[4.66]* 0.4713[3.72]
ACC 0.2006[4.69]* 0.3582[3.17]* 0.2536[1.98]*
OPENNESS -0.0005[-0.48] 0.0008[0.93] 0.0013[1.64]**
Fixed Term -0.0756[-1.32] -0.2869[-2.93]* -0.2154[-0.99]
The number of
observations 351 270 224
The number of
countries 39 30 28
F Statistics 90.53 198.20 174.59
P value (F statistics) 0.0000* 0.0000* 0.0000*
2
R
0.920 0.956 0.975The values in brackets are t statistics.
Statistically significant at * 5 % and ** 10 % significance levels.
In the next phase of the analysis, it was investigated if these three models have problems of changing variance and autocorrelation. Woolridge autocorrelation test shows that the null hypothesis which assumes that there is not a first-order autocorrelation in none of the models is rejected. Regression coefficients that are predicted in case of changing variance and autocorrelation are consistent but not effective. Two types of approaches are generally used in the literature in order to get rid of these problems and obtain more reliable results. The first of them is the “Feasible Generalized Least Squares (FGLS)” and the other one is “Panel Corrected Standard Errors (PCSE)” also known as Prais-Winsten approach2. The study of Beck and Katz (1995) presented that PCSE approach provided more reliable results in data sets in which the size of cross-section is bigger than the size of time (For details, see Beck and Katz, 1995, 1996; and Okuyan and Tascı, 2010). This procedure also prevents the loss of observation like in other methods by allowing the usage of first observation in every panel (Gujarati, 1995). The prediction results that are obtained through PCSE method are consistent and the problem of changing variance and autocorrelation also disappears (Tavares, 2001: 30). Since the size of the cross-section (97 countries) is bigger than the size of time (9 years) in the data set of this study, the predictions were made through PCSE method. In the PCSE approach, the deferred value of dependent variable was added to the model so as to purge the model from first-order autocorrelation.
When the prediction results that are obtained from the panel data analysis are studied, it is seen that there is a positive and statistically significant relationship between inflation (INFCON) and corruption in all three groups of countries that are investigated in the scope of the analysis3.
2
For the studies which use FGLS and PCSE methods, see (Tavares, 2001: 30; HeeMin Kim et al., 2006: 38; Rudra, 2005: 713; Hunter and Wu, 2010: 9; Kamps, 2006: 25).
3
Accordingly, an increase in the rate of inflation brings an increase in the rate of corruption together in these three groups of countries which are investigated in the scope of this analysis. Briefly, this obtained result proves the judgment which is very common about the relationship between corruption and inflation in the literature4 and which says: “high inflation is a factor that affects the emergence of the income loss of individuals and groups, the decay in the income distribution, the increase in the number of rent-seeking activities and the ambiguity”.
Furthermore, following relationships between the explanatory variables and the dependent variable in the model were found:
The direction of the relationship between Domestic Income (GDPGRO) and corruption varies in low and high-income countries and the increase in domestic income affects corruption in the positive direction in low-income countries while this effect changes into the negative direction in high income countries5.
Political Stability (POLSTA) which is a bigger problem in low and middle-income countries than in high-income countries also showed its impact on corruption and the prediction results introduced that the effect of political stability on corruption is important. The prediction results obtained from the analysis presented that corruption is lower in high-income countries in which political stability is relatively higher and this result was found as compatible with the one in the literature.
The prediction results that are made for three groups of countries revealed that there is a significant and negative relationship between the quality of regulations (REGUL) and corruption. The value of the coefficient is much higher in low-income countries than in the other groups of countries. Therefore, arrangements for preventing corruption behaviours in these countries provide more effective results than in other countries.
The relationship between the Rule of Law (RULE) and corruption was found as low and statistically significant in low-income countries. Active law systems which will ensure accountability and transparency have the power to control the distortions that are possible in the execution system
The index of responsibility (ACC) about the accountability, freedom of association, freedom of speech and the right of choice point to a statistically significant relationship in all three groups of countries. While this effect is higher in developed countries which have relatively higher per capita income level than other countries, it is lower in underdeveloped and developing countries. The results show that the decrease in corruption will be higher in developed countries in which transparency, accountability and freedoms are relatively higher.
5. Conclusion
Corruption which is described as the deviation from the law or ethical values for personal interests is a fact that has many effects on the economic life in the scope of cause-result relationship. The first negative thing that we can face with during the evaluation in the context of economic costs of corruption is the decrease in investments by creating a negative effect on the investors and the retardation in economic growth and development as a natural result of this. In addition, it is emphasized in many studies in the literature that corruption affects the distribution and the effective usage of the existing resources in the economy negatively and causes inflation and inequality in income distribution. On the other hand, many economic and social factors are considered as the
Therefore, from this point on, the opposite of the coefficient signs is considered during the interpretations about the control index of corruption (CORRUP) that is the dependent variable.
4
In the literature, it is expressed that corruption is high in countries in which inflation is high. See Mumcu (1985); Al-Marhubi (2000); Abed and Davoodi (2002); Bahmani-Oskooee and Nasir (2002); Piplica (2011); Getz ve Volkema (2001); Paldam (2002); Braun ve Di Tella (2004).
5
reasons of corruption. Accordingly, macro-economic factors such as low-wage and employment, poverty, inequality in income distribution, inflation, lack of competitiveness of the economy, insufficient economic growth can provide suitable opportunities for corruption to appear and spread. Inflation which is described as continuous increase in the general level of prices and which is one of the basic macro-economic performances is an important term which we face in the context of the elements that cause corruption and the effects of corruption. It is underlined in the literature about the economic analysis of corruption that these two terms are strongly connected with each other. However, there are many various findings about the direction of this relationship. In this framework, inflation is described as both the reason of corruption and a case that is caused by corruption.
Because of its characteristics such as reducing the level of real wages and minimizing the purchasing power of money, inflation might entail the income loss of individuals and groups and distortion of income distribution. These people who experience the income loss can appeal to different methods to generate revenue so as to sustain their economic life conditions. In this direction, inflation might cause an increase in corruption acts such as bribery, deceptions, jugglery, lobbying and rent-seeking activities. Besides, continuous and sudden raises in the general level of prices might also result in the increase in the ambiguity in economic life. The ambiguities in economic process are the most important factors in the appearance and spread of corruption acts.
Conversely, a reduction in public revenues comes into discussion in economies in which corruption is experienced intensively and this guides the governments to use items of income such as coining money often. The negative situation that is caused by coining money becomes the experience of living an inflationary process. Furthermore, coining money will be resorted again for the necessary public incomes as the public incomes are not used effectively in economies in which corruption acts such as lobbying and rent-seeking activities are seen commonly. Moreover, bribe payments can cause an increase in the general level of prices as an additional cost factor in economies in which corruption is seen.
The results of analysis showed that inflation increased the rent-seeking activities and corruption in the countries as expected. When the effects of the other variables on corruption are studied, policies aimed at developing the basic structure such as economic performance, political stability and legal regulations in the countries will be really effective in preventing corruption.
In the context of cause and result, inflation and corruption are two concepts that are in interaction between each other. In this particular study, the accuracy of this relationship in which inflation is believed to be the reason of corruption, that is, from inflation to corruption, is tested in the economies of 97 countries from different income groups about the period of 2002-2010 through panel data method. As a result of the findings obtained in the study, it was concluded that there is a positive and statistically significant relationship between inflation and corruption in the economies of all 97 countries, twenty eight from high-income level, thirty from middle-income level and thirty-nine from low-income level. Accordingly, an increase in inflation causes an increase in corruption in the countries of these three groups that is investigated in the scope of this analysis. This result verifies the common view in the literature.
Consequently, it is necessary to apply effective and successful policies and methods in order to remove the destruction that corruption, which is described as “the cancer of countries” by former chief of World Bank, Wolfenson, made in societies (World Bank, 2000: 2). The most effective method in struggling with corruption is to remove the reasons of corruption. It should be known that removing the reasons of a problem is the primary solution method. From this perspective, a step which does not aim at removing the reasons might result in new problems rather than providing solution methods. In that case, the reasons of corruptions must be understood well first so as to define the strategies to fight corruption. The main purpose of this study is answering the questions about the factors that cause corruption in terms of “inflation-corruption” instead of putting forward a holistic perspective.
References
Abed, G.T., Davoodi, H.R. (2002), Corruption, Structural Reforms, and Economic Performance in the Transition Economies. G. T. Abed and S. Gupta (Ed.), Governance, Corruption, & Economic Performance, International Monetary Fund, Publication Services, Washington, D.C.
Abed, G.T., Gupta, S. (2002), The Economics of Corruption: An Overview. G.T.Abed and S. Gupta (Ed.) Governance, Corruption & Economic Performance, IMF Press, 119. September,http://www.imf.org/external/pubs/ntf/2002/govern/index.htm
Ackerman, S.R. (1999), Corruption and Government: Causes, Consequences and Reform. Cambridge University Press, Cambridge.
Adaman, F., Çarkoğlu, A., Şenatalar, B. (2001), Causes of Corruption in Turkey Through The Eyes of Household and Recommendations on the Prevention of Corruption. TESEV Publisher, No. 24, Istanbul
Aidt, T.S. (2003), Economic Analysis of Corruption: A Survey. The Economic Journal, 113, 632-652. Akcay, S. (2001), Economic Analysis of Corruption in Developing Countries. Unpublished PhD.
Thesis, Afyon Kocatepe University, Instıtute of Socıal Scıences, Afyon. Al-Marhubi, F.A. (2000), Corruption and Inflation. Economics Letters, 66, 199–202.
Andving, J.C., Fjeldstad, O.H., Sissener, T. (2000), Research on Corruption: A Policy Oriented Survey. Commissioned by NORAD, Final Report, December, Oslo
Ata, A.Y., (2009), Opportunity and Motivation of Corruption in the Framework of Institutional Economics: An Analysis on EU Countries. Economic Research Foundation Publications, Istanbul.
Bahmani-Oskooee, M., Nasir, A. (2002), Corruption, Law and Order, Bureaucracy and Real Exchange Rate. Economic Development and Cultural Change.
Baltagi, B.H. (2008), Econometric Analysis of Panel Data, Fourth Edition, London, John Wiley & Sons Ltd.
Baltagi, B.H. (2005), Econometric Analysis of Panel Data. Third Edition, John Wiley & Sons Ltd., West Sussex, England.
Bardhan, P. (1997), Corruption and Development. Journal of Economic Literatüre, 35, 1320-1346. Beck, N., Katz, J.N., (1995), What To Do (and Not To Do) With Time-Series Cross-Section Data.
American Political Science Review, 89(3), 634-647.
Beck, N., Katz, J.N. (1996), Nuisance vs. Substance: Specifying and Estimating Time-Series Cross-Section Data. Political Analysis, 6(1), 1-36.
Braun, M., Di Tella, R. (2004), Inflation, Inflation Variability, and Corruption, Economics & Politics. 16(1), 77-100.
Breusch, T.S., Pagan, A.R. (1980), The Lagrange Multiplier Test and Its Applications to Model Specification in Econometrics. Review of Economic Studies, 47, 239-253.
Brooks, C. (2008), Introductory Econometrics for Finance. Cambridge University Press, New York. Celen, M. (2007), Economics of Corruption. Istanbul Chamber of Certified Public Accountants
Publications, No:24, Istanbul.
Ekpo, A.H. (1985), Corruption and Prices: A Theoretical Note. Nigerian Journal of Social Studies, 27(3), 305-317.
Getz, K.A., Volkema, R.J. (2001), Culture, Perceived Corruption and Economics: Model of Predictors and Outcomes. Business and Society, 40(1), 7-30.
Gray, C.W., Kaufmann, D. (1998), Corruption and Development. Finance Development, 35(1) March, 7-10.
Gujarati, D. N. (1995), Basic Econometrics. 3rd ed. New York, NY: McGraw-Hill.
Gupta, S., Davoodi, H., Alonso-Terme, R. (1998), Does Corruption Affect Income Inequality and Poverty, IMF Working Paper, WP/98/76.
Haider, A., Ud Din, M., Ghani, E. (2011), Consequences of Political Instability, Governance and Bureaucratic Corruption on Inflation and Growth: The Case of Pakistan. MPRA Paper Series, No. 35584.
Hunter, J., Wu, F. (2010), Multifactor Consumption Based Asset Pricing Models Using the US Stock Market as a Reference: Evidence from a Panel of Developed Economies. Economics and Finance Working Paper Series, Working Paper No. 1017.
Husted, B.W. (1999), Wealth, Culture and Corruption. Journal of International Business Studies, 30(2), 339-360.
Kamps, A. (2006), The Euro as Invoicing Currency In International Trade. Workıng Paper Series, No 665/August.
Kim, H, Powell, G.B., Fording, R.C. (2006), Electoral Systems, Party Systems, and Substantive Representation: An Analysis of Distortion in Western Democracies. Midwest Political Science Association, Chicago.
Klitgaard, R. (1988), Controlling Corruption. University of California Press, England.
Lambsdorff, J.G. (2007), The Institutional Economics of Corruption and Reform. Cambridge University Press.
Luo, Y. (2004), An Organizational Perspectives of Corruption, Management and Organization Review, 1(1), 119-154.
Mauro, P. (1997), The Effects of Corruption on Growth, Investment, and Government Expenditure, in Corruption in the World Economy. (Ed): Kimberly A. Elliott, Washington DC: Institute for International Economics, 83-107.
Okuyan, H.A., Tascı, H.M. (2010), Determinants of Capital Structure: An Application to Turkey's Top 1000 Industrial Company. Journal of BRSA Banking and Financial Markets, 4(1), 105-120. Oweye, O., Ibrahim B. (1996), The Macroeconomic Analysis of The Effects of Corruption on
Economic Growth of Developing Economics. Rivista Internazionale di Science Economiche Commerciali, 43(1), 191-211.
Paldam, M. (2002), The CrossCountry Pattern of Corruption: Economics, Culture and Seesaw Dynamic. European Journal of Political Economy, 18(2), 215-240.
Piplica, D. (2011), Corruption and Inflation In Transition Eu Member Countries. Ekon. Mısao I Praksa Dbk. God XX., BR. 2, 469-506.
Rahmani, T., Yousefi, H. (2009), Corruption, Monetary Policy and Inflation: A Cross Country Examination. Unpublished manuscript.
Rose-Ackerman, S. (1999), Corruption and Government: Causes, Consequences and Reform. Cambridge University Press.
Rudra, N. (2005), Globalization and the Strengthening of Democracy in the Developing World. American Journal of Political Science, 49(4), October, 704–730.
Samimi, A. J., Abedini, M., Abdollahi, M. (2012), Corruption And Inflation Tax in Developing Countries. Middle-East Journal of Scientific Research, 11(3), 391-395.
Smith-Hillman, A.V. (2007), Competition Policy, Inflation and Corruption: Evidence From African Economies. Applied Economics Letters, 14(9), 653-656.
Tavares, A., Antonio, F. (2001), State Constraints and Local Environmental Programs: Solid Waste Management Policy Instrument Choice. Midwest Political Science Association meeting in Chicago, April 19-21.
Tosun, M. U. (2002), A Public Failure Product: Corruption. Cingi, S., Guran, C., and Tosun M. U. (Ed.), Corruption and Efficient State, Ankara Chamber of Commerce Publication, Ankara.
You, J-S., Khagram, S. (2005), A Comparative Study of Ineguality and Corruption. American Sociological Review, 70, 136-157.
World Bank (2000), Anti-Corruption Policies and Program. by Jeff Huther and Anwar Shah, Operations Evaluation Department, Washington D.C.
Appendix 1. Countries Examined in the Analysis
Low-Income Countries
(Below $ 1,005)
Middle-Income Countries
(Between $ 3,975 and $ 12,275)
High-Income Countries
(Over $ 12,275 income)
1 Bangladesh Azerbaijan Germany
2 Benin Bosnia and Herzegovina United States
3 Cote D’Ivor Bulgaria Austuria
4 Chad Algeria Bahamas
5 Indonesia China Barbuda
6 Ethiopia Dominican Republic Belgium
7 Gambia Equator Denmark
8 Ghana El Salvador Finland
9 Haiti Armenia France
10 India Morocco Netherlands
11 Cambodia Philippines Hong Kong
12 Cameroon Guatemala United Kingdom
13 Kenya South Africa Ireland
14 Kyrgyzstan Honduras Spain
15 Comoros Jamaica Israel
16 Congo Kazakhstan Sweden
17 Laos Colombia Swiss
18 Lesotho Macedonia Italy
19 Madagascar Egypt Iceland
20 Malawi Paraguay Japan
21 Mongolia Peru Canada
22 Moldova Romania Cyprus
23 Mauritania Russia Korea
24 Mozambique Serbia Luxembourg
25 Nepal Sri Lanka Macao
26 Nigeria Syria Norway
27 Nicaragua Thailand Singapore
28 Central African Republic Tonga Greece
29 Pakistan Tunusia
30 Rwanda Jordan
31 Senegal
32 Sudan
33 Tajikistan
34 Tanzania
35 Uganda
36 Ukraine
37 Vietnam
38 New Guinea
Appendix 2. Descriptive Statistics
Model I. Countries with Per Capita Income Under $1005
Average Standard
Deviation a Minimum Maximum
Number of Observations CORRUP 1.780477 0.398493 0.181179 4.483994 351
INFCON 8.506762 6.408785 -8.974740 44.39128 351
GDPGRO 5.206244 4.046238 -1.480000 33.62937 351
POLSTA -0.775218 0.853653 -2.704945 1.077283 351
REG -0.655620 0.384124 -1.629678 0.298009 351
RULE -0.784727 0.456542 -1.885425 0.204862 351
ACC -0.636808 0.589924 -1.774103 0.499093 351
Model II. Countries with Per Capita Income Between $3976-$12275
Average Standard
Deviation a Minimum Maximum
Number of Observations CORRUP 3.239396 0.636476 1.680163 6.287126 270
INFCON 5.445863 6.307829 -2.407303 44.96412 270
GDPGRO 3.776700 5.404933 -1.795499 37.99873 270
POLSTA 0.461891 0.637530 -1.409702 1.539648 270
REG 0.420762 0.700499 -1.581180 1.466499 270
RULE 0.315880 0.684800 -1.643012 1.601308 270
ACC 0.485192 0.812803 -1.909686 1.475959 270
Model III. Countries with Per Capita Income Over $12275
Average Standard
Deviation a Minimum Maximum
Number of Observations CORRUP 5.551137 0.660917 3.120842 9.590772 252
INFCON 2.116507 1.845538 -4.479938 12.67819 252
GDPGRO 2.447432 4.206869 -1.125498 26.91328 252
POLSTA 0.784479 0.609185 -1.729574 1.662776 252
REG 1.394526 0.369588 0.478880 1.986506 252
RULE 1.438284 0.442828 0.279476 2.014196 252
ACC 1.144969 0.464893 -0.445205 1.825517 252
Appendix 3. F, LM ve Hausman Tests
Wald F-test 421.99* Fixed effects
Breusch-Pagan 322.10* Random effects
Model I
Hausman 12.17** Fixed effects/Random effects
Wald F-test 367.55* Fixed effects
Breusch-Pagan 177.04* Random effects
Model II
Hausman 16.12* Fixed effects/Random effects
Wald F-test 228.22* Fixed effects
Breusch-Pagan 84.96* Random effects
Model III
Appendix 4. Cross-Correlation Tables
Model I. Countries with Per Capita Income Under $1005
CORRUP INFCON GDPGRO POLSTA REG RULE ACC CORRUP 1
INFCON -0.0318 1
GDPGRO 0.0226 0.0255 1
POLSTA 0.5514 -0.0455 0.0490 1
REG 0.6198 -0.0227 0.0657 0.4863 1
RULE 0.8013 -0.0127 0.1463 0.6304 0.7066 1
ACC 0.5227 -0.0137 -0.0375 0.4905 0.6025 0.6424 1
Model II. Countries with Per Capita Income Between $3976-$12275
CORRUP INFCON GDPGRO POLSTA REG RULE ACC CORRUP 1
INFCON -0.2926 1
GDPGRO -0.2395 -0.0166 1
POLSTA 0.7083 -0.4699 -0.0685 1
REG 0.7697 -0.3903 -0.1919 0.6173 1
RULE 0.8938 -0.3732 -0.2210 0.7773 0.8650 1
ACC 0.7972 -0.2042 -0.2047 0.6757 0.7545 0.7389 1
Model III. Countries with Per Capita Income Over $12275
CORRUP INFCON GDPGRO POLSTA REG RULE ACC CORRUP 1
INFCON -0.1120 1
GDPGRO -0.0982 0.0796 1
POLSTA 0.5778 -0.0649 0.0302 1
REG 0.7956 -0.1477 0.0283 0.4481 1
RULE 0.9265 -0.1170 -0.1110 0.5949 0.8080 1