Distribution and Availability of Sulphur in some
Terai
Soils
under Subtropical Zone of Eastern India
Sankar Ch. Paul
1and Prabir Mukhopadhyay
21Uttar Banga Krishi Viswavidyalaya, Pundibari, CoochBehar, West Bengal, India – 736165
2Department of Soil Science and Agricultural Chemistry, Uttar Banga Krishi Viswavidyalaya, Bihar Agricultural University, Sabour, Bhagalpur, Bihar – 813210, India.
Corresponding author: [email protected]
Paper No. 327 Received: 18 October 2014 Accepted: 12 May 2015 Published: 29 June 2015
Abstract
A study was conducted in some terai soils under subtropical zone of Eastern India considering some soil series and some benchmark sites to evaluate distribution of available sulphur status and important soil attributes on sulphur availability. The total S content was found to vary widely from 191.18 to 530.40 mg kg-1 with an average of 309.21 mg kg-1. The percentage contribution of organic S, sulphate S, adsorbed S, heat soluble S and water soluble S varied from 29.62 to 85.02, 7.85 to 9.94, 0.23 to 9.82, 5.97 to 17.59 and 1.77 to 6.80 per cent to total sulphur in soil samples. Available S was significantly and positively correlated to organic carbon, total N, clay and silt+clay, oxalate-Fe, CBD-Fe and only negative correlated with pH (r = -0.02). Organic S exhibited significant and positive correlations with sulphate, water soluble S, heat soluble S and adsorbed S and played major role in sulphur availability. Significantly positive correlations of sulphate S with water soluble (r = 0.80**), heat soluble (r = 0.70**) and adsorbed S (r = 0.46**) and organic form of S (r = 70**) were found. A significantly positive correlation was observed between water soluble and heat soluble S. Among the soil properties, organic carbon, total N, silt+ clay, CBD-extractable Al and Fe influenced mostly on variability of available S in these soils.
Highlights
• Total sulphur content widely varied and organic fraction mostly dominates in terai soils. • Organic C, N, silt+ clay, CBD-Al and Fe influenced mostly on sulphur availability.
Keywords: Sulphur availability, sulphur distribution, soil physicochemical characteristics
Sulphur is an important part of organic matter and its availability is dependent on its transformation into inorganic forms. It is one of the 17 mineral nutrients which are essential for the growth and development of all plants. Sulphur is also essential for human and animals and is increasingly being recognized as the fourth major plant nutrient after nitrogen, phosphorus and potassium. Available sulphur consisting largely of easily extractable sulphate sulphur is the immediate supplier of sulphate ions to the root of plants. Although organic sulphur is
considered to be an important donor of available sulphur, there are several instances where soils with having 300 mg kg-1 or more organic sulphur,
contained only traces of available (CaCl2-extractable) sulphur. Other than crop uptake, plant available sulphur is subjected to immobilization and leaching as well. In spite of the fact that plants absorb sulphur almost exclusively as sulphate, determination of the sulphate content of a soil is of little use as a measure of sulphate availability. Total sulphur measurement similarly has proved to be of limited usefulness in
SOIL SCIENCE
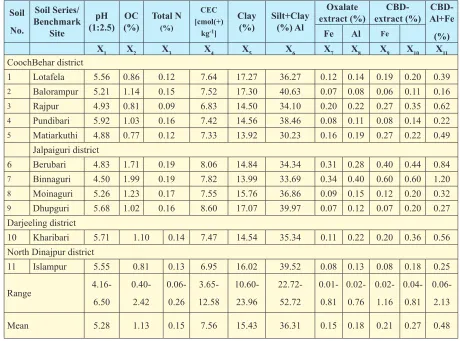
Table 1. Physico-chemical properties (mean value) of experimental soils
Soil No.
Soil Series/ Benchmark
Site
pH
(1:2.5) (%)OC Total N (%)
CEC [cmol(+)
kg-1]
Clay
(%) Silt+Clay (%) Al
Oxalate
extract (%) extract (%)CBD- Al+Fe CBD-(%)
Fe Al Fe
X1 X2 X3 X4 X5 X6 X7 X8 X9 X10 X11
CoochBehar district
1 Lotafela 5.56 0.86 0.12 7.64 17.27 36.27 0.12 0.14 0.19 0.20 0.39
2 Balorampur 5.21 1.14 0.15 7.52 17.30 40.63 0.07 0.08 0.06 0.11 0.16
3 Rajpur 4.93 0.81 0.09 6.83 14.50 34.10 0.20 0.22 0.27 0.35 0.62
4 Pundibari 5.92 1.03 0.16 7.42 14.56 38.46 0.08 0.11 0.08 0.14 0.22
5 Matiarkuthi 4.88 0.77 0.12 7.33 13.92 30.23 0.16 0.19 0.27 0.22 0.49 Jalpaiguri district
6 Berubari 4.83 1.71 0.19 8.06 14.84 34.34 0.31 0.28 0.40 0.44 0.84
7 Binnaguri 4.50 1.99 0.19 7.82 13.99 33.69 0.34 0.40 0.60 0.60 1.20
8 Moinaguri 5.26 1.23 0.17 7.55 15.76 36.86 0.09 0.15 0.12 0.20 0.32
9 Dhupguri 5.68 1.02 0.16 8.60 17.07 39.97 0.07 0.12 0.07 0.20 0.27 Darjeeling district
10 Kharibari 5.71 1.10 0.14 7.47 14.54 35.34 0.11 0.22 0.20 0.36 0.56 North Dinajpur district
11 Islampur 5.55 0.81 0.13 6.95 16.02 39.52 0.08 0.13 0.08 0.18 0.25
Range
4.16-6.50
0.40-2.42
0.06-0.26
3.65-12.58
10.60-23.96
22.72-52.72
0.01-0.81
0.02-0.76
0.02-1.16
0.04-0.81
0.06-2.13
Mean 5.28 1.13 0.15 7.56 15.43 36.31 0.15 0.18 0.21 0.27 0.48
assessing the sulphur availability in soils. Keeping these views, attempts were made to evaluate the available sulphur status and different important soil physico-chemical characteristics to elucidate the influences of these attributes on the availability of sulphur.
Materials and Methods
One hundred and ten (110) representative surface (0–15 cm) soil samples from typical rice and mustard growing fields spread all over the areas representing some terai soil under subtropical zone of Eastern India were collected for this study. The processed soil samples were analysed for physicochemical properties like pH, organic carbon, CEC, total nitrogen by standard methods. Clay and silt (Day
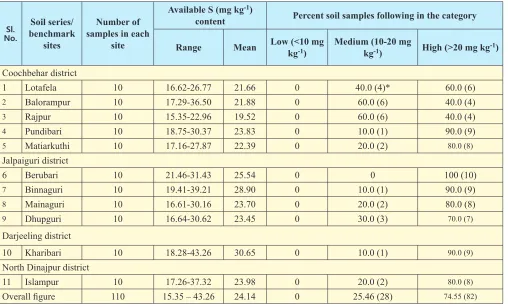
Table 2. Distribution of available sulphur (mg kg-1) in soils according to locations from where samples were collected
Sl. No.
Soil series/ benchmark
sites
Number of samples in each
site
Available S (mg kg-1)
content Percent soil samples following in the category
Range Mean Low (<10 mg kg-1) Medium (10-20 mg kg-1) High (>20 mg kg-1)
Coochbehar district
1 Lotafela 10 16.62-26.77 21.66 0 40.0 (4)* 60.0 (6)
2 Balorampur 10 17.29-36.50 21.88 0 60.0 (6) 40.0 (4)
3 Rajpur 10 15.35-22.96 19.52 0 60.0 (6) 40.0 (4)
4 Pundibari 10 18.75-30.37 23.83 0 10.0 (1) 90.0 (9)
5 Matiarkuthi 10 17.16-27.87 22.39 0 20.0 (2) 80.0 (8)
Jalpaiguri district
6 Berubari 10 21.46-31.43 25.54 0 0 100 (10)
7 Binnaguri 10 19.41-39.21 28.90 0 10.0 (1) 90.0 (9)
8 Mainaguri 10 16.61-30.16 23.70 0 20.0 (2) 80.0 (8)
9 Dhupguri 10 16.64-30.62 23.45 0 30.0 (3) 70.0 (7)
Darjeeling district
10 Kharibari 10 18.28-43.26 30.65 0 10.0 (1) 90.0 (9)
North Dinajpur district
11 Islampur 10 17.26-37.32 23.98 0 20.0 (2) 80.0 (8)
Overall figure 110 15.35 – 43.26 24.14 0 25.46 (28) 74.55 (82)
*figures in the parentheses represent the number of samples in each category of sulphur status in respective cases.
Results and Discussion
Physico-chemical characteristics of soil
The results of some of the important physicochemical characteristics of soils studied are presented in Table 1. A perusal of the data showed that soils varied widely in their pH values ranging between 4.16 and 6.50 with a mean value of 5.28. The organic carbon content of soils also varied widely ranging from 0.40 to 2.42 with an average of 1.13 per cent. CEC of all the samples studied and recorded their values in between 3.65 to 12.58 with a mean of 7.56 cmol(p+)kg-1 soil. In respect of texture, soils showed
marked variation in their clay content ranging from 10.60 to 23.96 with having a mean of 15.43 per cent, indicating that soils, in general, are coarse in texture. Similar was the result in respect of combined
estimation of silt+clay which accounted for 22.72 to 52.72 with average value of 36.31 per cent. The acid ammonium oxalate extractable Al Al) and Fe (ox-Fe) fractions, observed to maintain high variability in soils which ranged from 0.01 to 0.81 and 0.02 to 0.76 with mean of 0.15 and 0.18 per cent respectively. The dithionite extractable Al Al) and Fe (CBD-Fe) fractions also recorded to have high extent of variability in their contents within the limits of 0.02 to 1.16 and 0.04 to 0.81 with respective means of 0.21 and 0.27 per cent. Combined value of CBD-Al and CBD-Fe also has shown to vary widely between 0.06 and 2.13 with its mean of 0.48 per cent.
Available sulphur
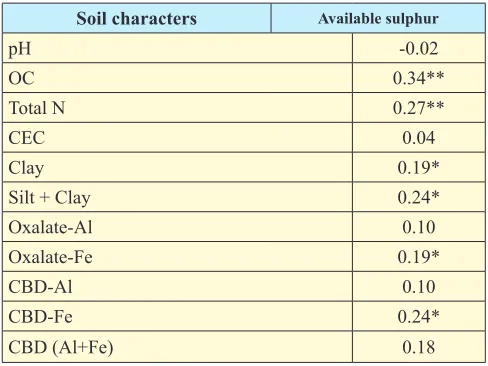
Table 3. Correlations (r–values) between some important physicochemical characteristics and available sulphur
content of soils
Soil characters Available sulphur
pH -0.02
OC 0.34**
Total N 0.27**
CEC 0.04
Clay 0.19*
Silt + Clay 0.24*
Oxalate-Al 0.10
Oxalate-Fe 0.19*
CBD-Al 0.10
CBD-Fe 0.24*
CBD (Al+Fe) 0.18
* and ** : refer to level of significance at 0.05 and 0.01 probability
level respectively.
43.26 with an overall mean value of 24.14 mg kg-1
soil (Table 2). However, about 25 per cent of total soils under study recorded to have available S status under medium category and almost 75 per cent under high category. However, nearly 11 per cent of total soil samples found to contain available sulphur just on the border line of medium to high category. Available S status was noticed (Table 2) high, about 60 per cent of total samples from each of Balorampur and Rajpur soil series under CoochBehar district followed by nearly 40 per cent from Lotafela series under CoochBehar. 30 per cent from Dhupguri benchmark site under Jalpaiguri district were observed to contain available S within the medium range, while remaining samples showed high in available S status. However, 10 to 20 per cent of the total samples under medium S availability status along with rest portions into high range were noted for soils collected from other locations. The observed variations of sulphur availability in soils of different series and some identified locations (benchmark site) tested might be due to the presence of variable proportions of different components of organic matter (Basumatary et al. 2010), soil and crop management practices such as intensity and nature
of crop grown, water use and addition of fertilizers (Patel and Patel 2008; Patel et al. 2011).
Relationship of available sulphur with important soil physicochemical characteristics
The values of correlation co-efficient presented in the Table 3, indicated a significant and positive correlation between available sulphur and organic carbon (r = 0.34**) and it was followed by total N (r = 0.27**) content in soils. Soil texture in terms of estimates of clay (r = 0.19*) and silt+clay (r = 0.24*) also showed significant and positive correlations with available S. Since both S and N are the integral constituents of proteins in the organic matter, these two elements use to maintain a definite N:S ratio in the organic matter. Hence, significant and positive relationship of available S with total N and organic carbon content were imminent (Sharma and Jaggi 2001). Similarly texture as one of the major soil characteristics has decided influence on S status in soils as the amount of clay and silt determines the number of edge adsorption sites for sulphur.
Available S extracted by 0.15% CaCl2 reagent that exhibited good positive correlations with oxalate- as well as CBD- extractable Fe and Al forms and combination of CBD (Al+Fe), but it was significant only with Fe fractions (Oxalate-Fe: r = 0.19*; CBD-Fe: 0.24*). It may be attributed to more retention of SO4-2
ions with increase in the amount of amorphous and crystalline Fe and Al fractions which was favoured under acidic soil environment. This was further confirmed in the present study from the negative relationship obtained between the soil pH (r = -0.02) and native SO4-S content (Basumatary and Das 2012).
Different forms of sulphur in soil
Total sulphur
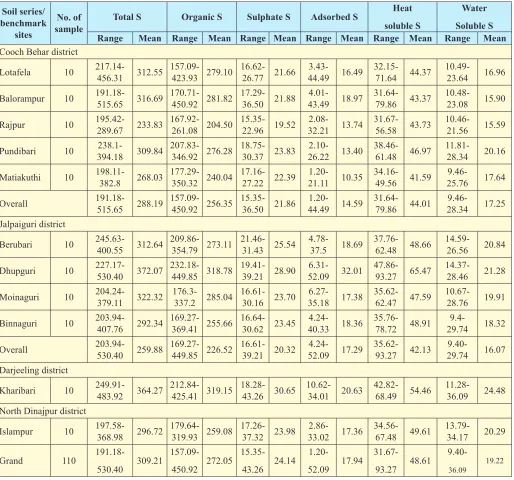
The total S content was found to vary widely from 191.18 to 530.40 mg kg-1 with an average of 309.21
mg kg-1 (Table 4). The lowest amount of total sulphur
Table 4. Different forms of sulphur (mg kg-1) in soils classified according to locations
Soil series/ benchmark
sites
No. of
sample Total S Organic S Sulphate S Adsorbed S
Heat soluble S
Water Soluble S
Range Mean Range Mean Range Mean Range Mean Range Mean Range Mean
Cooch Behar district
Lotafela 10 217.14-456.31 312.55 157.09-423.93 279.10 16.62-26.77 21.66 44.49 16.493.43- 32.15-71.64 44.37 10.49-23.64 16.96
Balorampur 10 191.18-515.65 316.69 170.71-450.92 281.82 17.29-36.50 21.88 43.49 18.974.01- 31.64-79.86 43.37 10.48-23.08 15.90
Rajpur 10 195.42-289.67 233.83 167.92-261.08 204.50 15.35-22.96 19.52 32.21 13.742.08- 31.67-56.58 43.73 10.46-21.56 15.59
Pundibari 10 394.18238.1- 309.84 207.83-346.92 276.28 18.75-30.37 23.83 26.22 13.402.10- 38.46-61.48 46.97 11.81-28.34 20.16
Matiakuthi 10 198.11-382.8 268.03 177.29-350.32 240.04 17.16-27.22 22.39 21.11 10.351.20- 34.16-49.56 41.59 25.769.46- 17.64
Overall 191.18-515.65 288.19 157.09-450.92 256.35 15.35-36.50 21.86 44.49 14.591.20- 31.64-79.86 44.01 28.349.46- 17.25 Jalpaiguri district
Berubari 10 245.63-400.55 312.64 209.86-354.79 273.11 21.46-31.43 25.54 4.78-37.5 18.69 37.76-62.48 48.66 14.59-26.56 20.84
Dhupguri 10 227.17-530.40 372.07 232.18-449.85 318.78 19.41-39.21 28.90 52.09 32.016.31- 47.86-93.27 65.47 14.37-28.46 21.28
Moinaguri 10 204.24-379.11 322.32 176.3-337.2 285.04 16.61-30.16 23.70 35.18 17.386.27- 35.62-62.47 47.59 10.67-28.76 19.91
Binnaguri 10 203.94-407.76 292.34 169.27-369.41 255.66 16.64-30.62 23.45 40.33 18.364.24- 35.76-78.72 48.91 29.749.4- 18.32
Overall 203.94-530.40 259.88 169.27-449.85 226.52 16.61-39.21 20.32 52.09 17.294.24- 35.62-93.27 42.13 29.749.40- 16.07 Darjeeling district
Kharibari 10 249.91-483.92 364.27 212.84-425.41 319.15 18.28-43.26 30.65 10.62-34.01 20.63 42.82-68.49 54.46 11.28-36.09 24.48 North Dinajpur district
Islampur 10 197.58-368.98 296.72 179.64-319.93 259.08 17.26-37.32 23.98 33.02 17.362.86- 34.56-67.48 49.61 13.79-34.17 20.29
Grand 110
191.18-530.40 309.21
157.09-450.92 272.05
15.35-43.26 24.14
1.20-52.09 17.94
31.67-93.27 48.61
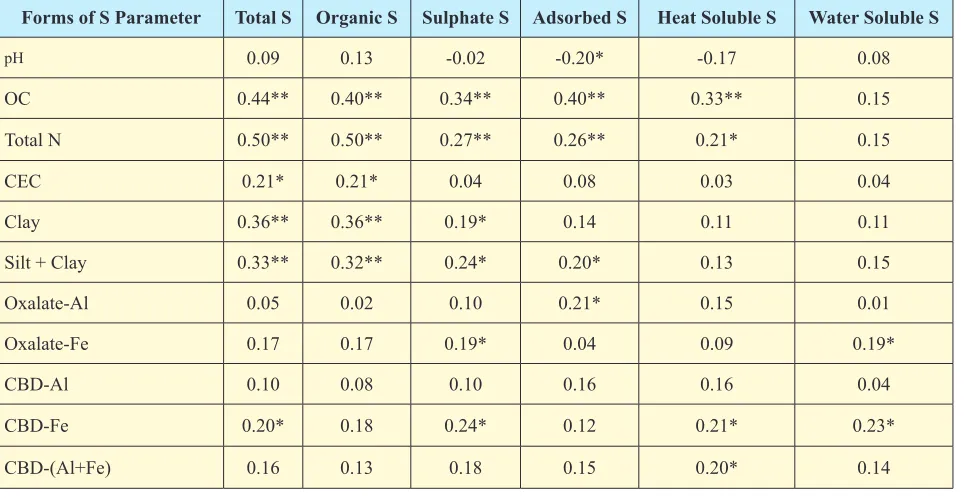
Table 5. Relationship of different forms of sulphur with various salient characteristics of soil
Forms of S Parameter Total S Organic S Sulphate S Adsorbed S Heat Soluble S Water Soluble S
pH 0.09 0.13 -0.02 -0.20* -0.17 0.08
OC 0.44** 0.40** 0.34** 0.40** 0.33** 0.15
Total N 0.50** 0.50** 0.27** 0.26** 0.21* 0.15
CEC 0.21* 0.21* 0.04 0.08 0.03 0.04
Clay 0.36** 0.36** 0.19* 0.14 0.11 0.11
Silt + Clay 0.33** 0.32** 0.24* 0.20* 0.13 0.15
Oxalate-Al 0.05 0.02 0.10 0.21* 0.15 0.01
Oxalate-Fe 0.17 0.17 0.19* 0.04 0.09 0.19*
CBD-Al 0.10 0.08 0.10 0.16 0.16 0.04
CBD-Fe 0.20* 0.18 0.24* 0.12 0.21* 0.23*
CBD-(Al+Fe) 0.16 0.13 0.18 0.15 0.20* 0.14
* and ** : refer to significant level at 0.05 and 0.01 respectively.
Table: 6 Correlations (r-value) amongst different forms of sulphur in experimental soils (n = 110)
Forms of S Total S Organic S Sulphate S Adsorbed S Heat soluble S
Total S
-Organic S 0.99**
-Sulphate S 0.77** 0.70**
-Adsorbed S 0.37** 0.24* 0.46**
-Heat soluble S 0.50** 0.38** 0.70** 0.82**
-Water soluble S 0.61** 0.60** 0.80** -0.03 0.38**
* and **: refer to significance at 0.05 and 0.01 levels respectively.
S is consisted in the organic matter, very low organic carbon (0.40%) content in former as against very high amount (2.42%) in the latter one might have contributed to such spectacular variation in total S content (Jat and Yadav 2006).
Distribution of total S ccording to locations revealed (Table 4) that samples belonged to Rajpur series under Coochbehar district contained total S (195.42 to 289.67) with its mean value of 233.83 mg kg-1,
being the lowest amongst the different locations
considered in this study. While soil samples from Binnaguri series, in general, recorded to have considerably higher total S (227.17 to 530.40) with its mean of 372.07 mg kg-1, which appeared to be the
and contained relative less total S as compared to others. The overall variations of mean total sulphur status in surface layer of soils among the districts may be ascribed mainly to the differences in organic matter content as influenced by nature and intensity of cropping, soil and fertilizer management practices followed and water use and drainage system (Patel et al. 2011; Isitekhale et al. 2013).
Organic sulphur
Organic sulphur was shown to maintain a high variability in the range from 157.07 to 450.92 mg kg-1 with an average value of 272.05 mg kg-1 soil
(Table 4), which accounted for 29.62 to 85.02 per cent of total sulphur of the soil samples with a mean of 88 per cent (Figure 1). It was revealed that samples from Rajpur series of CoochBehar district contained relatively less amount of organic sulphur with a mean of 204.50 mg kg-1, being the lowest among
all the locations studied. While soil samples from Kharibari benchmark site in plains of Darjeeling district was shown to be relatively higher in organic sulphur status with mean organic sulphur content of 319.15 mg kg-1 soil, being the highest among all the
locations. Organic S in soils also found to follow a similar trend to that of total S when its inter-district variations were considered. Organic S formed largest fraction of total S in the soils and had significant positive relationship with total S, organic carbon and clay contents in the soils (Isitekhale et al. 2013).
Sulphate sulphur
Sulphate S status is found to vary considerably from 15.35 to 43.36 with an overall mean value of 24.14 mg kg-1 soil (Table 4) for 110 samples tested in this
study. The percentage contribution of sulphate S to total S also varied from 7.85 to 9.94 per cent with a mean value of 7.8 per cent (Figure 1). Samples from Kharibari benchmark site observed to have relatively higher sulphate S with a mean sulphate S content of 30.65 mg kg-1 soil followed by that of Binnaguri
series (28.90 mg kg-1 soil) under Jalpaiguri district.
Adsorbed sulphur
Adsorbed form of sulphur was found to maintain high variations within the range from 1.20 to 52.09 mg kg-1 soil with a mean value of 17.94 mg kg-1 soil (Table
4). This form of sulphur comprising the smallest fraction of the total S accounted for 0.23 to 9.82 per cent with a mean of 5.8 per cent of total S (Figure 1). The highest amount of adsorbed S obtained in the particular soil sample belonging under Binnaguri series might have been due to the presence of very high total S, organic S and organic matter content ((Isitekhale et al. 2013) along with presence of notably higher Al and Fe oxides (Basumatary and Das, 2012) as compared to those in other locations which collectively contributed to higher retention of sulphate S on adsorptive sites. Adsorbed S status when compared amongst the soil series and benchmark sites, it was observed that majority of soil samples from Binnaguri series of Jalpaiguri district retained very high amounts of sulphate S in adsorbed form as compared to those recorded in any other locations; the mean concentration of which being with 32.01 mg kg-1 soil was regarded as the
highest value amongst the all locations.
Heat soluble sulphur
This form of S, which indicates the mineralizable S varied (Table 4) in soil samples from 31.67 to 93.27 with a mean value of 48.61 mg kg-1. Soils used in
this study shown where higher heat soluble S than water soluble S, sulphate S and adsorbed S, thereby indicating the release of S by wet and dry heating of the soil during the extraction. Higher amount of heat soluble S might be attributed to release of additional amount of S from organic carbon (Ogeh et al. 2012) as well as clay particles on wet and dry heating of soil during extraction (Basumatary and Das, 2012) and . Heating of soil may liberate greater amount of SO4 -2- S covalently bonded to organic matter (Aderichin
Table: 7 Soil characteristics/properties predicting S availability using different indices (n = 110)
Regression equation contribution Cumulative (R2 x 100)
Contribution of individual
soil characters
(R2 x 100)
Total S
Y = 181.62 + 865.82X3 25 25
Y = 75.37 + 786.14X3 +
7.65X5 33 8
Y = 59.27 + 754.99X3 +
7.98X5+ 57.22X10 36 3
Y = -25.78 + 761.36X3 +
7.31X5+ 70.07X10+ 17.24X1 37 1
Y = -55.67 + 497.24X3 + 7.56X5+ 58.94X10+ 23.39X1
+ 31.33X2 38 1
Organic S
Y = 157.36 + 778.31X3 24 24
Y = 59.53 + 704.95X3 +
7.04X5 33 9
Y = 40.59 + 679.91X3 +
7.31X5 + 45.95X10 35 2
Y = -53.33 + 687.42X3 +
6.52X5 + 61.06X10 + 20.25X1 37 2
Y = -32.19 + 699.77X3 + 6.31X5 + 81.19X10 + 17.02X1
– 55.18X7 37 Fraction
Sulphate S
Y= 19.38+ 4.20X2 11.4 11
Y= 11.66+ 4.12X2 + 0.22X6 17 6
Y= 10.79+ 3.43X2 + 0.23X6
+4.24X10 19 2
Y= 11.58+ 3.91X2 + 0.20X6 +
8.46X10 – 6.06X9 21 2
Y= 13.63+ 4.44X2 + 0.21X6 +
8.38X10 – 6.45X9 -0.39X3 22 1
Y= 13.78+ 4.33X2 + 0.20X6 – 404.89X10 – 419.62X9
-0.37X3 – 413.18X11 23 1 Adsorbed S
Y = 6.58 + 10.03X2 16 16
Y = -6.65 + 9.89X2 + 0.37X6 19 3
Y = -5.17 + 16.55X2 + 0.47X6
– 85.9X3 22 3
Y = -3.66 + 18.05X2 + 0.45X6
– 93.99X3 – 7.92X8 23 1
Y = -4.48 + 16.25X2 +
0.45X6 – 80.18X3 – 12.30X8
+ 10.66X7 24 1
Y = 6.02 + 14.75X2 + 0.49X6 – 68.15X3 – 12.37X8 + 8.81X7
- 2.20X1 25 1
Heat soluble S
Y = 38.67 + 8.78X2 11 11
Y = 29.57 + 8.69X2 +0.25X6 13 2
Y = 30.86 + 14.49X2 +0.34X6
– 74.84X3 15 2
Y = 33.97 + 14.8X2 +0.36X6
– 69.52X3 – 0.65X4 15 Fraction Water soluble S
Y = 17.64 + 5.78X10 5 5
Y = 17.67 + 11.93X10 –
8.07X9 10 5
Y = 14.75 + 12.13X10 –
8.82X9 + 20.55X3 12 2
Y = 8.09 + 11.97X10 – 7.33X9
– 19.87X3 + 1.23X1 13 1
X1 = pH X2 = OC X3 = Total N
X4 = CEC X5 = Clay X6 = Silt + Clay
X7 = OX-Al X8 = OX-Fe X9 = CBD-Al
X10 =
CBD-Fe X+ Fe)11 = CBD (Al
content of S in this form in the samples from Binnaguri series alongwith the highest mean of 65.47 mg kg-1 was observed.
Water soluble sulphur
Water soluble S content in experimental soils ranged from 9.40 to 36.09 mg kg-1 with an overall mean
value of 19.22 mg kg-1 soil (Table 4) and constituted
1.77 to 6.80 per cent alongwith its average of 6.2 per cent (Figure 1) of the total S and Kharibari sites of Darjeeling district contained relatively higher. Results further showed that water soluble S status in these soils recorded higher value (mean 19.22 mg kg-1) than the adsorbed S (mean 17.94 mg
kg-1), but it was lower than sulphate S content
The overall low water soluble S status as compared to sulphate sulphur was most likely due to natural leaching of soluble S compounds because of light soil texture and prevalence of high annual rainfall (>2000 mm/annum) areas (Paul et al. 2011; Paul and Mukhopadhyay 2014).
Relationship among different forms of S and with
important soil properties
Amongst the relationships worked out between different forms of S and soil properties (Table 5), total S content in soils was found to be positively and significantly correlated with total N (r = 0.50**), organic carbon (r = 0.44**), finer soil separates measured in terms of clay (r = 0.36**) and silt+clay (0.33**) indicating thereby the presence of most of the S in these soils in association with organic matter (Paul and Mukhopadhyay 2009) in terai soils of West Bengal. Total S content also recorded positive correlation with CEC (r = 0.21*), free iron oxide (CBD-Fe; r = 0.20*) and amorphous and organically bound Fe (oxalate-Fe), but it was not significant in case of oxalate-extractable-Fe compounds.
Correlation studies (Table 5) revealed that organic form of S in these soils exhibited similar relationships to that of total S in respect of the properties viz. total N (r = 0.50**), organic carbon (r = 0.40**), clay (r = 0.36**), silt+clay (r = 0.32**) and CEC (r = 0.21*); but with CBD-Fe, it was not significant.
Sulphate S was significantly and positively correlated with organic carbon (r = 0.34**), Total N (r = 0.27**) clay (r = 0.19*), silt+clay (r = 0.24*), oxalate Fe (r = 0.19) CBD-Fe (r = 0.24*) (Table 5). Sulphate S was negatively correlated with the pH (r = -0.02) of the soil.
Adsorbed form of S was found to correlate significantly and positively with organic carbon (r = 0.40**), total N (r = 0.26**), silt+clay (r = 0.20*) and oxalate-Al (r = 0.21*) content of soils, but with CBD-Al correlation value was merely below the level of significance. While a significant but negative correlation between adsorbed S and soil pH (r = -0.20*) was observed which clearly indicated that
increase in soil pH would result into decrease in the amount of S in this form, attributing it to the reduced adsorption of sulphate in soils and its consequent losses through leaching (Basumatary and Das, 2012). Heat soluble S followed almost a similar trend to that of adsorbed form of S in respect of its relationship with soil properties. It recorded significant positive correlations with organic carbon (r = 0.33**) and total N (r = 0.21*) content of soils. Significant positive correlations were also observed with CBD-Fe (r = 0.21*) and CBD-(Al+CBD-Fe) combined (r = 0.20*). Whereas a negative correlation between heat soluble S and soil pH with its r-value very close to attain the level of significance was noticed.
Water soluble S was found to correlate positively but non-significant with all the soil properties tested in this study, except with CBD-Fe (r = 0.23*) and oxalate-Fe (r = 0.19*) which showed significant. Results of correlations (r-values) among different forms of S have presented in the table 6, it was observed that total S had significant positive relationship with all forms of S studied in this experiment. Khalid et al. (2011) obtained significant positive relationships between plant available S (CaCl2 extractable SO4-2-S)
Influence of soil properties on variability of different forms of sulphur
Results revealed that total N alone contributed to 25 per cent variation in total S in soils (Table 7). Inclusion of clay as another variable improved the predictability by 33 per cent. These two soil parameters together with CBD-Fe, pH and organic carbon collectively accounted for 38 per cent variation of total S in soils. Organic sulphur also followed a similar pattern to that of total sulphur, wherein above said properties, except with soil pH, conjointly contributed to a maximum 37 per cent of its variation in soils. The collective influence of organic carbon, silt+clay, CBD-Fe, CBD-Al, pH and CBD (Al+Fe) content accounted for only 23 per cent variation in available S in soils. Similarly organic carbon content alone caused 16 per cent variation in adsorbed sulphur as against the collective contribution of 25 per cent by silt+clay, total N, oxalate-Fe, oxalate-Al and soil pH. This indicated that the organic carbon and silt+clay were predominant soil properties in influencing the variability of adsorbed sulphur in these soils. In heat soluble form, organic carbon contributed to only 11 per cent of the variation and inclusion of silt+clay and total N as other two variables resulted to improve the predictability only upto 15 per cent. Free iron oxide (CBD-Fe) and CBD-Al accounted for 10 per cent of variation in water soluble S and inclusion of total N into the equation resulted to improve the prediction value by 12 per cent. However, inclusion of total N and pH contributed to explain only 13 per cent of its variation in soils.
Conclusion
Results obtained in the present investigation, thus, revealed that distribution of different S forms in surface layer of soils is greatly influenced by soil properties and inter-relationships amongst themselves. Organic S in soil constitutes the most predominant fraction and occurs as the major native S reserves in soils. Among the soil properties, organic carbon, total N, silt+ clay, CBD-extractable Al and Fe showed to have major influences on variability of available S in these soils.
References
Aderichin PG 1960. Transcript of First International Congress of Soil Science, Madison, US 2, 281.
Basumatary A, Das KN and Borkotoki B 2010. Interrelationship of sulphur with soil properties and its Availability Index in some rapeseed growing lnceptisols of Assam. Journal of the Indian Society of Soil Science58: 394-402.
Basumatary, Anjali and Das KN 2012. Forms of sulphur and
their relationship with soil properties in some soils of North Bank Plain zone of Assam. Agropedology22(1): 43-49.
Day PR 1965. Particle Fractionation and Particle-size Analysis. In: Method of soil Analysis (C. A. Black) Agronomy No. 9, Part 1. American Society of Agronomy Madison. WI, pp. 545-567.
Fox RL, Olson RA and Rhoades HF 1964. Evaluating the sulphur status of soils by plant and soil tests. Soil Science Society of America Proceedings 28: 243-246. http://dx.doi. org/10.2136/sssaj1964.03615995002800020034x
Gomez KA and Gomez AA 1983. Statistical procedures for agricultural research. 2nd Ed. IRRI Los. Banos, Phillipines. Isitekhale HHE, Aboh SI and Oseghale ES 2013. Sulphur
Status Of Some Soils In Edo State, Nigeria. International Journal of Scientific and Technology Research2(6): 91-95. Jat JR and Yadav BL 2006. Different forms of sulphur and their
relationship with properties of Entisols of Jaipur District (Rajasthan) under mustard cultivation. Journal of the Indian Society of Soil Science54, 208-212.
Khalid R, Khan KS, Akram Z, Qureshi R and Gulfraz M 2011. Relationship of Plant Available Sulphur with Soil Characteristics, Rainfall and Yield Levels of Oilseed Crops in Pothwar Pakistan, Pakistan Journal of Botany 43(6): 2929-2935.
Ogeh JS, Uzu F and Obi-Ijeh OD 2012. Distribution of Sulphur in Soils Formed from Different Parent Materials in Southern Nigeria. Nigerian Journal of Basic and Applied Science 20(1): 73-77.
Page AL, Miller RH and Keeney RD 1982. In: Methods of Soil Analysis. Part-II. Chemical and Microbiological Priperties.
Amercian Society of Soil Science Madison, Wisconsin, U. S A.
http://dx.doi.org/10.1002/jpln.19851480319
Patel JC and Patel KC 2008. Profile distribution of different forms of sulphur in prominent soil series of South Gujarat. Asian Journal of Soil Science 3(1): 24-31.
Patel JM, Patel MV, Jadav NJ and Pavaya RP 2011. Distribution of different forms of sulphur in soil of Banaskantha district of Gujarat, An Asian Journal of Soil Science 6(1): 11-16. Paul SC and Mukhopadhyay P 2009. Forms and Status of
Sulphur in some Soils of Terai Region of West Bengal. Environment and Ecology 27(4): 1521-1523.
some terai soils of Eastern India. International Journal of Agriculture, Environment and Biotechnology 6(1): 137-144. doi:10.5958/j.2230-732x.7.1.019.
Paul SC, Ghosh AK, Choudhury A, Singh S and Ray SK 2011. Soil Properties and fertility status of terai soils of West Bengal as influenced by Different Land Use. Environment and Ecology 29(2): 536-541.
Sharma Rakesh K and Jaggi RC 2001. Relationships of forms and availability indices of sulphur with properties of soils of Kangra, Himachal Pradesh. Journal of the Indian Society of Soil Science49(4): 698-702.
Spencer K and Freney JR 1960. A comparison of several procedures for estimating the S status of soils. Australian Journal of Agricultural Research 11: 948-959. http://dx.doi. org/10.1071/ar9600948
Tabatabai MA 1982. In Methods of Soil Analysis (A.L. Page et al. eds), ASA, Madison, Wisconsin, USA.
Williams CH and Steinberg A 1959. Soil sulphur fractions as chemical indices of available sulphur in some Australian soils. Australian Journal of Agricultural Research10: 340-352.