Modeling of the Space-Time MIMO Systems in Dynamic Environment
Józef Pawelec, Krzysztof Kosmowski Pulaski University of Technology
Radom, Military Communication’s Institute Zegrze, Poland
j.pawelec@pr.radom.pl, k.kosmowski@wil.waw.pl
ABSTRACT: The closed-form simple expressions for the bit error rate (BER) in multiple input – multiple output (MIMO) systems operating under flat and quasi-static Rayleigh fading have been derived on the basis of positional statistics. Next, this approach has been extended on the dynamic and crosscorrelated scenarios. The agreement between analysis and simulation results is good.
Keywords: BER Formulae, MIMO Systems, Positional Statistics, Dynamic Fading, Cross-Correlation
Received: 11 March 2012, Revised 9 April 2012, Accepted 14 April 2012
© 2012 DLINE. All rights reserved
1. Introduction
Potential performance benefits and the remarkable capacity promised by MIMO systems attracted a lot of interest in the recent years [1], [2]. However, to reach this goal much specific requirements have to be assured. They concern in between to the channels movement and their crosscorrelation.
Strict modeling of MIMO is extremely complex. For example, Jootar and Proakis use several dozens of equations and the residue theorem to define the probability of error rate for the simplest second order MISO scheme [3]
Pb = 1 2π j
∫
∞ + je
− ∞ + je
1
vΠ 41 (1- jv λi )dv= Res [φz(s) /s at LHP poles]
Alternatively, the Gauss-Chebyshev approximation or other complex methods can be used [5], [5]. In this paper the extra simple closed-form expressions are derived on the basis of positional statistics for a wide class of Alamouti systems [6], [7]. This approach refers to the generally taken quasi-static environment, however, it is further extended to the dynamic scenarios. A comparison of the obtained results with the data of other authors and Monte Carlo simulation shows a good agreement.
The rest of the paper is organized as follows. In section II the fundamental system equations are specified. In section III the positional statistics formulae are given for the selection combining diversity system, SCD. In section IV a comparison between maximum ratio combining, MRCPSK and SCD-DPSK systems is given. Section V, VI and VIII contain the complete set of BER characteristics. Section VIII closes the paper.
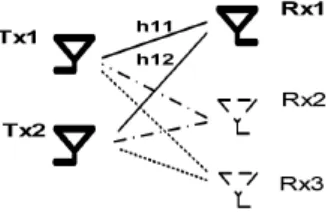
2. System Model
directional and potentially mobile up to the speed of several meters per second. The channel transfer functions hij (t ) are assumed known at the receiver point. They are defined for two moments of time, t, and t +Ts , where Tsis a signal duration time. The received signals are as follows
r1t = h11t S1 + h12t S2 + n1 r2t= h21t S2 + h22t S2 + n2 r1T = h12T S1 - h11T S2 + n3
s s
s
*
r2T = h22T S1 - h21T S2 + n4
s s
s
*
(2)
where S1, S2– symbols of binary signals; n1-4 – AWGN noise.
The changes in the third and fourth row of equation (2) follow from the fact that symbols S1, S2 in t +T period are made conjugated in respect to the period t and S1 is additionally multiplied by (-1) to help the detection.
It is assumed further that all the channels are subjected to the flat fading according to the Jakes model [9]
1/2 E [hi (t ) hi (t + τ )] = σ2R(τ ) where E [.] – mathematical expectation; R(τ ) - auto-correlation
(3)
R(τ ) = J0 (2π FDTsτ ) (3a) where J0 (.) is the zero-order first kind Bessel function (tabularized) and FD - maximum Doppler shift.
The equation (2) can be further transformed into a more convenient matrix form
S1 S2
r1t h11t h12t n1 r1T h12T h11T n2 r2t h21t h22t n3 r2T h22T h21T n4
= + (4)
The decoder uses the following estimates S of the transmitted signals~
S = H H r ⇒ S = H H HS = H H n
⇔r = HS + n
~ ~
(5)
The quasi-static conditions means that the transfer functions h (t) are constant within a code word
h (t) = h ( t + Ts ) (6)
Figure 1. System architecture *
*
* *
*
* * *
*
*
Hence the estimates S ar expressed as follows~
In a real environment off-the diagonal elements H HH are no longer zero and produce an additional noise except for the AWGN. This is one of the important features considered in the present approach.
3. Selection Combining Mode
Let us consider a set of N independent channels, each represented by the same kind of a density distribution function f (Γ ). Hence, using this function one can arrange a new ordered set of channels, m = 1, 2 ,..., N according to f (Γ ) . The first one denoted by m =1 will be assigned by the lowest possible values of Γ , the next one of m = 2 - by the second lowest values of Γ and so on. The general formula for m-th channel is [7]
where f (Γ ) is the density distribution function ddf and F (Γ ) cumulative distribution function, cdf.
Let Γ mean the signal-to-noise power ratio (SNR). In a set of channels subjected to flat and slow Rayleigh fading the ddf for a single channel is then as follows
f (γ ) = γ0 e - γ / γ (8)
where γ0 is a mean value of signal-to-noise power ratio. The cdf -being an integral of ddf - takes then a form
F (γ ) = 1 - e - γ / γ (9)
Putting (8) and (9) into (7) one obtains
(10)
From the viewpoint of bit error rate (BER) the most interesting is the N-th virtual channel characterized by the highest values of
Γ. The equation (10) for m = N takes a form
(11)
Since the changes of γ are assumed slow, the resultant BER for the best channel can be calculated as the error probability P(γ ) for no fading conditions averaged over the density distribution function (11)
S1 S2 =
|h11|2 + |h12|2 + |h21|2 + |h22|2 0
0 |h11|2 + |h12|2 + |h21|2 + |h22|2 ~
(7) fm(Γ | N ) = N ! f (Γ )
( m - 1) ! ( N - m) !x F
m-1(Γ
) [1 - (Γ )]N-m
fm(γ | N, γ0) = N !
( m - 1) ! ( N - m) ! x γ0
-1
e-γ /γ (1- e-γ /γ ) m-1 (e-γ /γ ) N-m
e-γ / γ (1- e-γ / γ ) N -1
N
γ0
fN(γ | γ0) =
PN(γ0) =
∫
P (γ ) fN(γ | γ0) dγThe probability of error for the differentially phase shift keying mode, DPSK, and AWGN is
P (γ ) = 1 2 e
- γ
Putting (11) and (13) into (12) we obtain the general equation 0
(12)
(13)
]
[
[ ]
~0 0 0
0
0 0
∞
0
PN (γ0) =
∫
e - γ e - γ / γ (1- e-γ /γ ) dγ = ∞0 N
2γ0 k
N 2
Σ
(-1)k N - 1 1
γ0 +k + 1 4. DPSK/PSK and MRC/SCD Comparisions
The selection combining diversity (SCD) exploits the best channel to detect the useful signal. The more often used, at least in the theory, is the maximum ratio combining (MRC), which exploits all the channels to detect this signal. Also, binary phase shift keying, BPSK, is often used instead of DPSK. These differences may affect the derived BER characteristics. Let us consider first the consequence of the keying modes, PSK - DPSK. The known Pbformula for Rayleigh PSK channel of Proakis is [9]
It can be shown on the basis of the series theory that this formula approaches eq. (14) for N = 1 and for γ→ ∞ or γ→ 0. The difference is done by the following expression (see Table. I). It is seen that over SNR=10dB eq. (14) ≈ (15)
PP (γ ) = 0.5 γ
γ + 2
∆PP (γ ) = γ
γ + 2
-γ γ + 2
γ 0 | -∞ 1| 0 10 | 10 100 | 20 ∞ | ∞ [W|dB]
∆PP [%] 0 8.47 0.286 0.0035 0
Table 1. Differences between equation (14) and (15)
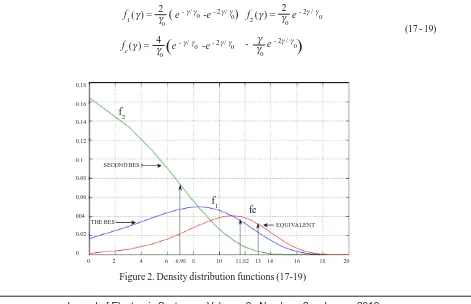
The difference between MRC and SCD will be considered on the basis of the general density distribution function, equation (10). For the MISO system the best, the second best and the equivalent density distribution functions are as follows [10]
f1(γ ) = γ2
0
(
e - γ / γ -e - 2γ / γ)
f2(γ ) = γ20
e - 2γ / γ fe (γ ) = γ4
0
e - γ / γ -e - 2γ / γ - γγ
0
e - 2γ / γ
(15) (14)
(16)
(17 - 19)
0 2 4 6 6.98 8 10 11.82 13 14 16 18 20 0.18
0.16
0.14
0.12
0.1
0.08
0.06
004
0.02
0
THE BES EQUIVALENT
SECOND BES
Figure 2. Density distribution functions (17-19) f1
fe f2
0
(
)
0 0
0
0 0
0 0
k= 0
N-1
(
1 -)
(
)
The last one was obtained via convolution process, z = x + y. The diagrams for all functions are shown in figure2 for γ0=10 dB. We can see that the best channel f1 operates around the mean SNR ≈12 dB, while the second best f2 around SNR ≈ 6 dB. However, the resultant equivalent function resembles the best one. The difference of their means is merely 1.2 dB (13-11.8). For higher-order systems this difference may be a little larger, but still negligible in comparison with the effects of other factors considered below.
5. Quasi - Dynamic Environment
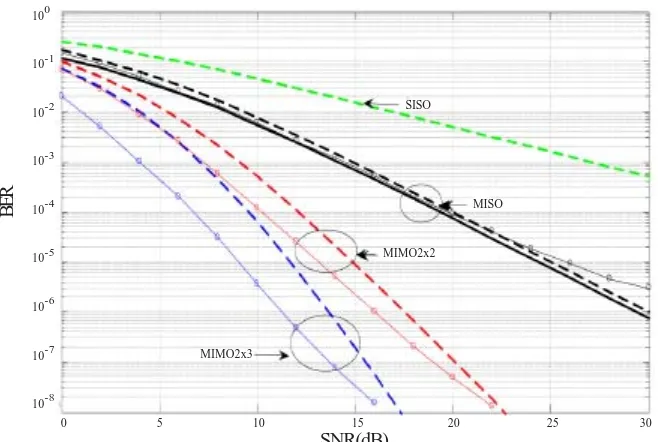
In this section the products of diagonal elements of eq. (4-6) will be taken into account. The rigorous mathematical consideration for MISO system is given in [4]. The simplified model for Monte Carlo simulation procedure are done in [6]. The results are presented in Figure 3.
The solid bold line is due to the Jootar et al. closed-form equation [4]. The dashed lines are due to equation (14). The points around the curves are due to simulations [6]. It is seen that the agreement for MISO scheme is good for all the curves. For other schemes the discrepancies between analytical, equation (14), and simulation data reaches 2-3 dB due to the circumstances discussed in the section IV. An out performance of MIMO systems in comparison with SISO is, however, clearly evident.
SISO
MISO
MIMO2x2
MIMO2x3
0 5 10 15 20 25 30 100
10-1 10-2 10-3
10-4 10-5
10-6 10-7 10-8
Figure 3. BER curves for slightly dynamic scenario, FDTS = 0.01
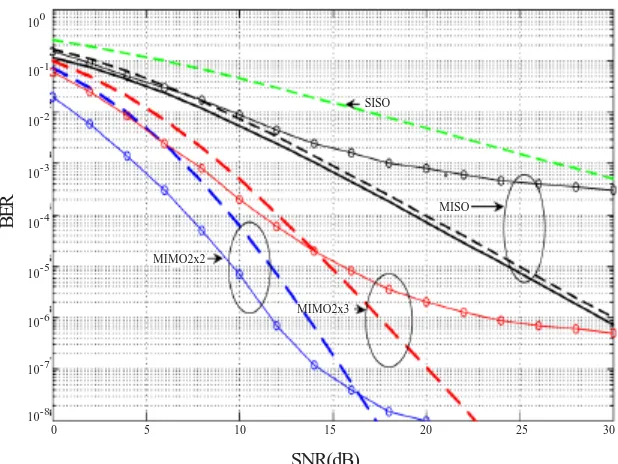
The more dynamic scenario, FDTS=0.05, is illustrated in Figure 4. It is characteristic that BER curves reveal a trend to stop falling down over some SNR. This phenomenon is called the ‘floor effect’ and it is caused by the mechanism of multiplicative interference
γ = γ + ηγ . η
where γ represent the thermal Gaussian noise and η - the product of fading with the speed comparable with a signal rate
η = 1
1 - J0 (2π FDTS ) 7. Cross-Correlation Effects
The PDF of two correlated identically distributed Rayleigh processes is as follows [5]
^ (20)
(21) SNR(dB)
SISO
MISO
MIMO2x2
MIMO2x3 100
10-1 10-2
10-3 10-4 10-5
10-6
10-7
10-8
0 5 10 15 20 25 30
SNR(dB)
BER
Figure 4. BER curves for moderately dynamic scenario, FDTS = .05
SISO
MISO
MIMO2x2
MIMO2x3 100
10-1
10-2
10-3
10-4
10-5
10-6 10-7 10-8
0 5 10 15 20 25 30
SNR(dB)
BER
Figure 5. BER curves for dynamic and cross-correlated environment, FDTS= 0.05, ρ = 0.5
p (γ ) = 1ργ^ exp - γ
(1 + ρ )γ exp
-γ
^
^ ^
Using (12), (13) and (22) the probability of error for the correlated quasi-static DPSK channel for N = 2 can be expressed as follows, Figure 5.
(22)
2
(1 - ρ )γ^
dγ P2 = 1
2
∫
exp(−γ ∝0
^
) 1 2 ργ^
exp - γ
(1 + ρ )γ
- exp - γ (1 - ρ )γ
^ ^
+
8. Conclusion
The simple closed-form BER expressions for the space time MIMO systems subjected to flat and slow Rayleigh fading have been derived. This approach is based on the positional statistics. It is further extended to take into account the mode of channel selection and the dynamic and cross-correlation effects. The comparison of results obtained by other authors - using another diversity modes and/or more complex or simulation methods - is presented. The conclusions are as follows:
1. The gains quoted in the literature, e.g. [4], [7] for quasi static scenarios and flat Rayleigh fading are too optimistic.
2. The real MIMO gain for channels operating in moderately dynamic and cross-correlated environment (FDTS = 0.05, ρ = 0.5) falls down to the level given by the elaborated model, equation (14). For SNR =10 dB this gain is: 8, 21 and 39 dB for MISO, MIMO2x2 and MIMO2x3, resp.
3. Any increase of the normalized Doppler bandwidth FDTS or the cross-correlation coefficient ρ causes substantial degradation of BER characteristics, especially for MISO scheme, which become comparable or even worse than SISO. Hence, the minimal antennae scheme for the dynamic scenario is MIMO2x2.
References
[1] Renzo, M., Haas, H. (2011). Bit Error Probability of Space Shift Keying MIMO over Multiple-Access Independent Fading Channels, IEEE Trans. Vehicular Technology, 8, 3694-3712, September.
[2] Binelo, M., et al., (2001). MIMO Capacity Optimization using Generic Algorithm, IEEE Trans. Vehic. Techn., 5, July.
[3] Jootar et al. (2005). Performance of Alamouti Space-Time Code in Time Varying Channels with Noisy Estimates, IEEE Com. Society/ WCNC.
[4] Vielmon, A., et al. (2004). Performance of Alamouti Transmit Diversity over Time-Varying Rayleigh Fading Channels, IEEE Trans. Wireless Com, 3 (5) 1369-1373.
[5] Simon, M., Alouini, M. (2005). Digital Communications over Fading Channels, John Wiley.
[6] Alamouti, S. (1998). A Simple Transmit Diversity Technique for Wireless Communications, IEEE-JSAC, 16 (8)1451-1458.
[7] Fisz, M. Probability Calculus and Statistics, State Publishing Institute, Warsaw.
[8] Pawelec, J., Kosmowski, K. (2011). A Comparison of Reception Strategies in MIMO Systems, In: Proc. of Conf. Theory, Reliability & Quality of Com, Budapest, 20, April.
[9] Proakis, J. (2011). Digital Communications, MacGraw Hill Book.
[10] Gradstein, I., Ryshyk, I. (2000). Tablicy Integralov, Moscow.
(23)