Correlation Development for Zeta Potential with Storage Time,
Emulsion Concentration and the Stability of the Emulsion on the
Droplet Size Distribution
Ah Pis Yong, Md Aminul Islam, N Hasan, Md. Fazlul Karim
1 A. P. Yong and M. A. Islam are with the Physical and Geological Sciences Programme,
Faculty of Science, Universiti Brunei Darussalam N Hasan is with the Universiti Teknologi Brunei
M. F. Karim is with the Department of Mathematics and Physical Sciences, East West University, Bangladesh
I.
INTRODUCTION
An emulsion is a mixture of two or more fluids which are usually unmixable [7], [10], [15]. Little oil droplets confined within a watery outside stage normally contained in an emulsion of the oil in water (O/W), with every oil droplet encompassed by a defensive covering of emulsifier molecules [17], [18]. The results from physical procedures, for example, coalescence, flocculation, Ostwaldmaturing and gravitation is what causing the instability of the emulsion [19]. Emulsifiers put inside the systems such as small molecule surfactants can help to back off the emulsion-breaking components such as coalescence and creaming. Emulsifiers with surface activity and stabilizers are added to emulsions to prevent phase separation and to avert thermodynamic instability of emulsions to obtain longer stability, which can bring about an expansion in the viscosity of the ceaseless medium [19]. As a rule, emulsifiers are required for balancing out emulsion since they diminish the interfacial firmness between the oil and water stages and a defensive covering is conforming to the droplets which keep them from mixing with each other [14], [23]. Components of proteins are also present in the food emulsions which contribute to different influences to texture and stability [5], [19], [21]. The main emulsifier used in this reviewed study is sodium caseinate (SC) where at neutral pH it can give amazing assurance against droplet mixture, provided that the protein present is sufficient to cover the O/W crossing point totally. SC was used because there are many previous studies done using this emulsifier and here in this study is to investigate
1
Abstract: Two fluids which are incapable of mixing together is known as an emulsion. Emulsifiers and little atomic surfactants are added to the framework in order to investigate the stabilities of the droplet size distribution. The aims of the work are to investigate the stabilities of the droplet size distribution with the influence of emulsifier and the correlation development of zeta potential value on emulsion stability. The results of the zeta potential on emulsion stability have been observed with storage time and emulsifier concentrations. Emulsifier added to the emulsion can affect the emulsion stability. The main type of emulsifier used in this study is sodium caseinate. Other emulsifiers used are such as chitosan, food hydrocolloids such as GA, SPS and SBP and the combination of SC with chitosan. An emulsion containing ß-carotene after homogenization at 140 MPa used in this study for the droplet distribution sizes evaluation. An increase in oil concentration will need higher emulsifier concentration to stabilize the emulsion. The use of high pressure homogenization treatment in the emulsion helps to stabilize the emulsion by reducing the droplet sizes of the emulsion. For the zeta potential quality which has higher values of more than +30 mV and lower than -30 mV was observed to be electrostatically stable. During the investigation, the emulsion which contains SC and food hydrocolloids as an emulsifier was stable as they have higher zeta potential. In addition, the zeta potential for the emulsion which contains sodium caseinate is more stable compared to the emulsion which contains Skipjack Roe Protein Hydrolysate (SRPH) when the emulsion is put away for a specific measure of time.
the results. Otheremulsifiers are such as chitosan, food hydrocolloids such as gum arabic (GA), soybean soluble polysaccharides (SSP) and sugar beet pectin (SBP) and the combination of SC with chitosan as surfactant also used in this study.
The process usually involves in emulsification is by using ultra high pressure homogenization (UHPH). It is stated that UHPH is a non-warm and continuous handling system where it involves the fluid or solid materials which are floating to pass through the valve in a high pressure homogenization [13]. For getting better results from homogenization treatment, it is normal to utilize two-phase homogenization where the first stage is planned to diminish the measure of coarse emulsion and the optional step is to intrude on the group of particles which occurred closely together [13]. Pressure, high shear force, friction, cavitation, turbulence and high speed in the mix with the generation of heat are several factors can affect the UHPH process [13]. While for the droplet sizes of the emulsion, it can be measured by utilizing dynamic light dissipating [1]. The droplet sizes usually measured as the Sauter mean diameter which can be expressed in Equation and the weighted diameter of the volume of the emulsion droplet can be expressed as Equation [11].
It is important to investigate the relationships of the zeta potential with storage time. Zeta potential is explained by determining the electrophoretic movement of distributed elements in an electric field [16]. The electrophoretic movement is the movement of charged particles suspended in a liquid on various media under the influence of an applied electric field. [6] explain that the rheological properties of an emulsion can be affected by the charge on droplets. High potential in emulsions are electrically steady while low zeta-potential observed in an emulsion tend to coagulate or flocculate [6]. It is mentioned that aberrant data about the interfacial organization of emulsions could be calculated through zeta potential estimation [2]. After a charged biopolymer are added to the emulsion, it can be determined whether the biopolymer has adsorbed or not by measuring the droplet charge. To avoid multiple scattering effects, a buffer solution is used to dilute the emulsions. The multiple scattering occurs when the light is scattered by multiple drops before reaching the detector, and therefore, introduces errors in computing the droplet size distribution. At the estimation chamber, the diluted emulsions are then injected and then by calculating the velocity and direction of the droplet that has relocated in the connected electric field, the zeta potential can be found [6].
To be concluded, the objectives of this paper will be listed out in bullet point below: - ● To investigate the impact of emulsion stability on droplet size distribution.
● To calculate the zeta potential value on emulsion steadiness by observing it relationship with storage time
and emulsifier concentrations.
TABLE I
MEANING OF THE SYMBOLS AND UNITS
Symbol Meaning
CM Coconut milk
diameter
volume surface mean diameter
GA Gum arabic
Number of droplets
O/W Oil in water
SC Sodium caseinate
SBP Sugar beet pectin
SRPH
Skipjack Roe Protein Hydrolysate
SSP
Soybean soluble polysaccharides
UHPH
Ultra high pressure homogenization
WPC Whey protein concentrate
t Time (day) Zeta potential (mV)
Unit Meaning
mV milliVolt
h Hour
M Mole
d Day
nm nanometer
% percentage
v/v Volume per volume
w/w Weight per weight
g Gram
mL Milliliter
MPa Megapascal
II.
III.
LIST
OF
EQUATION
IV.
RESULTS
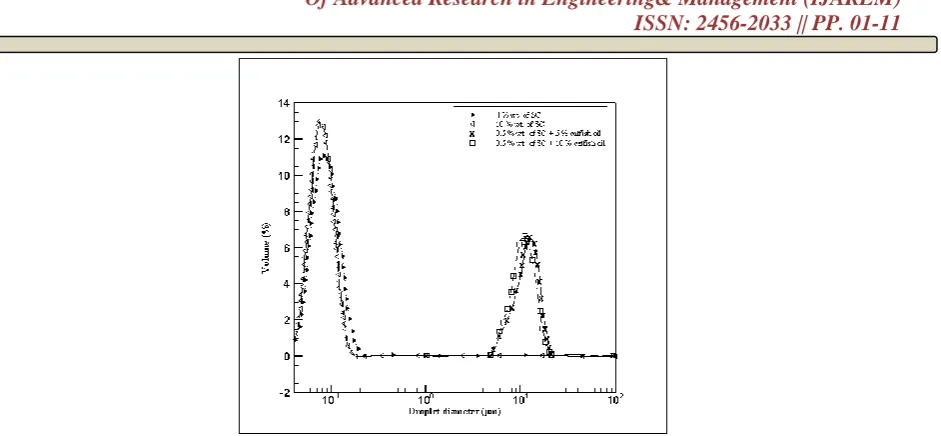
From Fig.1 shows the volume size distribution (volume in percentage) with the droplet sizes on
a logscale. Since the value for the droplet sizes arevary widely, the log scale is used in this graph. The impact of the concentration of SC on the dispersion size of an emulsion containing ß-carotene after homogenization at 140 MPais shown in Fig.1.
Fig.1Volume Size Distribution Against Droplet Diameter for Different Concentration of SC (0.1, 0.25, 1.0 and 2.0 wt. % of SC). and SC with Mixtures of Catfish Oil [8], [12].
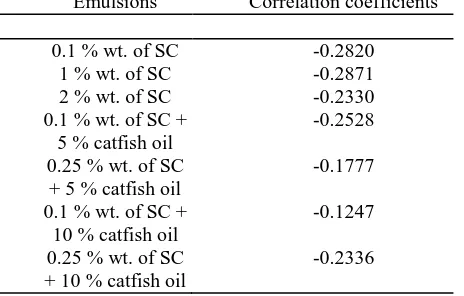
THE CORRELATION COEFFICIENTS VALUES FOR THE EMULSION SHOWN IN FIGURE 1 [7], [8].
Emulsions Correlation coefficients
0.1 % wt. of SC -0.2820
1 % wt. of SC -0.2871
2 % wt. of SC -0.2330
0.1 % wt. of SC + 5 % catfish oil
-0.2528
0.25 % wt. of SC + 5 % catfish oil
-0.1777
0.1 % wt. of SC + 10 % catfish oil
-0.1247
0.25 % wt. of SC + 10 % catfish oil
-0.2336
Table II shows the correlation coefficients for the emulsion where mostly the values are negative. This might indicate that the data might not correlate with each other but still can be acceptable. In Fig.1, when SC concentration is 0.1 wt. %, the mixture demonstrated a bimodal dispersion of droplets, with an average drop size of 310 nm for the 0.1 wt. % of SC curve. Expanding SC concentration from 0.1 to 2 wt. %, the average diameter of the drops reduced to 93 nm. Higher protein concentration in the fluid stage gives the emulsifier a chance to settle the droplets before they re-amassed and, in this way, limited the scope of droplet size. The droplet size dissemination for emulsion containing 0.1 wt. % of SC with 5 and 10 wt. % of catfish oil curves shows a monomodal distributions curves which clearly showed one most amazing top. For the 0.25 wt. % of SC with 5 and 10 % catfish oil curves also showing the same monomodal distribution curves. In comparison, the droplet size distribution which contains 0.1 and 0.25 wt. % of SC with catfish oil concentration (5 and 10 %) curves in the emulsion shows monomodal distribution curves compare to the emulsion which contains solely of 0.1 wt. % of SC curves shows only has a bimodal distribution. However, when the emulsions which do not include any catfish oil concentrations but has a higher concentration of SC (1 and 2 wt. % of SC curves), it shows a monomodal distribution curve (Fig.1). From Fig.1, the emulsions which contain 0.1 wt. % of SC with catfish oil (5 and 10 %) curves and 0.25 wt. % of SC with catfish oil (5 and 10%) curves have almost the same sizes in volume and droplet sizes except that for the emulsion which contains 0.1 % wt. of SC with 10 % catfish oil curves shows to have the highest peak as it has a volume about 9%. While for emulsion which only contains SC, the curve shows that when 2 % wt. of SC was used, the emulsion has the highest volume size distribution of about 10%. In comparison, when 1 and 2 % wt. of SC curves was utilized in the emulsion, both have one highest peak, however, when the lowest SC is used that is 0.1 % wt. of SC curve, it shows to have 2 highest peaks in its distribution which is at 3% volume but at different droplet sizes. In terms of the droplet sizes, it seems that the
emulsions which contain 2 wt. % of SC curve shows to has the smallest droplet sizes around in the
log scale in the x-axis. While another emulsion that also has the smallest droplets sizes are also the emulsions which contain0.1 and 1 wt.% of SC curves. This means that an increase in SC concentration in the emulsions can help to reduce the droplet sizes and droplet size distribution in the emulsion. From Fig.1, the emulsions which have the largest droplets sizes is probably going to 0.1 wt. % of SC with 10% catfish oil curve with the
droplet sizes is more than in log scale. When the SC concentration increases to 0.25 from 0.1 wt. %,
Fig.2Volume Size Distribution Against Droplet Diameter for Different Concentration of Higher SC(0.5, 4.0 and 10.0 wt. % of SC) andSC (Increased)With Mixtures of Catfish Oil [8], [12].
TABLE III
THE CORRELATION COEFFICIENTS VALUES FOR THE EMULSION SHOWN IN FIGURE 2 [7], [8].
Emulsions Correlation coefficients
4 % wt. of SC -0.3065
10 % wt. of SC -0.2576
0.5 % wt. of SC + 5 % catfish oil
-0.2335
0.5 % wt. of SC + 10 % catfish oil
-0.2625
upon SC fixation since higher concentration of oil required higher centralization of emulsifier, by keeping in mind the end goal to upgrade the adsorption of SC and surface scope of oil droplets which inevitably repressed the droplet collection or mixture adequately [8]. In terms of sizes of the droplets, the emulsions which contain 10 wt. % of SC curve shows to has the smallest droplet sizes amongst the other emulsion which is in the range
of less than on log scale while the largest droplet size which about on log scale goes to the
emulsions which contain 0.5 wt. % of SC curve with the addition of 5 and 10 % catfish oil. This indicates that the concentration of catfish oil in the emulsion can affect the droplet distribution sizes which in agreement with the results found in Fig.1. Based onFig.1 and Fig.2, it shows that increasing the concentration of the protein (SC) can affect the droplets by reducing its size and make the emulsion more stable. In addition, any higher oil concentrations will need higher protein concentrations to make the emulsion stable. In any case, there are no real contrasts in the droplet size with further increment in SC concentration to 10 wt. % compared with 2 wt. % of SC curve in Fig. 1.
Fig.3The Zeta Potential Againstthe Concentration ofaDifferent Type ofEmulsifier Which Contains Different Concentration [2], [4], [6], [25].
The data from Fig.3 are plotted to linear fit curved,and it can be expressed by Eq. , where is zeta potential, Z is a concentration of emulsifier and various E and F -coefficients. Zeta potential is plotted as the y-axis and emulsifier concentration is plotted on the x-y-axis.
TABLE IV
THE CORRELATION COEFFICIENTS FOR THE EFFECT OF CONCENTRATION OF ZETA POTENTIAL AND THE COEFFICIENTS VALUES FOR E AND F FOR DIFFERENT MEDIA IN FIGURE 3 [2], [4], [25]
Samples E -coefficients F -coefficients Correlation coefficients
SC-Chitosan -9.68 83.4 0.7463
4.5 23.5 449 0.6915
5 12.7 625 0.7554
5.5 -0.56 819 0.7936
SSP -36.6 -1.91 -0.947
GA -31.2 -0.69 -0.909
WPC -33.4 0.22 0.3129
Table IV shows the E and F –coefficients for different media which is obtained from Eq.(3) The E-coefficients is the data which is intercept at the y-axis (the zeta potential) while for the F-E-coefficients, it can be considered as the gradient for the media. The equation can be used to generate a graph for different media. This data might be deemed to be used for future reference in any experiment in the industry. The values for the E – coefficients are ranging from – 46 to 23.5 while for the F –coefficients have the values ranging from -2.99 to 819. For the correlation coefficients, mostly the data have positive values except for SBP, SSP,and GA which have negative values.
Fig.3 shows some reported values of zeta potential at = 3.0 of the emulsion from the three nourishment hydrocolloids (SBP, SSPS,and GA) [4], [15]. According to some fact, it was realized that the bigger the extent of zeta potential, the more noteworthy is the electrostatic aversion amongst drops, and consequently the stronger the stability. In this way, SBP curve ought to deliver the most stableemulsion, yet in
reality, it is not the situation as stately by the change in (Eq. ) on storage, it exhibits the weakest stability [8], [15]. This undependability of the zeta potential as a marker of relative emulsion strength emerges to some degree in light of the fact that the traditional twofold layer hypothesis used to gauge zeta potential from electrophoretic dexterity estimations accept a strongly charged particle which moves near to the electrolyte scattering medium at a very much characterized plane of shear [3],[ 4]. For a polyelectrolyte-covered surface, the plane of shear is not well characterized because it is subject to the obscure hydrodynamic stream of dissolvable inside the polymer layer. From Fig.3, as the SBP, SSP,and GA concentration increased, the zeta potential value for each emulsion also reduced more than -30 mV and made the emulsion more stable, but when the concentration for each emulsion is very high, the zeta potential value did not reduce any further. For example, in comparison the curve of GA concentration at 10 and 15 % seems to have the same value of zeta potential, this also goes the same with SSP and SBP curves.Also, the zeta potential of emulsions balanced out by SC-chitosan curve edifices against chitosan concentration also shown in Fig.3 [25]. Without chitosan, the general charge of the emulsion droplets was negative (-30mV) [25]. When the chitosan concentration increases more than 0.05 % (w/w) the droplet zeta potential became positive and almost reached a constant value of approximately +30 mV. The movement in the zeta potential qualities from negative to positive worth is because of chitosan which contains oppositely charged co-adsorb to the O/W interface through complexation with the adversely charged. In the sustenance and pharmaceutical industry, the creation of cationic emulsion droplets appears to be fairly encouraging. Also, the impact of chitosan concentration on the zeta potential of emulsions (1 % w/w fish oil, 0.1% w/w SC, 0.04% w/w chitosan (70 % DDA) 10 mM acetate acid buffer) shown inFig.3 [2]. It was preparedwith three different pH 4.5, 5 and 5.5. Base from what can be seen from Fig.3, it shows that as
the become more acidic ( 4.5), the zeta potential valuebecomeshigher and exceed +30mV which indicates
the emulsion is stable.
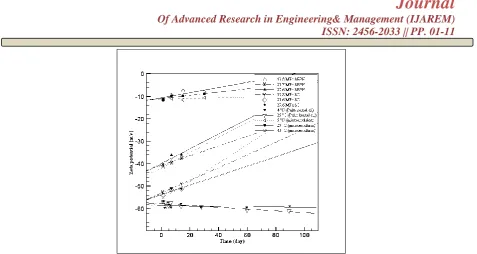
Fig.4The Value of Zeta Potential Against Storage Time For Different Emulsions [9], [16], [20].
The data from Fig.4 was all plotted to linear fit curve and can be expressedby Eq. where is for zeta potential (mV) and t is for time in day, with various coefficients of e and f. In the x-axis, the time is plotted in day while at the y-axis, the zeta potential is plotted.
TABLE V
THE CORRELATION COEFFICIENTS FOR THE EFFECT OF STORAGE TIME WITH ZETA POTENTIAL AND THE E AND F COEFFICIENTS FOR FIGURE 4 [9], [16], [20]
Samples E-coefficients F -coefficients Correlation coefficients
13.8 MPa SRPH -41.7 0.337 0.9846
20.7 MPa SRPH -40.7 0.216 0.9824
27.6 MPa SRPH -39.9 0.329 0.8503
13.8 MPa SC -53.0 0.283 0.9997
20.7 MPa SC -53.8 0.212 0.8755
27.6 MPa SC -55.9 0.408 0.8404
4 °C (Palm Kernel oil) -58.7 -0.00669 0.2354
25 °C (Palm Kernel oil) -57.8 -0.0394 -0.8738
5 °C (microemulsion) -11.2 0.0159 0.4934
25 °C (microemulsion) -10.9 0.0722 0.8709
40 °C (Palm Kernel oil) -10.6 0.114 0.7595
Table V shows the e and f –coefficients for different media which is obtained from Eq. . The e-coefficients is the data which is intercept at the y-axis (the zeta potential (mV)) while for the f-e-coefficients, it can be considered as the gradient for the media. The equation can be used to generate a graph for different media. This data might can be considered to be used for future reference in any experiment in the industry. The values for the e –coefficients are all negative values which ranging from -58.7 to -10.6. While for the f – coefficients, the values are ranging from -0.00669 to 0.408. In, the correlation coefficients values mostly have positive values which indicate the data might be acceptable except for the palm kernel oils which have negative values.
Wang, Li, Wang, and Adhikari (2011)stated that the terms zeta potential means is the potential contrast between the stationary layer of liquid appended to the scattered droplet and the scattering medium [9]. At the point when
the emulsion has zeta potential worth higher than +30 mV or lower than −30 mV, it has
a tendency to be electrostatically steady, though emulsions inside the scope of (-30) to 30 mV have a tendency to flocculate or coagulate [9], [24]. The emulsion stabilized with SC having higher zeta potential which means it has higher stability (Fig.4). As the storage time increased, the zeta potential of all examples got to be diminished, particularly emulsions containing SRPH. Aggregation can happen on the layers of protein encompassing droplets during extended storage time via ionic communication. The deficient electrostatic repugnance especially with extended storage times may prompt the improvement of flocculation and coalescence. Zeta potential encompassing the droplets directed the molecule size of the subsequent and the stability of emulsion [9].
Fig.4 shows the zeta potential estimations of the enhanced definitions of parm kernel oil which prepared using sodium diclofenac-loaded nanoemulsions during the storing time [20]. Negatively charged zeta potential value was found on the droplets of the prepared emulsions. The zeta potential value was around –57 to –58 mV and –57 to –60 mV at 4 °C and 25 °C, respectively (Fig.4). As the storage time expanded, a slight increment in the zeta potential value for both emulsion at 4 °C and 25 °C were observed. [20] stated that from the adsorption of sodium diclofenac in the fluid stage at the O/W interface, the negative charges on the droplets could be contributed. It has been accounted for that the steadiness of emulsions can be enhanced with ascending in the surface charge because of expansions in the anti-agents power between the droplets that brought about higher security against coalescence and flocculation.
The emulsion which is based on the study by [16] also mentioned inFig.4. The emulsion formulations were kept at three different temperatures (5 °C, 25 °C and 40 °C) and stored up to 1 month [16]. The emulsion reserved its original structures when stored at 5 °C and 25 °C, where the zeta potential value has not so many changes. However, when the emulsion stored at 40 °C, a noteworthy increase in zeta potential value can be seen [16]. Based on these results, it indicates that temperature also can affect the zeta potential value and at the same time also can influence the stability of the emulsions.
In comparison for all the data shown in Fig, 4, it indicates that all the emulsions are stable as the value for the zeta potential is below than -30 mV even though the emulsion was stored for sometimes, except for the microemulsion which is prepared at different temperatures is probably less stable with storage times.
V.
CONCLUSION
From the results, it shows that the addition of emulsifier in an emulsion can affect the stability of the emulsion on the particle size distribution. By investigating the stability of the emulsion with the volume size distribution graphs, it shows that when increasing the amount of SC concentration in an emulsion from 0.1 to 10.0 % wt. of SC, the emulsion tends to have an increase in volume percentage of droplet size distribution from ~3 to 13 % in volume and the emulsion tends to have smaller droplet sizes which are stable. With the added of catfish oil (5 and 10 %) in an emulsion, the droplet size distribution for the emulsion was affected, and its volume decreased from ~9 to 6 % in volume. This indicates that the catfish oil concentration in an emulsion could have an impact on the droplet distribution sizes. The formation of the stable emulsion can be seen when high pressure homogenization was applied and usually,the emulsion treated with homogenization can stable for longer time. As a result, increasing the SC concentration can help to reduce the droplet sizes for the emulsion and small droplets sizes are usually more stable comparedto larger droplet sizes. Increasing the SC concentration to 2 wt. % essentially diminished the mean droplet diameter to 93 from 310 nm. However, no further decreasein droplet sizes can be observed when the SC concentrations increased up to 10 wt. %. Furthermore, increasing the oil concentration in the emulsion will need more emulsifier concentration to prevent droplet aggregation or coalescence. Stabilizing the emulsion using SC is more stable compared to another stabilizeras can be proved from the study, where the droplet sizes for the emulsion is small and constant throughout the treatment. The addition of food hydrocolloids as an emulsifier such as gum arabic (GA), sugar beet pectin (SBP) and soybean soluble polysaccharides (SSP) also can affect the droplet size and stability of the emulsion on the droplet size distribution.
potential value is more than +30 or -30 mV, the emulsion will become stable.The emulsion stabilized with SC having higher zeta potential which means it has higher solidness.Withthe increasein storage time, the zeta potential of all specimens has to be diminished, particularly emulsions containing Skipjack Roe Protein Hydrolysate (SRPH). In comparison for all the data which is evaluated using zeta potential against storage time, it showed that mostly all the emulsion is stable as the value for the zeta potential is below than -30 mV except for the microemulsion which is prepared at different temperatures is probably less stable with storage times.
REFERENCES
[1] A. K. Anal, A. Toiassen, A. Flanagan, and H. Singh, " Preparation and characterization of nanoparticles formed by chitosan–caseinate interactions",Colloids and Surfaces B: Biointerfaces, 64(1), 104-110, 2008.
[2] P. Y. Árnadóttir, "Nano-laminated Fish Oil Droplets: Influence of Chitosan Charge Density on Emulsion Stability", University of Iceland, 2013.
[3] E. Dickinson, "Introduction to food colloids: Oxford University Press, 1992.
[4] E. Dickinson,"Hydrocolloids as emulsifiers and emulsion stabilizers", Food Hydrocolloids, 23(6), 1473-1482, 2009.
[5] E. Dickinson, and G. Stainsby, "Colloids in food: Applied Science Publishers, 1982.
[6] A. Goyal,V. Sharma, N. Upadhyay, A. Singh, S. Arora, D. Lal, and L. Sabikhi, "Development of stable flaxseed oil emulsions as a potential delivery system of ω-3 fatty acids",J Food Sci Technol, 52(7), 4256-4265, 2015.
[7] E. Hebishy, M. Buffa, B. Guamis, and A. J, Trujillo, "Stability of sub-micron oil-in-water emulsions produced by ultra high pressure homogenization and sodium caseinate as emulsifier",Chem Eng, 32, 1813-1818, 2013.
[8] N. H. Ibrahim, and N. N. M. Yusof, "Properties and stability of catfish oil-in-water emulsions as affected by oil and emulsifier concentrations", International Proceeding of Chemical Biological and Environmental Engineering, 33, 2-4, 2012.
[9] R. Intarasirisawat, S. Benjakul, and W. Visessanguan, "Influence of High Pressure Homogenisation on
Stability of Emulsions Containing Skipjack Roe Protein Hydrolysate",Indian Journal of Science and Technology, 9(2), 2016.
[10] S. M. Jafari, E. Assadpoor, Y. He, and B. Bhandari, "Re-coalescence of emulsion droplets during
high-energy emulsification",Food Hydrocolloids, 22(7), 1191-1202,2008.
doi:http://dx.doi.org/10.1016/j.foodhyd.2007.09.006
[11] E. Jurado, V. Bravo, F. Camacho, J. M. Vicaria, and A. Fernández-Arteaga, "Estimation of the distribution of droplet size, interfacial area and volume in emulsions,ColloidsandSurfacesA: Physicochemical and Engineering Aspects, 295(1), 91-98. 2007.
[12] S. Kanafusa, B. S. Chu, and M. Nakajima, " Factors affecting droplet size of sodium
caseinate‐stabilized O/W emulsions containing β‐carotene". European journal of lipid science and technology, 109(10), 1038-1041, 2007.
[13] H. H. Liu, J. T. Chien, and M. I. Kuo, Ultra high pressure homogenized soy flour for tofu making. Food Hydrocolloids, 32(2), 278-285, 2013.
[14] D. J. McClements,"Food emulsions: principles, practices, and techniques": CRC press, 2015.
[15] M. Nakauma, T. Funami, S. Noda, S. Ishihara, S. Al-Assaf, K. Nishinari, and G. O.
Phillips,"Comparison of sugar beet pectin, soybean soluble polysaccharide, and gum arabic as food emulsifiers. 1. Effect of concentration, pH, and salts on the emulsifying properties. Food Hydrocolloids, 22(7), 1254-1267, 2008.
[16] H. Pascoa, D. G. A. Diniz, I. F. Florentino, E. A. Costa, M. T. F. Bara, "Microemulsion based on Pterodon emarginatus oil and its anti-inflammatory potential" Brazilian Journal of Pharmaceutical Sciences, 51(1), 117-125, 2015.
[17] J. Peng, W. J. Dong, L. Li, J. M. Xu, D. J. Jin, X. J. Xia, and Y. L. Liu, "Effect of high-pressure homogenization preparation on mean globule size and large-diameter tail of oil-in-water injectable emulsions",Journal of Food and Drug Analysis, 23(4), 828-835, 2015. Retrieved from
http://www.sciencedirect.com/science/article/pii/S1021949815000514
1000-1008, 2011.
[19] N. M. Rasnani, H. Mirhosseini, B. S. bin Baharin, and C. P. Tan, "Effect of pH on physicochemical properties and stability of sodium caseinate-pectin stabilized emulsion, Journal of Food, Agriculture & Environment, 9(1), 129-135, 2011.
[20] M. Rezaee, M. Basri, M., Rahman, A. B. Salleh, N. Chaibakhsh, and R. A. Karjiban,"Formulation development and optimization of palm kernel oil esters-based nanoemulsions containing sodium diclofenac", Int J Nanomedicine, 9, 539, 2014.
[21] C. Sun, and S. Gunasekaran,"Effects of protein concentration and oil-phase volume fraction on the stability and rheology of menhaden oil-in-water emulsions stabilized by whey protein isolate with xanthan gum",Food Hydrocolloids, 23(1), 165-174, 2009.
[22] A. R. Taherian, M. Britten, H. Sabik, and P. Fustier, "Ability of whey protein isolate and/or fish gelatin to inhibit physical separation and lipid oxidation in fish oil-in-water beverage emulsion", Food Hydrocolloids, 25(5), 868-878, 2011.
[23] T. Tantayotai, and R. Pongsawatmanit,"Effect of Homogenizer Types and Sodium Chloride
Concentrations on the Physical Properties of Coconut Oil-in-Water Emulsions", KASETSART JOURNAL, 1, 2005.
[24] Y. Wang, D. Li, L. J. Wang, and B. Adhikari, "The effect of addition of flaxseed gum on the emulsion
properties of soybean protein isolate (SPI). Journal of Food Engineering, 104(1), 56-62, 2011.