J. Pure Appl. & Ind. Phys. Vol.1 (2), 147-151 (2011)
Preparation and Characterization of Amino Acids
Doped PANI
T. MATHAVAN1,* S. UMAPATHY 2 and M. A. JOTHIRAJAN 3
1
department of Physics,N.M.S.S.Vellaichamy Nadar College, Madurai – 625019, India 2
school of Physics, Madurai Kamaraj University, Madurai – 625021, India
3
department of Physics, Arul Anandar College, Karumathur, Madurai – 625514, India E-Mail Address: Tjmathavan@Yahoo.Co.In (T.Mathavan).
ABSTRACT
The preparation of polymer-amino acid composites combining the synthesized polyaniline and two amino acids namely L-glutamine (Q) and L-arginine (R) has been demonstrated. The prepared samples were characterized by DSC and atomic force microscopy. DSC thermograms showed the structural changes
occurred during composite formation. DC electrical
conductivity of the samples were measured in the temperature range 80 K - 310 K and found to be supported by a three-dimensional variable range hopping charge transport mechanism. The sample R doped PANI show higher conductivity than the conductivity offered by Q doped PANI is the novel observation. The carboxyl group of the both amino acids played an important role in the electrical conductivity through hydrogen bonding.
Keywords: differential scanning calorimetry; DC
condu-ctivity; atomic force microscope.
INTRODUCTION
Polyaniline (PANI) with the dopant acids is of fundamental importance in exploiting the electrical properties.1 It has attracted much attention because of its low cost, easy synthesis, good processibility and excellent environmental stability.2-3 PANI-amino acid composite has potential applications as biomimetic, biosensor,
materials had been found. In the present study it was seen that the carboxyl group of the amino acids Q and R form a hydrogen bond with the nitrogen of PANI so that the resultant composites were found with an improved electrical conduction. There are few reports on the synthesis and optical studies of polymer/amino acid composites.6,9,10 However to the best of our knowledge no studies have been reported on heat flow and temperature dependent dc conductivity of PANI/Q and PANI/R composites. Herein, we report the preparation of Q and R doped polyaniline composites which have improved electrical responses. The structure, morphology and dc electrical conductivity of Q and R doped PANI composites were also investigated.
EXPERIMENTAL
In this study aniline hydrochloride (0.20 M, 25.9 g; s.d.fine Chem. Ltd, India) and ammonium peroxydisulfate (APS) (0.25 M, 57.1 g; Merck, India) were dissolved in deionized water (500 mL in each case). The solutions were then mixed at room temperature, and aniline was left to polymerize. After 24 hours the precipitated PANI hydrochloride was collected on a filter and washed copiously with 1M ammonium hydroxide. The resulting PANI base was dried in vacuum at 60 ºC for seven hours. The process protonation of PANI in the solid-state was used.1,6,11 PANI base was mechanically blended for fifteen minutes with Q (C5H10N2O3) and R (C6H14N4O2) (99%, Central Drug House (P) Ltd, Bombay, India) in a mortar and two composite samples with the molar fraction of [Amino acid]/[PANI] with 0.05 (PANI-Q) and 0.01
(PANI-R) respectively were prepared. A differential scanning calorimeter (DSC; Model 2910 MDSC V4.4E) was used to examine the thermal properties of the Q and R doped PANI in the temperature range from 323 K to 473 K with a heating rate of 10 K/min. DC resistivity of the samples were measured from 80 K to 310 K by standard four-probe method on the sample pellets compressed at 250 KN/m2, 10mm in diameter and 2-5 mm thick.
RESULTS AND DISCUSSION
D.C. Conductivity measurements
T. Mathavan, et al., J. Pure Appl. & Ind. Phys. Vol.1 (2), 147-151 (2011) 149
100 150 200 250 300
0 3 6 σσσσ , S .c m -1 T (K) a b c
Fig. 1 DC conductivity plot of (a) PANI, (b) PANI-Q and (c) PANI-R.
0.24 0.26 0.28 0.30 0.32 0.34
-2 -1 0 1
2 P A N I
P A N I-Q P A N I-R
ln σσσσ , S .c m -1
1/T0.25 (K)
a b
c
Fig. 2 Arrhenius plots of ln σ vs 1/T 0.25.
DSC thermal analysis
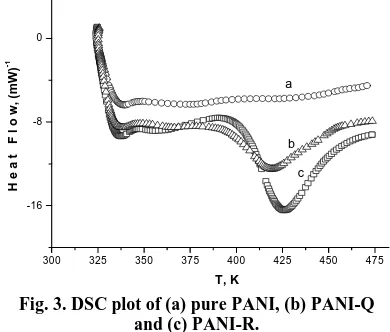
PANI/LG composite samples were studied by DSC to examine its thermal stability (Fig. 3). From 323 K to 473 K, there were three different broad endothermic transitions for pure PANI (Fig. 3a), PANI-Q (Fig. 3b) and PANI-R (Fig. 3c) respectively.
300 325 350 375 400 425 450 475
-16 -8 0 H e a t F l o w , (m W ) -1 T, K a b c
Fig. 3. DSC plot of (a) pure PANI, (b) PANI-Q and (c) PANI-R.
The maximum heat flow values observed for those samples were at 375, 395 and 378 K respectively. There was a small conversion seen before 353 K say about 338 K which can be attributed to evaporation of moisture. The endothermic peaks at 420 K
for PANI-Q and 425 K for PANI-R samples indicate the changes in structural transformation. Bond scissoring is normally an endothermic process while bond formation is an exothermic one, the overall reaction being an endothermic process.12 The presence of the endotherms in the samples could be due to different chains length. It can be concluded, that Q and R doped polyaniline forms cross linked structures at higher temperatures than the PANI.
AFM images
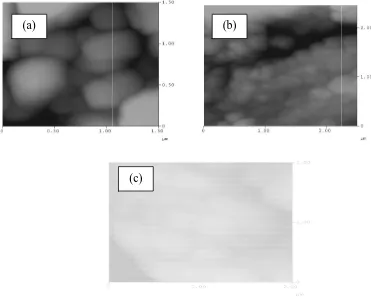
The AFM images (a), (b) and (c) of Fig. 4 exhibits a disordered arrangement of grains in 1X1 and 2X2 µm frames of 2D
images. The AFM images (a), (b) and (c) of Fig. 4 revealed that the topological surface of sample pellets are covered by grain size varying approximately from 0.1 to 0.5 µm in
Fig. 4. AFM images of
CONCLUSION
In summary, we report the synthesized PANI doped with Q and R in solid-state which proves the possibility of partial solid-state protonation. A possible 3D-VRH mechanism for the charge transport in Q doped PANI and R doped PANI samples was found with Arrhe fitting. DSC thermograms show the crosslink between the chains of Q doped PANI and R doped PANI. AFM images show the disordered grains with different size with volumes of the samples.
(a)
. 4. AFM images of (a) pure PANI, (b) PANI-Q and (c) PANI-R.
In summary, we report the synthesized PANI doped with Q and R in state which proves the possibility of state protonation. A possible VRH mechanism for the charge transport in Q doped PANI and R doped PANI samples was found with Arrhenius fitting. DSC thermograms show the crosslink between the chains of Q doped PANI and R doped PANI. AFM images show the disordered grains with different size with volumes of the samples.
ACKNOWLEDGEMENT
One of the authors T.M thanks Centre Director, CSR, Indore for providing valuable support.
REFERENCES
1. Jaroslav Stejskal; Irina Sapurina; Miroslava Trchova; Jan Prokes. Chem Mater, 14, 3602 (2002
2. Meera, K.; Muralidharan, R.; Tripathi, A. K.; Ramasamy, P. J Crystal Growth 263, 524 (2004).
3. Maennig, B.; Pfeiffer, M.; Nollau, A.; Zhou, X.; Leo, K.; Simon,
Phys Rev B, 64, 195208 (2001
(b)
(c)
One of the authors T.M thanks R, Indore for providing
Jaroslav Stejskal; Irina Sapurina; Jan Prokes. 2002).
Meera, K.; Muralidharan, R.; Tripathi,
P. J Crystal Growth
Maennig, B.; Pfeiffer, M.; Nollau, A.; Zhou, X.; Leo, K.; Simon, P.
T. Mathavan, et al., J. Pure Appl. & Ind. Phys. Vol.1 (2), 147-151 (2011) 151 4. Lihong Huang; Xiuli Zhuang; Jun Hu;
Le Lang; Peibia Zhang; Yu Wang; Xuesi Chen; Yen Wei; Xiabin Jing.
Biomacromolecules 9, 850 (2008).
5. Federica Rusmini; Zhiyuan Zhong; Jan Feijen. Biomacromolecules 8, 1775 (2007).
6. Mathavan, T.; et al., Materials Letters, 64, 2009 (2010).
7. Jin, E.; Na Liu; Xiaofeng Lu.; Wanjin Zhang. Chemistry Letters, 36, 10 (2007). 8. Bassler, H. Phys Stat Solidi (b),
175, 15 (1993).
9. Kunal Pal; Ajit Kumar Banthia; Dipak K Majumdar. Biomed Mater, 1, 49 (2006). 10. Gao, S.; Chen, S.; Yang, X.; Shi, Q.
Chem Pap, 58(2), 87 (2004).
11. Huang, W. S.; MacDiarmid, A. G.; Epstein, A. J. J Chem Soc Chem
Commun, 1784 (1987).
12. Andreia L Schemid; Susana I Cordoba de Torresi; Alessandra N. Bassetto;
Ivani A. Carlos. J Braz Chem Soc,
11, 317 (2000).