iii
I hereby declare that I have created this work completely on my own and used no other sources or tools than the ones listed, and that I have marked any citations accordingly.
v
Contents
Abstract xxi
Acknowledgements xxiii
Conventions xxv
Publications xxvii
1 Introduction 1
1.1 Motivation . . . 2
1.2 Research Goals . . . 4
1.3 Contribution . . . 5
1.4 Claims and Limitations . . . 7
1.5 Dissertation Roadmap . . . 9
2.2 Information Exploration . . . 14
2.3 Visualization . . . 15
2.3.1 Visual Interaction Techniques . . . 15
2.3.2 Data Classification . . . 17
2.3.3 Visualization techniques . . . 18
2.4 Summary . . . 20
3 Semantic Visualization 21 3.1 Ontology Visualization . . . 22
3.2 Consuming Semantic Data . . . 23
3.3 Visualization of Semantic Data . . . 23
3.4 Summary . . . 28
4 User Centered Design 29 4.1 User Engagement . . . 29
4.2 Evaluation . . . 32
4.2.1 UX Dimensions 1 . . . 32
4.2.2 UX Dimensions 2 . . . 33
4.3 Summary . . . 34
Contents vii
5.1.1 Tourism and Transportation Domain . 39
5.1.2 Cultural Heritage Domain . . . 43
5.2 Education Domain . . . 47
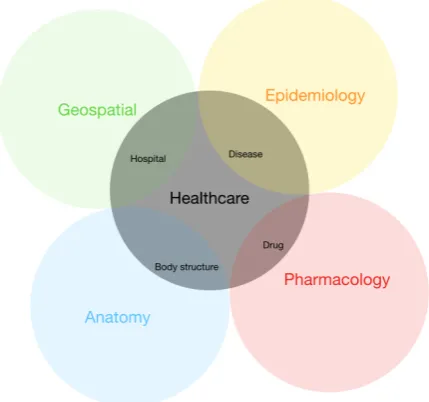
5.3 Health care Domain . . . 50
5.4 Summary . . . 52
6 Diversity 53 6.1 Knowledge Diversity . . . 56
6.2 Diversity in Visualization . . . 57
6.3 Summary . . . 58
7 Requirement Analysis 59 7.1 Understanding various Stakeholders . . . 59
7.2 Stakeholders Requirements . . . 61
7.2.1 Functional Requirements . . . 61
7.2.2 Non Functional Requirements . . . . 63
7.3 Summary . . . 66
III Solution Methodology 67 8 An Entity-Centric Approach 69 8.1 Overview . . . 69
8.1.2 Common Sense Representation . . . . 71
8.2 Entity-Centric Representation . . . 71
8.3 eTypes and their defining attributes . . . 73
8.3.1 Location . . . 73
8.3.2 Person . . . 73
8.3.3 Event . . . 75
8.3.4 Artifact . . . 76
8.3.5 Organization . . . 76
8.3.6 Prescription . . . 77
8.4 Summary . . . 77
9 Interface Design 79 9.1 Proposed Architecture . . . 79
9.2 Engaging users . . . 81
9.2.1 Design Iteration I . . . 82
9.2.2 Design Iteration II . . . 83
9.2.3 Design Iteration III . . . 85
9.2.4 Final Design . . . 86
9.3 Summary . . . 87
IV Development of Technology 89
Contents ix
10.1 Architecture . . . 92
10.2 Knowledge Layer . . . 93
10.2.1 Language . . . 95
10.2.2 Concept . . . 95
10.2.3 eType . . . 96
10.3 Mapping Layer . . . 98
10.4 Visualization Layer . . . 100
10.4.1 Visualization Context . . . 101
10.4.2 Exploration Context . . . 103
10.5 Implementation . . . 104
10.6 Deploying SemUI . . . 105
10.7 Summary . . . 107
V Use Cases and Evaluations 109 11 Trentino Entitypedia 111 11.1 Evaluation . . . 112
11.1.1 Usability Evaluation . . . 113
11.1.2 UX Evaluation . . . 114
11.2 Results and Discussion . . . 114
12.2 Results and Discussion . . . 122
13 Digital University 125
13.1 Evaluation . . . 126
13.2 Result and Discussion . . . 128
14 Events in Trento 131
14.1 Evaluation . . . 132
14.2 Results and Discussion . . . 134
VI Conclusion and Future work 139
15 Conclusion 141
15.1 Research Questions and Claims . . . 142
15.2 Lesson Learned . . . 143
16 Future work 145
A Early prototypes 147
B Consent 151
C Questionnaires 155
D SemUI: Implementations 163
Contents xi
xiii
List of Figures
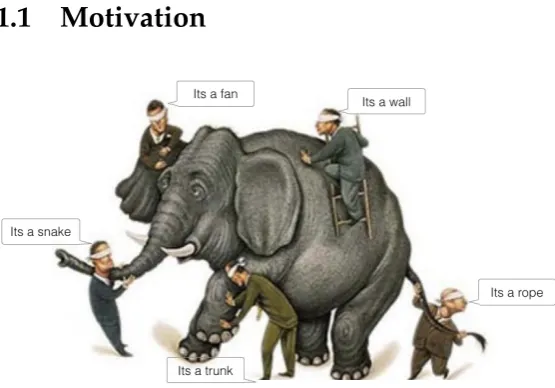
1.1 An elephant and five blindfolded men. . . 2
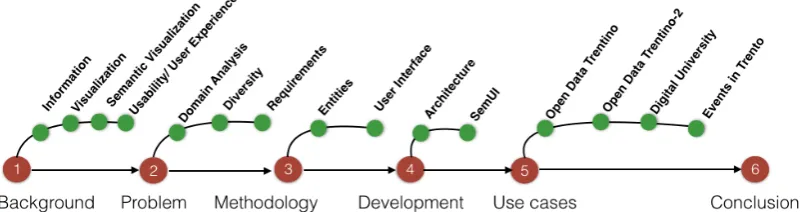
1.2 Thesis Structure . . . 9
2.1 Exploratory Search and interplay of various tasks. Adapted from [Marchionini, 2006, White and Roth, 2009]. . . 15
4.1 Various User Experience dimensions. Adapted from [Laugwitz et al., 2008]. . . 34
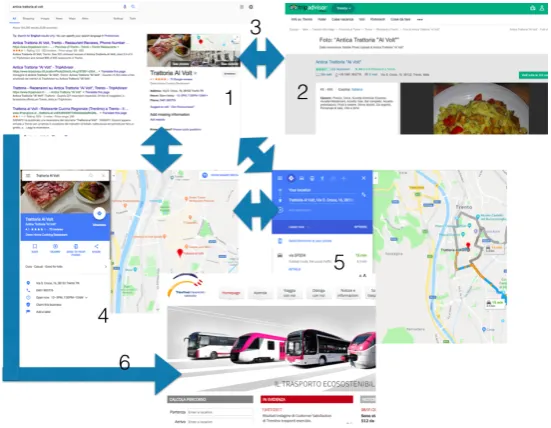
5.1 Information search process of an ordinary user, looking for a restaurant. . . 42
5.2 Hyperlinks represent an object on a triple store browser. . . 44
5.3 Relations between arts, artist, and museums. 44
5.4 Screenshot of Browse application. Image adapted from [Knoblock et al., 2017] . . . 46
5.5 Digital University . . . 48
6.1 An excerpt from open data catalog that illus-trates how a real-world object (Restaurant Al
Volt) is represented in three different way. . . 54
9.1 Solution Architecture . . . 80
9.2 Initial Mockup version I based on tourism scenario. . . 82
9.3 Mockup version II based on cultural heritage scenario. . . 84
9.4 Mockup version III based on transportation scenario. . . 85
9.5 Mockup version IV . . . 86
10.1 Multilayered Architecture . . . 92
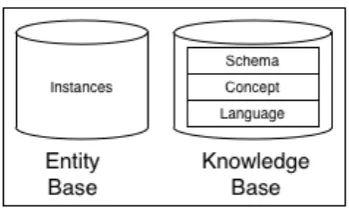
10.2 The Knowledge Layer. . . 93
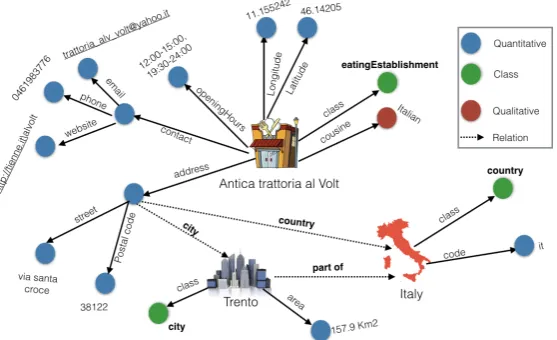
10.3 An entity graph- The legend describes differ-ent kinds of properties. The blue is a quan-titative attribute; brown is a qualitative at-tribute. Green is a class, and dotted arrow line is a relational property. . . 94
10.4 The figure describes the eType Meta Model. . 97
10.5 Metamodel mapped with to RDF(S). . . 98
10.6 The Mapping Layer. . . 99
10.7 The Visualization Layer. . . 101
10.8 eTypes and their visualization contexts. . . . 102
10.9 eType Mesh, showing relationship patterns in the schema. . . 103
List of Figures xv
10.11KOS UI. . . 105
11.1 UI of the working prototype. . . 112
11.2 Result of the usability test. . . 116
11.3 Result of the User Experience evaluation. . . 116
12.1 UI of the working prototype. . . 119
12.2 The proof-of-concept prototype. The views of two contexts are shown - time and graph. The left part of the view shows the visualiza-tion filters, whereas the right part renders the resulting content in the specific visualization context. . . 121
12.3 User responses on a five-point Likert scale. . 124
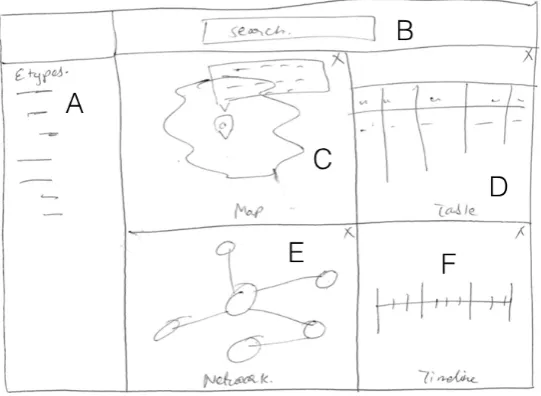
13.1 Multiview Entity Visualization. There are multiple viewlets called timeline (e), space (d), network (f) and tabular (c) viewlets. Search box (a) allows direct entity search. eType hierarchy faciliates exploration (b). History option facilitates traversing back to the previously explored entity or eType (g). . 126
13.2 Independent researchers grouping attributes based on Thematic Analysis. . . 127
13.3 Task completion time for all the participants. 130
14.2 The result of different UX dimensions. . . 135
14.3 The overall UX mean of the system . . . 136
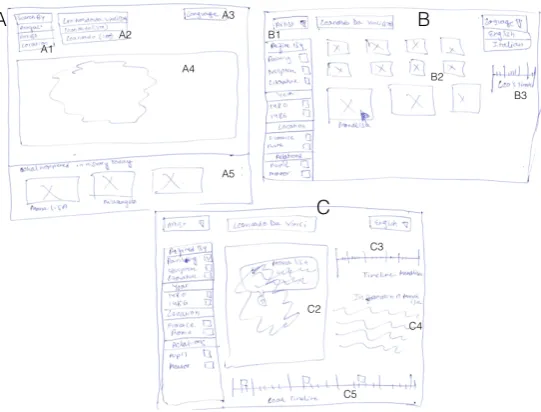
A.1 Trentino Entitypedia existing scenario in Ital-ian. . . 147
A.2 Trentino Entitypedia in the new scenario in Italian. . . 148
A.3 Trentino Entitypedia in the new scenario in Italian. . . 148
A.4 Digital University Low fidelity mockup . . . 149
A.5 Persona SHIB. . . 149
B.1 Consent for Trentino Entitypedia. . . 151
B.2 Consent for Digital University. . . 152
B.3 Consent for SemUI. . . 153
C.1 Dimensions for User Experience evaluation questionnaire. . . 155
C.2 System evaluation questionnaire Trentino Entitypedia 2. . . 156
C.3 System evaluation questionnaire: Aesthetics. 156 C.4 System evaluation questionnaire: UI aspects. 157 C.5 System evaluation questionnaire UI: emotions.157 C.6 System evaluation questionnaire UI: User’s own expereince. . . 158
List of Figures xvii
C.8 System evaluation questionnaire UI:
Mean-ing and Value. . . 159
C.9 System evaluation questionnaire UI: stimu-lation. . . 159
C.10 System evaluation questionnaire 1. . . 160
C.11 System evaluation questionnaire 2. . . 161
C.12 System evaluation questionnaire 3. . . 162
D.1 SemUI: in a museum setting. . . 164
D.2 SemUI: List view. . . 164
xix
List of Tables
3.1 Comparing Functionality of different tools
that exist in the Linked Data Community. . . 27
5.1 List of museums with their respective artists and artifacts. . . 43
7.1 Summary of noted Functional Requirements. 63 7.2 Summary of noted NonFunctional Require-ments. . . 65
8.1 Location eType . . . 73
8.2 Person eType . . . 74
8.3 Patient eType . . . 74
8.4 Event eType . . . 75
8.5 Visit eType . . . 75
8.6 Artifact eType . . . 76
8.7 Organization eType . . . 76
10.1 Summary showing how various require-ments were met. . . 106
11.1 Entities classified according to various eTypes. 111
11.2 Usability evaluation based on five-point Lik-ert scale. . . 114
11.3 UX evaluation based on five-point Likert scale.115
xxi
Abstract
This thesis aims to address a significant issue related with the consumption of diversified data in the field of semantics and knowledge representation by using a framework which allows the data consumption in a generic, scalable and pleasing manner. The work proposes a mixed solution by splitting the issue into four subproblems: how to preserve the richness associated with the data; how to present information about an object in a single or multiple visualization contexts; and to provide a seamless exploration of interconnected entities; and how to design a tool that offers a better user experience.
A real-world object can have various representations which lead to data diversity. However, each representation captures a view (mostly partial) of an object. To preserve the richness associated with the data, we follow an entity-centric design approach. In this approach, we represent multiple datasets related to an object as an entity with various properties. An entity is then further categorized in a group according to its similarities or differences.
Our contextual model not only considers the transformation of objects as entities but also adapts to various visualization contexts. These contexts are space, list, timeline, and net-work. We design a multiview visualization framework that allows simultaneous presenta-tion of entities according to these four defined visualizapresenta-tion contexts.
To allow seamless interaction of data with the users, we emphasized on using a multilayered architecture where: 1)datasets are aggregated and stored using an entity-centric approach, 2) visualized in various contexts and viewpoints simultaneously according to the entity types and users’ need. This adaptation is capable enough to facilitate presentation and exploration of diversified data according to users need.
To prove the feasibility of our framework, we applied it to visualize diversified data in var-ious settings. Continuous interaction with the end users produced valuable feedback and essential design suggestions. Finally, multiple prototypes were evaluated with the end users to verify their usability. The results obtained were highly favorable.
xxiii
Acknowledgements
This thesis represents a milestone not only for me but my family as well. There were ups and downs throughout the period I spent at University of Trento and in the Open Space 2, but the overall experience I got was terrific. Throughout the years, I learned that end users play an integral part in any solution. If you include them in the design, they will like the tool else they will use it but not like it. Furthermore, I only thought about entities, eTypes, and knowledge. For countless nights, I just dreamt about Entity-Centric representation. Redesigning a wheel which exceeds the performance of an existing one is not a bad design. Now, I can conclude entities definitely are the future!!! :-) Lastly, throughout the period, I encountered lots of remarkable people who I wish to acknowledge.
First and foremost, I want to thank my advisor, Professor. Fausto Giunchiglia for his immense support and teaching me the importance of entities.
I want to thank my colleagues from the KnowDive group. I specifically want to thank Subhashis Das and Maria De Las Mercedes respectively. Subhashis showed me a path towards data integration and management whereas Mercedes reminded me to stay inline in the field of Human-Computer Interaction. They were the per-fect check and balance for my work.
Super big hug to my entire family who never complained to me about being away but always supported me with their unconditional love and told me to stay focused and persevere.
xxv
Conventions
Throughout this thesis we use the following conventions.
Text conventions
Definitions of technical terms or short excursus are italicized.
Summary or essential sentence in a paragraph is also cited as a margin note.
Margin note Source code and implementation symbols are written in typewriter-style text.
myClass
The whole thesis is written in American English.
Download links are set off as footnotes.
File: myFilea
ahttp://disi.unitn.it/folder/file number.file
SPARQL queries are written in typewriter-style text.
SPARQL
xxvii
Publications
• Ojha, Sajan Raj, Mladjan Jovanovic, and Fausto Giunchiglia. ”Entity-centric
visualization of open data.” Human-Computer interaction. Springer Interna-tional Publishing, 2015.
• Giunchiglia, Fausto, Sajan Raj Ojha, and Subhashis Das. ”SemUI: A
Knowl-edge Driven Visualization of Diversified Data.” Semantic Computing (ICSC), 2017 IEEE 11th International Conference on. IEEE, 2017.
• Das, Subhashis, Sajan Raj Ojha, and Fausto Giunchiglia. ”ATOM: Ontology
Aware Transportation Model.” Semantic Computing (ICSC), 2017 IEEE 11th International Conference on. IEEE, 2017.
• Zhang, Hanyu, Sajan Raj Ojha, and Fausto Giunchiglia. ”Finding Errors in a Chinese Lexico-Semantic Resource Using GWAP.” Semantic Computing (ICSC), 2017 IEEE 11th International Conference on. IEEE, 2017.
• Karanjit, Sampada, Sajan Raj Ojha, and Subhashis Das. ”Process Ontology
for Confectionery SweetBot.” Semantic Computing (ICSC), 2017 IEEE 11th International Conference on. IEEE, 2017.
• Sajan Raj Ojha, Subhashis Das and Sampada Karanjit. ”A Process Ontology
1
Chapter 1
Introduction
Information seeking is an expensive and time-consuming Gathering information is a costly process. process in both personal and organizational contexts
[Feld-man, 2004]. In our life, we spend a substantial amount of time seeking, processing, communication and disseminat-ing information out of data generated from various sources [Robinson, 2010]. Furthermore, datasets are generated at a speed and volume making it laborious to make sense of them. Apart from the size of information, a real-world ob-ject can have multiple representations. These representa-tions can only capture a view of the object in a specific con-text. These issues of representation and context in data
cre-ate diversity [Giunchiglia, 2016]. Diversity is unavoidable A real-world object can be represented differently, creating diversity.
given the fact there are multiple data, producers and users [Giunchiglia, 2006]. Big and Open Data is a typical exam-ple where heterogeneity appears intrinsically. A exam-plethora of various datasets can be used to create plenty of services in different domains such as transportation, geospatial, land management or environment for the end users [Dadzie and Rowe, 2011b]. Although data diversity provides tremen-dous benefits, it also creates challenges while designing a generic User Interface [Khalili et al., 2016].
Semantic Technologies offer a solid foundation for aligning Semantic technologies deal with the knowledge representation. knowledge across various datasets. However, the problem
easy access to the data for immediate decision making.
The main contribution of this thesis is in the development The main
contribution is towards the development of a user-friendly interface for diversified data.
of an engaging diversity aware visualization framework for a variety of users. Starting from the domain analysis, re-quirement gathering phase to the final User Interface gen-eration, various stakeholders were included in the design and development cycle. The next section presents the moti-vation for the research in more detail and sets the stage for the thesis.
1.1 Motivation
Figure 1.1:An elephant and five blindfolded men.
”Reality is one, though wise men speak of it variously” [Grif-Diversity lies in the
users’ representation of the world. Depending on what she wants to see, she will perceive an object in its parts.
1.1 Motivation 3
she will perceive an object in its parts [Giunchiglia, 2016].
The example presented above is also relevant in the case Various data
producers generate a massive volume of data.
of data representation and visualization. A significant in-crease in the generation of the data from a variety of data sources makes the knowledge organization and represen-tation inevitable. Numerous organizations have already started integrating data from different streams like Open Data1showing their potential. However, the situation only
reflects one side of the story. The linked data technol- Semantified data should be easy to consume by various users to fulfill their need.
ogy only allows joining of data disregarding context which leads to the information overflow. As the semantified infor-mation is intended to be finally consumed by the end user and not only by machine provides a challenge for the end user [Bizer et al., 2009a].
To cater this situation, a multitude of visualization methods Plethora of visualization tools and techniques exist. and tools exists, ranging from standalone visualization
sys-tems, mashups, and browsers. However, most of the tools are either domain specific or lacks scalability.
A significant amount of work is done on the visualization Various domain-specific analytic tools exist, but they are not scalable. of extensive collections of domain-specific data, and the
re-sults are impressive. However, their domain dependency results in incompatible with cross-domain datasets. There are various visual analytic tool2. However, the analysis is
only limited to a particular domain or context.
The Semantic web community is facing a similar chal- Research shows that common people want more interactivity than direct
manipulation of data. lenge in linked data consumption [Mazumdar et al., 2014].
Linked open data has already made a big step by adding both diversity and machine-readable semantics of data on the Web. However, the scale of the Web provides unlimited amounts of cross-domain data whose contexts impose var-ious perspectives and interpretations from a human side. The data issue requires a general method to handle open data which is domain-independent and user-centered at the same time. Research by [Socrata, 2010] shows that people want more interactivity than the common method of
down-1Open Data are data that can be freely used, reused and redistributed
by anyone - subject only, at most, to the requirement to attribute and sharealike
loading and manipulating files. The major research chal-lenge currently faced by the linked open data community is to figure out how to present the structured data intuitively and generically for common users [Bizer et al., 2009b].
1.2 Research Goals
This thesis explores innovative solutions to visualize and explore data defining any real-world objects following an entity-centric approach. There are two major part of the work- data representation and presentation for the real
users. Data has significant diversity such as
multidimen-Data are diverse making them hard to integrate across various domains.
sional, language dependencies, nomenclature variations, variations in meaning and so on which creates hindrance while merging them. On the other hand, users are for We design tools so
that the final user can effectively consume the data irrespective of any technology used.
whom the interface is designed so they can effectively com-prehend and use the data which are currently hidden in various data silos and are not usable. These two factors make this thesis interdisciplinary work and to bridge the gap it requires an input from both the fields of semantics and Human-Computer Interaction.
The research question this thesis attempts to answer is as follows:
How can diversified data be visualized and explored using an engaging, pleasing and contextual user interface?
We can see that the above question has some key elements underlined: diversified data, effective visualization, and exploration,engaging, pleasingandcontextual. Based on this we can frame following research questions:
1. R1: How can the diverse data be presented clearly in
the interface?
(a) R1.1: What are the implications of using diversi-fied datasets from various domains in the visu-alization systems?
1.3 Contribution 5
(c) R1.3: What considerations and trade-offs are made to design both generic and a contextual in-terface?
2. R2: How can the user interface provide generic
explo-ration and presentation of diversified data?
(a) R2.1: How to generalize the process of explo-ration of related data?
(b) R2.2: How the relations be visualized generi-cally?
(c) R2.3: How the relations be visualized contextu-ally?
(d) R2.4: How the interaction be generalized?
3. R3: How can the engaging and pleasing interface be
designed?
(a) R3.1: Can we design a pleasing interface catering the need of all the stakeholders?
(b) R3.2: Is it possible to realize the need in practice? (c) R3.3: What are the compromises made during
the design of such interface?
1.3 Contribution
The overall objective is to come up with a visualization We follow two step-based approach: 1.) Entity-centric data management and 2.) Contextual
visualization. framework which adapts to the various context and
char-acteristics of the user and the diversified data. This situ-ation required explorsitu-ation of both literature and domain from various angle and context. For handling the data, we used an Entity-Centric approach and used Adaptive con-textual visualization for data presentation and interaction. In this thesis, to answer the research goal we performed fol-lowing steps.
• Understanding diversity from multiple perspective.
framework for diversified data in both contextual and generic way. This situation requires design and de-Contribution: Finding
out impediments in the use of data in various domains and their categorization.
velopment of a schema that is flexible in accommo-dating data from various domains and also a User In-terface which depicts this generic schema. Further-more, data always provide impediments from multi-ple stakeholders’ setting. Throughout the work, we tried to understand those various impediments in an Open Data setting in three different domains, namely, tourism, transportation, and cultural heritage. Fur-thermore, we also tried to understand the effective-ness of the visualization framework in other domain like education and health-care.
• Reference model for Contextual Visualization for
end users
Data depicting any real-world entities can be pro-Contribution:
Development of a framework for multiview and contextual visualization.
jected in any visualization that portrays them in space and time. However, an extensive literature review shows that the applications developed so far are ex-tremely domain centric and not scalable to various in-coming heterogeneous data setting. To fill the gap, we designed a framework which is both user-centric and shifts from property centric data structure to entity-centric where the visualization is guided by the con-text an entity is rather than the properties it possesses. Furthermore, to let the user understand the informa-tion from various angle, we devised coordinated mul-tiview presentation and exploration of data.
• Multi-tiered architectural design approach
Contribution: A prototype based on adaptive multi-layered architecture.
Designing an adaptive visualization that accommo-dates changes of the data at both design and runtime required a flexible architecture. For this, we adapted the software engineering principle by using a multi-tiered architecture where we segregate and encapsu-lates the functioning of every layer. For example, in our case, The knowledge layers only handles data and contains no business logic. Same is valid for visu-alization layer. The interaction between two layers is performed by a separate middle layer called mapping layer which handles all the data handling operations.
1.4 Claims and Limitations 7
To validate our hypothesis, we designed various low fidelity prototypes by involving stakeholders in the design cycle. These prototypes were further veri-fied and redesigned with the respective
stakehold-ers. After the analysis phase, high fidelity prototypes Contribution: Adapting the SemUI to various use cases. were designed. We explored various domains in this
work. The primary work was based on the Open Data setting where we developed a series of proto-types in various settings such as tourism and cultural heritage.
• Evaluation
Various stakeholders validated the work in the sum- Contribution: Usability and user experience
evaluation of various use cases with the end users. mative phase. In this phase, we asked multiple users
from different domains to test and approve our ap-plication. The primary goal was to understand the effectiveness of the application. Furthermore, we also tried to find if the application is providing them a bet-ter experience and is helpful to them.
1.4 Claims and Limitations
The work here was divided into two major parts: interac-tion and visualizainterac-tion of diversified data and the adapta-tion of the interface in many settings. Users were involved throughout the design and development phase. Further-more, the results are then further summarized to generate a framework for visualization of diversified data.
In addition to the framework, some claims were made while answering the intended goal. They are:
1. C1: It is effective to visualize different types of
en-tities in the same or different visualization context based on eTypes.
An entity consist of a defining class called an eType. An eType guides visualization context of an entity.
2. C2: Seeing different properties of entities simultane-ously facilitates easy exploration of related entities.
Different views provide different facets of the data Simultaneously
presenting various properties of an entity in different context provides a mechanism for flexible exploration.
giving the users the possibility to understand the overview of the data quickly. The evaluation carried with various stakeholders demonstrates that multi-view allows an easy and intuitive mechanism for data exploration.
3. C3: Involving users throughout the application
de-sign and development process will result in the sys-tem with the better user experience.
It is evident that an entity-centric approach has pro-Involving users
through the design and development of the interface is beneficial.
vided the foundation for managing large heteroge-neous data. It facilitates the data handling by provid-ing a generic and adaptive schema at design time and by providing a scalable, adaptive interface at runtime. The evaluation conducted with various users also jus-tify that the interface was pleasing and easy to learn.
Though the framework was scalable and useful for a set of stakeholders, there were certain limitations from the begin-ning. They are as follows:
1. Real world Objects
The multiview framework only allows both interac-We are not
considering any abstract concepts like a god.
tion and presentation of the real world objects which has existence on the surface of the earth and can be ac-commodated into our generic schema. Any abstract objects which are nonphysical or out of this world are not considered in this thesis. Some examples that belong to this outcasted category are celestial objects and god.
2. Number of users
Though we try to accommodate many stakeholders The population size
with whom the prototypes were evaluated was small.
scien-1.5 Dissertation Roadmap 9
tifically evaluated with a huge number of stakehold-ers.
1.5 Dissertation Roadmap
Figure 1.2:Thesis Structure
This thesis is structured into six major parts: background study, problem, solution, development of technology, use cases and conclusion as shown in Figure 1.2. Part wise de-scription of the thesis is organized as below:
• Part I presents a brief review of the literature in the Background
Information and Visualization- 2 Semantic Visualization- 3 UCD- 4. various fields that are connected with the work
pre-sented in this thesis. The proposed solution is highly interdisciplinary which required understanding the problem from multiple domains and facets. In re-gards to this, research done in the various fields is presented here. First, we explore the meaning of in-formation in chapter 2. Topic visualization follows it in chapter 2.3 where we study various visualization tools and techniques that have been proposed. Sim-ilarly, we explore various visualization techniques in the Semantic Web and Open Data community in chapter 3. Finally, we explore the user-centric design approach in chapter 4. Here we also briefly describe usability and user experiences evaluation techniques used in our work.
diversity-aware visualization. In chapter 5, we list out various
Problem
Domain Analysis- 5 Diversity- 6 Requirements- 7.
information and user needs; we explore various di-versity issues in those domains in chapter 6. Finally, from domain analysis and diversity analysis, we gen-erate a set of functional and nonfunctional require-ments from stakeholders’ perspective in chapter 7.
• Part IIImotivates the solution methodology towards
Methodology
Entity-Centric Approach- 8 User Interface- 9.
designing a generic visualization framework for di-versified data. Here we describe the notion of an en-tity and an enen-tity-centric approach on the chapter 8. Chapter 9 follows the user interface design technique where we demonstrate the iterative interface design technique to caters users’ need.
• Part IV presents the technical realization of the
sys-Development
Architecture
10. tem. Here in chapter 10, we describe a flexible vi-sualization architecture called SemUI based on the work presented in chapter 8 and 9. Here we propose a multi-tiered flexible architecture where 1) datasets are organized as entities 2) entities are visualized ac-cording to various visualization context and 3) map-ping layer that allows easy selection of entities from knowledge to visualization layer using various selec-tion funcselec-tions.
• Part V illustrates the implementation of various use
Use Cases
Trentino Entitypedia 11 and 12 Digital University 13 Events in Trento 14 .
cases in multiple settings. We concretely present the use of entity-centric approach in various open data settings such as tourism and transportation in chap-ter Trentino Entitypedia 11 and Trentino Entitypedia II 12. We also present the use of SemUI as discussed in part IV in various other settings such as digital uni-versity 13 and Trentino events 13. Furthermore, we also perform usability and user experience evaluation of those systems.
• Part VIwraps up the thesis presenting the summary
Conclusion15
11
Part I
13
Chapter 2
Information
Visualization
In this chapter, we will try to understand information vi-sualization as a foundation for the rest of the work. We will try to relate what information means and discuss vari-ous information exploration schemes. Finally, we will also discuss different visualization techniques aligned with our work. The goal of this study is to understand information visualization from multiple aspects.
2.1 Information
[Krikelas, 1983] defines information as “any stimulus that There are various definitions of information and knowledge from multiple perspectives. reduces uncertainty”. [Marchionini, 1997] defines
infor-mation as “anything that can change a person’s knowl-edge”. [Ackoff, 1989] defined information by contrasting with data, knowledge, and wisdom where data constitute raw observations and measurements; information repre-sents purposeful messages, built out relationships and in-terconnections within data; knowledge is built by applying information and data; wisdom is evaluated understanding, created by reflecting upon knowledge.
tion and knowledge [Schreiber, 2000]. Data defines real-world facts discretely [Choo et al., 2013, Davenport and Prusak, 1998], by observations [Davenport and Prusak, 1997], and using symbols for interpretation [Quigley and Debons, 1999, Van der Spek and Spijkervet, 1997, Schreiber, 2000]. Whereas, information is associated with meaning, context and relevance to data [Van der Spek and Spijk-ervet, 1997, Choo et al., 2013, Davenport and Prusak, 1997, Schreiber, 2000], which varies according to the recipient [Davenport and Prusak, 1998]. It can also be defined as a Information can be
defined as a flow of meaningful messages.
flow of meaningful messages and facts that defines a condi-tion or a situacondi-tion [Nonaka, 2008, Wiig, 1994]. Knowledge,
Knowledge encompasses of information generated from the human mind and constitutes truth, beliefs or judgment.
on the other hand, constitutes truths, justified beliefs, com-mitments, judgments, expectations, methodologies and so on [Wiig, 1994, Nonaka, 2008, Choo et al., 2013]. Knowl-edge comprises of valuable information from the human mind [Davenport and Prusak, 1997] and helps to answer how and why questions [Quigley and Debons, 1999].
2.2 Information Exploration
It is necessary to understand how humans explore informa-It is the process to
satisfy an information need.
tion. There is ongoing work to understand various search patterns, strategies, and techniques to model the informa-tion seeking process [Mazumdar et al., 2014]. [Wilson, 2000] define it as the “purposive seeking for information as a con-sequence of a need to satisfy some goal” which involves in-teraction with various information sources. There is a big Information seeking
and information retrieval are two different processes.
difference between information seeking and retrieval. For-mer relates to the acquiring whereas later relates to finding a system where they know where they are looking for [Mar-chionini, 1997].
Humans use various techniques for searching, browsing and monitoring information [Bates, 2002]. [Marchionini, 2006] describes exploratory search by a series of events as lookup, learn and investigate as in Figure 2.1. Lookup deals Exploratory search is
described as a set of activities.
2.3 Visualization 15
Figure 2.1: Exploratory Search and interplay of various tasks. Adapted from [Marchionini, 2006, White and Roth, 2009].
On the other hand [White and Roth, 2009] suggests that the Exploratory search can be an interplay of three tasks. process is not discrete but is the interplay between three
tasks. Here, lookup, learning and investigating are inter-connected. A user can start the search directly retrieving a specific fact (search engine). Whereas an exploratory search
requires more user and system interaction.The exploratory Exploratory Search depends on user’s interest and can last longer.
search process might require querying and requiring the topic of interest and can last for a longer time duration de-pending on the task and user’s motivation. This process of information exploration provides a useful pattern for us while developing our application.
2.3 Visualization
[Spence, 2001] defines visualization as the act of forming During data visualization, data are represented and then presented using the continuous human interaction. a mental model of an object in consideration. The process
starts with the data which is represented using a set of valid metaphor and then presented on the interface. After that, an end user can then interact with all three states to make sense of the data.
2.3.1 Visual Interaction Techniques
Before describing various tools, techniques, and frame- Interaction
to understand what interactions are and what are the differ-ent methods associated with them. Interaction techniques reflect the usefulness and adaptivity of the solution [Shnei-derman, 1996].
Here we present various interaction techniques based on the classification carried out by [Hearst, 1999]. The classifi-cation is similar to [Keim, 1997] classificlassifi-cation but also con-siders user’s input. Furthermore, we also adapt interaction from [Nazemi, 2016] which also aligns with our work. The techniques are:
Brushing and Linking
Brushing and linking provides highlighting and selection Allows highlighting
and selection of an object.
of visual objects from various views. Various ways in which highlighting can occur are; by changing of color or size of the selected object.
Panning and Zooming
Panning and zooming provide the change of the viewpoint Allows changing the
viewpoint of the data. to the visualized data. It helps refine the part or area of interest by either moving the screen or zooming to the part of the screen in focus.
Focus plus Context
When an item is zoomed, the surroundings also gets dis-Preserves the
surrounding context when an object is selected and zoomed.
torted. This leads to the loss of surrounding information. Focus plus context allows for zooming in the visual object by preserving the surroundings.
Semantic Zooming
Ordinary zooming only zooms the visualized object which Uncovers the
meaning while preserving the context.
is not entirely informative if the object is highly multidi-mensional. Semantic zoom uncovers detailed information to encompass the context and meaning of a zoomed target.
Animation
It is more of an implication of user’s interaction [Bartram, It details the
implication of a user’s action.
1997]. For example, copying a file that shows the exact copying action. It improves user’s interaction and under-standing [Palmer, 1999].
2.3 Visualization 17
The interaction enables visualization of the object from var- It allows preservation of the context and detailing on the area of interest
ious visual perspectives for example time and space which allows visualization of two various contexts simultane-ously [Card et al., 1999].
Dynamic QueriesThis is a very successful approach where It allows visual
interactive query formulation. the user interacting will build the query adding multiple
vi-sual components satisfying the various information need. Dynamic queries benefit users as it is easy to learn and remember, flexible with more reversible actions, provide more control to the user, instant visual feedback, limits er-ror and reduces the need of erer-ror messages [Mazumdar, 2013].
Direct ManipulationDirect manipulation provides direct in- In this technique
user’s idea will be translated to an interaction command. teraction with the user interface or visualization without the need
of commands.[Nazemi, 2016]. This technique is also some-how related to animation described above.
2.3.2 Data Classification
Here we provide various data classification that helps to Data classification facilitates easy interactions. define any interactions in the UI. [Card and Mackinlay,
1997, Card et al., 1999] proposed various data values by or-dering as:
1. Nominal: no values that can be ordered
2. Ordinal: value that can be ordered by relations be-tween other values.
3. Quantitative: values that can naturally be order
Data can also be classified according to the dimensions. Various data dimensions allow easy mapping to visualization and interaction. Understanding various data dimensions makes it easy for
mapping the interaction with the visual information. [Card et al., 1999, Keim et al., 2006] define various data dimen-sions as:
2. 2- dimension: map data;
3. 3- dimension: real world objects;
4. Temporal- 1- dimensional data with start, end time;
5. Multidimensional- data in relational and statistical database;
6. Tree: hierarchical data;
7. Network: interlinked data;
8. Text and Hypertext: data with unknown dimensions and number;
9. Hierarchies and Graphs: data with relationships to other information entities;
2.3.3 Visualization techniques
Various visualization technique classification has been re-Many classifications
of visualization exist. searched which shows various criteria to provide efficient visualization. [Keim et al., 2004] classified various visual-ization techniques based on the display mode. They are:
1. 2D/3D: Uses plots for visualization, example 2D charts;
2. Geometric Transformation: Using statistical methods to find point of interest;
3. Icon based: map attributes of data to some represen-tation as color or icons.
4. Dense pixel: Division of screen according to data vol-ume.
5. Stacked: Present hierarchical data by embedding co-ordinate systems.
[Ward et al., 2010] Presented a taxonomy of visualization. The visualization is
sometimes guided by a data structure, attributes and their values.
2.3 Visualization 19
Visualization technique is mostly dependent on data
struc-Data structure and values guide visualization. ture and data value as discussed above[Keim, 1997]. These
visualization techniques defined by [Keim, 1997] allows seamless representation of data.They are:
Geometric Visualization
This visualization technique transforms data value ranging Transforms data into 2D or 3D visual representation. from one dimension to multi-dimension data into a visual
representation. These visual representations can be either point, line or an area. They are described as:
• Points: It is the visual projection of data values as It is a projection of points.
points into a graphical representation. An example of such transformation is using Cartesian coordinates for point positioning.
• Lines: It is a visual projection of data values as lines in It is a projection of lines.
the graphical representation. There is a difference be-tween point-based visualization and line as it can vi-sualize curvatures, slopes, crossings and so on [Ward et al., 2010].
• Areas: It is a visual projection of data values as poly- It is a projection of polygons.
gons [Ward et al., 2010]. Shape, the color of the poly-gons visualized can be used as an extra dimension for visualization.
Graph Visualization
Data contains relationships, which are stored in different Presentation of nodes and edges. structural formats. Simply, it is the presentation of nodes
and links between data. There can be various ways in which a graph be presented. [Herman et al., 2000] per-formed a detailed investigation of a graph-based visualiza-tion. Discussing various visual layouts on which a graph can be displayed. Some arrangements are spanning tree, 3D layout, hyperbolic layout and so on. There can be mul-tiple graph visualization techniques such as:
1. Hierarchical: Parent child relationship is depicted in They are taxonomical visualization. this kind of visualization.
Pixel Oriented Visualization Big data might not be easy Data value is
represented using a pixel.
to visualize, hence his approach is more suitable where a pixel on the screen is used to represent a data value. They are categorized in two categories as:
1. Single-window: In this situation, an entire window is Projection on a
single 2D screen. used as a single projection pane. This allows map-ping of multi-dimensional data into a single two-dimensional space.
2. Multi-window: In this technique on a single screen A single screen is
divided into many screens.
is further divided into various other screens. This al-lows an enhanced view to the data point.
2.4 Summary
In this chapter; we discussed what is an information. We We motivate the
definition of information.
understood information seeking behavior highly depends on the information need and environment [Marchionini, 1997]. Seeking not well-defined questions or only gather-ing overview of information lead to browsgather-ing. Exploration allows discovering, learning and investigating a new set of information.
In this chapter, we discussed different visualization tech-We explored various
visualization schemes.
niques. We explored information visualization from multi-ple perspectives and motivate how various data types and their dimensions guide the visualization process.
These visualization techniques motivate and provide a We explore various
semantic visualization in the next chapter.
21
Chapter 3
Semantic Visualization
This chapter is based on the background work presented on top of the previous chapter. We will try to articulate how various visualization and interaction metaphors were developed in the field of semantics.
Tim Berners-Lee, father of World Wide Web also proposed Web technologies like HTML was only focused on humans. a Semantic Web (SW) as an extension of the existing web
[Berners-Lee et al., 2001]. The technology at that time was only built for humans to read. The primary focus was on the content presentation and layout which was rendered by the browser. Processing the information by the machines was hard. The invent of SW shift the paradigm, allowing computers to perform intelligent operations. To make the content understandable by machines, Resource Description Framework (RDF) which is based on Web Ontology
Lan-guage (OWL) is used [McGuinness et al., 2004]. [Mizoguchi RDF uses ontologies using OWL.
and Ikeda, 1998] listed various levels of use for an ontology as :
1. Level1: As a common vocabulary for communication; 2. Level2: As a conceptual model;
3. Level3: As a backbone information; 4. Level4: Answering competence questions;
6. Level6: Mean of structural organization of Databases 7. Level7: Reusing knowledge base’s knowledge 8. Level8: Knowledge base reorganization
Then the concept of Linked Data (LD) arise where many Linked data
momentum is allowing various research parties to link data using RDF.
data publishers are pushing data into more machine un-derstandable formats [Bizer et al., 2009a, Mazumdar, 2014]. However, the SW and LD, do not offer proper support for
The SW technologies are only limited for machine.
the consumption of resources from a human perspective. They are only able to identify and relate resources [Berners-Lee et al., 2006] uniquely.
3.1 Ontology Visualization
Before diving into the visualization of semantic data, we We explore different
mechanism on which ontologies can be visualized.
explore various ontology visualization tools. Various tools have been developed with the goal to visualize ontologies [Katifori et al., 2007]. Ontology visualization considers el-ements such as classes, instances, attributes, and relations. Ontologies are usually visualized as hierarchies using the following UI controls:
• Intended list - Represents an ontology as items of the
hierarchical list.
• Tree control- Represents an ontology as nodes of a tree. Nodes can be easily expanded or retracted to adjust the information according to the user needs.
• Scaling mechanism - Allows for zoom-in/zoom-out
functions. It is used in combination with the other UI controls.
• Context extraction mechanism - Extracts a particular
view on the ontology usually by selecting part of its content and the visual perspective.
• Symbologies- This is a technique where an ontology is
3.2 Consuming Semantic Data 23
The main issue with the techniques above is that they are all Most of the presentation are hierarchical without the separation of schema and data. used to visualize data in the form of the hierarchical
struc-tures. This makes them less usable when visualizing actual objects, i.e., they do not make a clear separation between the ontology (classes) and instances. As such, they are used mainly by knowledge experts.
3.2 Consuming Semantic Data
Plethora of application tools are designed following vari- Various visualization technique exists. ous design approach providing various interaction
mecha-nisms to query and visualize semantic data. We list a few of them below:
1. Textual: In such kind of systems, users have to inter- A user needs to formulate textual queries.
act with the data by formalizing textual queries. Such systems are only confined within the use of techni-cal users [Kaufmann et al., 2007, Lopez et al., 2006, Damljanovic et al., 2011, Bhagdev et al., 2008, Lei et al., 2006, Tummarello et al., 2007, Hogan et al., 2011, Cheng et al., 2008].
2. Faceted: Facilitates users to build queries dynam- Allows building of information using various facets. ically using hierarchical information searching
ap-proach, where they start the building the information in a generic way and drill down to until they have found the required information [Mazumdar et al., 2014, Wilson et al., 2006, Hyv¨onen et al., 2005, Hilde-brand et al., 2006].
3. View support: The tools in this category consist of Consist of visual interaction components. ontology and other interactive components. Most of
the view based system are graph based [Mazumdar, 2014, Athanasis et al., 2004, Catarci et al., 2004, Elbed-weihy et al., 2012, Kaufmann and Bernstein, 2010].
3.3 Visualization of Semantic Data
A plethora of tools and applications exist to cater user needs [Mazumdar et al., 2014]. Here we present some tools and techniques that have already been developed for easy visualization of semantic information.
1. Text-based: Lists out triples as a table or lists. No Consists of a tabular
list. other interaction technique is defined [Mazumdar et al., 2014].
2. Enriched-Text: This is an advancement over the pre-Consists of a tabular
list of links. vious design where data are presented as links and also contains icons, colored materials [Mazumdar et al., 2014, Lopez et al., 2006].
3. Text and Image: In this visualization technique, a Consists of an
enhanced list with data structure visualization.
data structure can also be viewed for example images [Hildebrand et al., 2006, Wilson et al., 2006, Hyv¨onen et al., 2005, Petrelli et al., 2009, Glaser et al., 2004].
4. Basic visual encoding: This visualization technique is Supports advance
visualization per domain.
an advancement over the previous one allowing var-ious views based on the data features [Berners-Lee et al., 2006, Becker and Bizer, 2008].
5. Advance visualization: Supports multiple visualiza-Assists multi
interactive visualization.
tion and interaction of the data [Mirizzi et al., 2010].
Based on the above features and the work stated in Chapter We compared
multiple LOD application from a different perspective.
2, we give a comparative analysis of the Open Data visual-ization systems found in the literature. The comparison is made against a set of requirements adapted from [Dadzie and Rowe, 2011a]. The criteria are:
1. Interactive Visualization (IV): Refers to the use of
If interactive components are used in the tool.
interactive representation through different kind of widgets (such as images, buttons, and maps). Here human perception is considered in understanding the complexity of the data structure and discovery and analysis of the data [Amar and Stasko, 2005, Bizer et al., 2009b, Card et al., 1999, Hastrup et al., 2008].
2. Relations (R): Denotes different kinds of
relation-A possibility of finding different relations.
3.3 Visualization of Semantic Data 25
the data and find new data [Becker and Bizer, 2009, Berners-Lee, 2011, Fekete et al., 2008, Halb et al., 2008a].
3. Details on demand (DOD): Deals with exposing dif- See data from
various level of details. ferent level of details for the data as needed [Card
et al., 1999, Hastrup et al., 2008].
4. Scalability (S): Denotes the ability to manage and Able to manage large
or small heterogeneous datasets. link large amount of heterogeneous data, which are
loosely coupled [Becker and Bizer, 2009, Card et al., 1999, Halb et al., 2008b].
5. Filtering (F): Refers to an ability to suppress irrele- Maintain focus on
specific part of information. vant information and focus only on information
rel-evant to a particular context or user session [Becker and Bizer, 2009, Card et al., 1999].
6. History (H): Describes the ability to record a history Ability to retrace back
what has been done. of interaction allowing the user to review or retrace
paths, undo/redo their actions [Bizer et al., 2009b, Heath, 2008].
7. Faceted exploration and Navigation (FN): Refers to Ability to switch from
a context to another. a flexible mechanism that enables setting particular
context for search and exploration, and switching to another context based on relations the user explores during the session [Cao et al., 2010, Shneiderman, 1992, Farazi, 2010].
8. Domain Independency (DI): Means that applica- Able to
accommodate a plethora of domains. tions are not coupled with the specific domain and
can exploit a wide range of underlying datasets [Giunchiglia et al., 2012b, Berners-Lee et al., 2008, Bizer et al., 2009b, Hastrup et al., 2008].
9. Target User Group (UG): Means we differentiate three The desired
audience of the system. target user groups [Dadzie and Rowe, 2011a,
Mazum-dar et al., 2014].
(a) Common User (C): End-user who does not have Generic people. any background in ontologies.
(c) Domain Expert (D): End-user with expertise in Data scientists.
data of a particular domain. They might or might not know an underlying technology.
Table 3.1 gives a brief comparison of existing Open Data Should emphasize
on the friendly presentation of data.
applications. When visualizing open linked data to make them accessible for common end users not familiar with Se-mantic Web languages, it is important not to present data as URIs or triples but in a more user-friendly way.
Although some systems provide high-level interactivity Most of the
applications still present on the enhanced textual form.
and emphasize different kinds of relations in visualized datasets, they mostly use RDF to describe the data. From the usability viewpoint, it adds an extra effort to the end user to interpret and understand what is being visualized. Applications like Dipper1, Disco2, Marbels3, Piggy Bank4,
Sig.ma, URI Burner5, Zitgist6 and IsaViz7 employ
com-plex notations for visualization. They mainly use knowl-It is hard to drill down
on the data. Furthermore, they are contextual and has no filtering support.
edge graphs that quickly become cumbersome as users drill down the data. Tools like OpenLink8,RDF Gravity9,
RelFinder10, SIMILE/Exhibit11) and LESS12 provide good
visualization support, but are highly contextualized and does not support better filtering and tracking history of in-teraction.
Regarding cross-domain support, most of the systems al-Tools do not allow
context switching. low visualizing in a predefined context, without the ability to switch to another context based on the relations user per-ceives during the session. This limitation also comes from the automated production of Linked Data which raises the problem of the accuracy and completeness of the datasets. In particular, incorrect or missing values, or incorrect links Link data are
automatically produced containing various errors.
1http://api.talis.com/stores/iand- dev1/items/dipper.html 2http://www4.wiwiss.fu- berlin.de/bizer/ng4j/disco 3http://www5.wiwiss.fu- berlin.de/marbles
4http://simile.mit.edu
5http://linkeddata.uriburner.com 6http://dataviewer.zitgist.com 7http://www.w3.org/2001/11/IsaViz 8http://lod.openlinksw.com/ode
9http://semweb.salzburgresearch.at/apps/rdf- gravity 10http://relfinder.dbpedia.org
3.3 Visualization of Semantic Data 27
make it hard to correlate data [Dadzie and Rowe, 2011a].
Table 3.1: Comparing Functionality of different tools that exist in the Linked Data Community.
Application IV R DOD S F H FN DI UG
Dipper L L L L L L L L T
Disco L L M L L L L H T
Marbels L M M L L L L H T
Piggy Bank L M H L L H H H C
Sig.ma
[Tummarello et al., 2010] L L M H H M L H TU
URI Burner L L M L L L L H T
Zitgist L H M H M H H T
DBPedia Mobile
[Becker and Bizer, 2009] H L H M H H L M CU
Fenfire
[Hastrup et al., 2008] H H H H M L L H All
IsaViz H H H H H H H H C;T
LESS H L M L L L L H All
OpenLink H H H M H H L H All
RDF Gravity H H H M H L L H All
RelFinder H H H H H L L L All
Tabulator
[Berners-Lee et al., 2008] H M H L L M L H TU
SIMILE/Exhibit M L L L H L L L C
Rhizomer
[Garc´ıa et al., 2008] L M H L M L H L T
Sgvizler
[Skjæveland, 2012] H M L L L L L L T
LODWheel
[Stuhr et al., 2011] L H M M M M L L T
Calluna
[Otjacques et al., 2012] H H H L H H L M C
Low (L) - The system has no or low support for the cate-gory.
Medium (M) - The system supports the feature to some ex-tent.
High (H) - The system has full support for the category. Common User (C), Technical User (T), Domain Expert (D)
All the factors above require a certain level of expertise, ei- Most of the tools are designed and focused on technical experts and domain experts.
with a common visualization tool that captures open data diversity and unexpectedness in a user-friendly way.
3.4 Summary
In this chapter, we discussed various semantic visualiza-We discuss various
semantic visualization.
tion tools and techniques. Different data visualization tools have been developed and used in the domain of semantics [Lanzenberger et al., 2009]. Although general guidelines for visualizing diversified data have been proposed [Shnei-derman, 1996], in practice they are still not fully addressed. Our work lies at the intersection of data visualization, on-tology visualization, and knowledge visualization.
In the next chapter, we discuss various user-centric design We explore the
user-centric design in the next chapter.
29
Chapter 4
User Centered Design
In this chapter, we will try to understand various user-centered design techniques and work done previously to support user engagement. This chapter will also provide the canonical foundation for the rest of the work. Here we will discuss how end users can be engaged in various design stages. Finally, we will discuss different evaluation techniques which we also implemented in our work.
Users are actively involved in the design and development Users always stay at the center of any product.
of the product to understand their tasks and requirements better [Donald and Draper, 1986]. It helps to get a better un-derstanding of their needs and goals, it grounds the prod-uct to the user’s reality and also generates the feeling of ownership to them [Rogers et al., 2011].
4.1 User Engagement
[Gould and Lewis, 1985] discuss three principles of system Various user engagement techniques in the design cycle have been proposed in the literature.
con-sidering the changes suggested by the users. [Rogers et al., 2011] suggest five principles as:
• It is important to understand users’ alignment with
User’s tasks and goals are the driving force behind the development.
the technology for better support of user tasks to ful-fill the goal. Here technology should not be imposed.
• It is important to understand users’ behavior and
Understand Users’
behavior. their intentions while they are performing their tasks.
• It is important to understand the physical and
cogni-Capture users’
characteristics. tive ability of the users. This helps to design a better system.
• Users are consulted throughout the design of the tool.
Consult users throughout the design and development phase.
Designers have to be aware of the user’s sentiment and be respectful towards the users.
• Though the users are not designing the product; the Consider users in all
the design decisions. designers have to be aware that the product is being designed for them.
[Rubin and Chisnell, 2008] illustrates that users are always Users are always at
the center of the design of a tool.
the critical part while developing a system. In the first part of the design, understanding users’ context, goals, environ-ment, and objectives are the primary concerns. Whereas the outer circle focuses on various tasks such as detail, or-ganization, flow, and content. [Abras et al., 2004] illustrates There are various
ways in which users can be involved in the product design.
multiple ways in which users can be included in the design and development of a solution. [Vredenburg et al., 2002] surveyed how UCD is employed by various practitioners while designing the systems.
Users are highly considered on iteration phase followed by From the survey, we
can see that users are mostly involved in iterative design and evaluation.
assessment and task analysis. Though the method is highly useful, it is not well adapted to the design and develop-ment scenario. . Considering the initial involvedevelop-ment cost,
Though the approach is beneficial there is hesitance from the companies to adopt the methodology.
4.1 User Engagement 31
Just like software design cycle, UCD can also have four The design cycle can be iterated many times and can be entered at any phase. stages as study, design, build and evaluate where the
itera-tions can be made many time [Harper et al., 2008, Mazum-dar, 2014]. This flexibility allows designing better products.
[Harper et al., 2008] introduced another phase calledunder- Understand stage is multidisciplinary and acts as a catalyst for various stakeholders. standwhich aims to perceive various human values. This is
a multidisciplinary approach requires understanding from various other fields. This stage acts as a catalyst initiating discussion across various stakeholders working in multiple domains. The output of this stage is the input of the study stage.
A multidisciplinary analysis has to be performed at this The study stage perceives a user’s interaction practice to perform their job. stage. A close study of how a user interacts with an
exist-ing solution, their work habits, practices and environment in their everyday like is studied [Mazumdar et al., 2014]. This output that deals with a user’s various interaction fac-tors acts as an input to design stage.
Here we design various artifacts like sketches in different Designers and developers identify various goals. environment and settings. A technical study of the
exist-ing technologies, hardware and software consideration to design better systems is also understood at this stage.
Possible implementation solutions are designed and devel- Various low and high fidelity solutions are designed.
oped at this stage. A new system can be developed, or the existing system can be extended to cater user’s need.
It estimates the outcome of the build stage where the sys- We evaluate the effectiveness of the system.
tem performance verified. Understanding how the new so-lution is perceived and helping the user is the primary goal of this stage.
In this stage we perform various quantitative and qualita- Qualitative and quantitative
assessment is made. tive evaluation of the solution. Multiple dimensions like
4.2 Evaluation
In our work, we have tried to incorporate users as much as possible. Furthermore, we have followed various evalua-tion patterns in our work. Here we discuss different usabil-ity and User Experience evaluation done in our work.
Software development is very time consuming and expen-Consideration has to
be made to understand the resources and their constraints.
sive process, so consideration has to be made to understand the resource and constraints (like cost, time, system repre-sentations, participants, test environment and equipment, data capture tools, analysis tools, security and so on.)while evaluating the system [Mazumdar et al., 2014].
Heuristic evaluation [Nielsen and Molich, 1990] allows Evaluation can be
conducted in many ways.
coming up with positive and negative aspects of the inter-face. Similarly, in cognitive walk-through [Wharton et al., 1994], the solution is evaluated by a group with a pre-defined sequence of actions. Think aloud study [Erics-son and Simon, 1980] generates a verbal report to better understand the experimenter’s interpretation. Contextual inquiry [Beyer and Holtzblatt, 1999] helps understanding users’ day to day activity. CASSM (Concept-based Analysis of Surface and Structural Misfits) [Blandford et al., 2008] fo-cuses on user’s conceptual model and its fitting in the sys-tem developed.
Out of many evaluation possibilities, we explored various We separately
studied User Experience evaluation.
ways to measure User Experience. In the literary work, there are many similarities between usability and user ex-perience. Here we focus on two ways on how User Experi-ence (UX) is defined.
4.2.1 UX Dimensions 1
[Winckler et al., 2013] surveyed various factors regarding usability and User Experience and proposed these concrete dimensions as:
1. Visual and Aesthetic Experience: Shows how
4.2 Evaluation 33
thetics affect user perception of the system. It deals with the pleasure that users gain from the immediate perception of the system [Hekkert, 2006, Lavie and Tractinsky, 2004, Hassenzahl and Tractinsky, 2006, Alben, 1996].
2. Emotion: Describes effective side of UX regarding How user gets
emotionally active seeing the system? feelings and emotions elicited as an outcome of the
in-teraction with the system [Hekkert, 2006, Alben, 1996, Desmet and Hekkert, 2007, Mahlke and Th ¨uring, 2007].
3. Identification: Addresses the human need to ex- How are human
need expressed? press oneself through the interaction with the system
[Marc, 2007, J¨a¨ask¨o and Mattelm¨aki, 2003].
4. Stimulation: Relates to the quality of the system to How the system
encourages and discourages users? encourage a user to use it [Hassenzahl, 2005, Sheldon
et al., 2001, Karapanos et al., 2010].
5. Meaning and Value: Denotes the quality of the system How is the system
important to the user?
to reflect or represent values that are important to the user [Hekkert, 2006, J¨a¨ask¨o and Mattelm¨aki, 2003].
6. Social relatedness/coexperience: Describes the plea- How is social co
pleasure obtained? sure that comes from the social interactions [J¨a¨ask¨o
and Mattelm¨aki, 2003, Gaver and Martin, 2000].
4.2.2 UX Dimensions 2
[Laugwitz et al., 2008] came up with more generic User Ex-perience dimensions. They are:
1. Attractivenessrelates to the overall impression of the How beautiful is the
system? system.
2. PragmaticIt measures the usefulness of the system Usability of the
system. across three dimensions. Efficiency deals with how
Figure 4.1: Various User Experience dimensions. Adapted from [Laugwitz et al., 2008].
3. Hedonic Users stimulation is measured in this
di-User stimulation while using the system.
mension. It is composed of stimulation (deals with the feeling of excitement while using the system )and Novelty (The innovativeness of the system).
4.3 Summary
In this chapter we investigated various techniques followed Various factors
associated with User Centric Design is studied.
in UCD. User-centered design is a very crucial methodol-ogy that has to be implemented in the design and devel-opment of the solution. The methodology will facilitate designing and defining better products. We implemented various techniques to involve users in the design and de-velopment of the tool.
These literary review show potential gap. The concept of In the next part we
formulate various problems aligned with the thesis.
35
Part II
37
Chapter 5
Domain Analysis
The background study related to various visualization The potential of contextual visualization in the field of semantics is still not yet explored. tec