Impact of various types of near work and time
spent outdoors at different times of day on
visual acuity and refractive error among
Chinese school-going children
Hongyu Guan1‡, Ning Neil YuID2☯*, Huan Wang2‡, Matthew Boswell2‡, Yaojiang ShiID1‡,
Scott Rozelle2☯, Nathan Congdon3,4,5☯
1 Center for Experimental Economics for Education, Shaanxi Normal University, Xi’an, China, 2 Freeman
Spogli Institute of International Studies, Stanford University, Stanford, CA, United States of America,
3 Centre for Public Health, Queen’s University Belfast, Belfast, United Kingdom, 4 Orbis International, New
York, NY, United States of America, 5 Zhongshan Ophthalmic Center, Guangzhou, China
☯These authors contributed equally to this work. ‡ These authors also contributed equally to this work.
Abstract
Background
Various types of near work have been suggested to promote the incidence and progression of myopia, while outdoor activity appears to prevent or retard myopia. However, there is a lack of consensus on how to interpret these results and translate them into effective inter-vention strategies. This study examined the association between visual acuity and time allo-cated to various activities among school-going children.
Methods
Population-based survey of 19,934 students in grade 4 and 5 from 252 randomly selected rural primary schools in Northwest China in September 2012. This survey measured visual acuity and collected self-reported data on time spent outdoors and time spent doing various types of near activities.
Results
Prolonged (>60 minutes/day) computer usage (-0.025 LogMAR units, P = .011) and smart-phone usage (-0.041 LogMAR units, P = .001) were significantly associated with greater refractive error, while television viewing and after-school study were not. For time spent out-doors, only time around midday was significantly associated with better uncorrected visual acuity. Compared to children who reported no midday time outdoors, those who spent time outdoors at midday for 31–60 minutes or more than 60 minutes had better uncorrected visual acuity by 0.016 LogMAR units (P = .014) and 0.016 units (P = .042), respectively. a1111111111
a1111111111 a1111111111 a1111111111 a1111111111
OPEN ACCESS
Citation: Guan H, Yu NN, Wang H, Boswell M, Shi Y, Rozelle S, et al. (2019) Impact of various types of near work and time spent outdoors at different times of day on visual acuity and refractive error among Chinese school-going children. PLoS ONE 14(4): e0215827.https://doi.org/10.1371/journal. pone.0215827
Editor: Yingfeng Zheng, Sun Yat-Sen University Zhongshan Ophthalmic Center, CHINA
Received: October 17, 2018
Accepted: April 9, 2019
Published: April 26, 2019
Copyright:©2019 Guan et al. This is an open access article distributed under the terms of the
Creative Commons Attribution License, which permits unrestricted use, distribution, and reproduction in any medium, provided the original author and source are credited.
Data Availability Statement: All relevant data are available from the Harvard Dataverse,https://doi. org/10.7910/DVN/VRJXIG.
Conclusions
Use of smart phones and computers were associated with declines in children’s vision, while television viewing was not. Statistically significant associations between outdoor time at midday and reduced myopia may support the hypothesis that light intensity plays a role in the protective effects of outdoor time.
Introduction
Various types of near work[1–4] have been suggested to promote the incidence and progres-sion of myopia[2,5–8], while outdoor activity appears to prevent or retard myopia[9]. How-ever, there is a lack of consensus on how to interpret these results and to translate them into effective intervention strategies[10–14].
One difficulty lies in differentiating the direct effects of more time spent on one activity, as well as the substitution effects of having less time left for other activities[10]. Spending more time outdoors may reduce myopia because children spend less time on near work, while spending more time on near work may exacerbate myopia. Attempts have been made to account for this difficulty in a few studies, but it remains relevant to interpreting the body of literature on the impact of time allocation. Another difficulty lies in elucidating the effect on myopia of different factors underlying an activity. For example, time spent outdoors may lead both to increased light exposure and a tendency to focus on more distant objects, each of which might potentially reduce myopia risk.
The current study reports data from a large population-based survey of rural primary school students in Northwest China, during which visual acuity was measured and a widely-used form[15] was utilized to collect self-reported data on time spent outdoors and in various types of near activities.
We used a diary approach to collect self-reported data on time spent outdoors; this not only allowed us to identify potential substitution effects, but also to distinguish between time spent outdoors before school, around midday, and after school in order to test the hypothesis that brighter light, rather than a tendency to focus at greater distance, is responsible for the protec-tive effect of outdoor activities against myopia[16]. This is because the level of illumination from the sun is strongest around midday, and weaker in the morning and late afternoon hours before or after school, while the tendency to focus at greater distance is presumably unchanged throughout the day.
This paper also examines the association between myopia and uncorrected visual acuity, and between myopia and various types of near activities, including schoolwork and the use of smartphones, computers and televisions, in order to guide potential interventions to reduce the visually-harmful impact of such activities.
Methods
Setting and sampling
This study utilizes data collected during a randomized trial of glasses provision on educational outcomes among 19,934 students at 252 primary schools in Northwest China, in the fall of 2012.
Our sample schools are located in A prefecture in G province and B Prefecture in S prov-ince in northwest of China. We obtained a list of all 435 primary schools in the two prefectures from local education bureaus. For logistical reasons we excluded those with fewer than 50 or
role in the design and conduct of the study; collection, management, analysis, and interpretation of the data; preparation, review, or approval of the manuscript; and decision to submit the manuscript for publication.
more than 150 students in the fourth and fifth grade combined (19% of sample frame). This is because screening at the larger schools could not be reliably completed in a day, which would have interfered with the screening schedule, whereas smaller schools would be expected to have fewer than 10 children requiring glasses, below our power requirements. We randomly selected one school from each township in the sample, and within each school we randomly selected one class in each of the fourth and fifth grades (likely age range 9–12 years). All 19,934 students in these 252 schools completed a detailed questionnaire concerning potential risk fac-tors for myopia, including weekly time spent in near activities and time spent outdoors.
Institutional Review Boards at Stanford University and Zhongshan Ophthalmic Center (ZOC, Sun Yat-sen University, Guangzhou, China) approved the research protocol in full, and the principles of the Declaration of Helsinki were followed throughout. Written informed con-sent was obtained from at least one parent for all child participants.
Assessment of Visual Acuity (VA), refraction, and myopia
In each school, a nurse and staff assistant, who had been trained by optometrists from ZOC, carried out visual acuity (VA) screening for all selected students to determine eligibility for the original trial. In a well-lighted indoor space at each school, children underwent assessment of uncorrected VA (UCVA) in each eye separately at 4 meters, using an Early Treatment Diabetic Retinopathy Study (ETDRS) chart (Precision Vision, La Salle, Illinois, USA)[15]. If a child cor-rectly identified at least 4 of 5 optotypes on the top 6/60 line, s/he was examined on the 6/30 line, the 6/15 line, and then line by line to 6/3. When a student failed a line, the lines above were tested successively until the child correctly identified 4 of 5 optotypes; the VA for an eye was defined as the lowest line read. For cases in which a student could not correctly read the top line, visual acuity was tested as above at 1 meter, with the measured VA divided by 4. VA was expressed during data analysis using LogMAR, the negative base-10 logarithm of the Mini-mum Angle of Resolution.
If a child’s VA was�6/12 in either eye, cycloplegia was applied with up to 3 drops of cyclo-pentolate 1%, and a refractionist, previously trained by ZOC’s experienced pediatric optome-trists, carried out automated refraction (Topcon KR 8900; Tokyo, Japan) with subjective refinement in each eye separately. Refractive error was recorded as the spherical equivalent (SE, spherical power +½the cylindrical power). Myopia was defined as VA�6/12 and SE
�-0.5D in at least one eye.
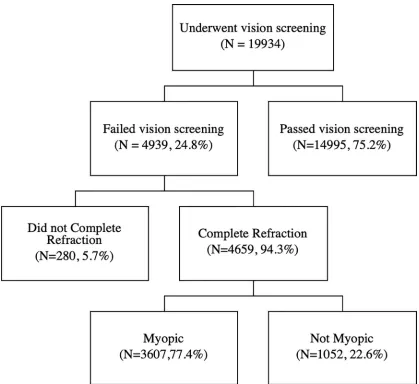
A total of 19934 students underwent vision screening, 4939 (24.8%) of them failed. Among these who failed the vision screening, 280 (5.7%) students did not complete refraction due to absence on the day our optometrists team conducted cycloplegic refraction in school. The remaining 4659 (94.3%) completed cycloplegic refraction. Students that did not complete cycloplegic refraction and those who did were not significantly different with regard to indi-vidual characteristics or time allocation variables.
Among the 4659 (94.3%) students that completed cycloplegic refraction, 1052 (22.6%) of them were not diagnosed with myopia due to visual acuity not being correctable to 6/12 in at least one eye with refraction, due to amblyopia or other non-refractive disorders. These chil-dren were referred to higher level hospitals (prefectural and municipal facilities) for treatment. In our analysis, we define these children as not myopic, because their vision could not be improved with refraction.Fig 1presents a flowchart of the participants in this study.
Assessment of self-reported time spent in near activities and outdoors
television viewing and after-school study), and time spent outdoors before school, around midday and after school. Reports of time spent on various activities at different periods in the day were categorized as follows: 0 minutes, 1 to 30 minutes, 31 to 60 minutes and>60 minutes.
Covariates
Our questionnaire also collected additional information potentially related to myopia, includ-ing grade (4thor 5th), age, gender, family wealth, migration status of each parent, parental edu-cation, child’s main residence (home, school dormitory, relative’s home, etc.), and province. Family wealth was calculated based on a parental questionnaire that asked about ownership of 13 selected items, summing their values as listed in the China Rural Household Survey Year-book (Department of Rural Surveys, National Bureau of Statistics of China, 2013). S province’s GDP per capita of USD 6108 ranked 14thamong China’s administrative regions in 2012, and was very similar to that for the country as a whole (USD 6091) in the same year, while G prov-ince was the second-poorest provprov-ince in the country (per capita GDP of USD 3100)[17].
Fig 1. Flowchart of the participants. (A)19934 students underwent vision screening,4939 (24.8%) of them failed, (B) 4659 (94.3%)
students that completed cycloplegic refraction, (C) 3607 (77.4%) were diagnosed with myopia.
Higher income is a risk factor for myopia[13], and thus province of residence was explored as a potential determinant of VA and refractive error.
Statistical methods
Mean UCVA (LogMAR averaged over two eyes, with its 95% Confidence Interval) and myopia prevalence are reported for children stratified by various demographic and behavioral factors. The impact of time allocation and other variables on UCVA in cross-sectional fashion were assessed using Generalized Estimating Equation (GEE) regression models, which adjusted for the correlation between the two eyes of each child and between children in the same school. In the multivariate model (full regression model), to improve the efficiency of the estimation, we included variables which were statistically significant associated with visual acuity and myopia (age, sex, family wealth, parental migrant status, parental education, child’s residence). Missing observations, which constituted a small proportion of the data, were excluded. For statistical interference, robust standard errors adjusted for clustering at the school level were used. Simi-larly, we constructed logistic models with outcome defined as the presence of myopia and included the same potential explanatory variables. All analyses were performed using Stata 14.0 (StataCorp, College Station, Texas, USA).
Results
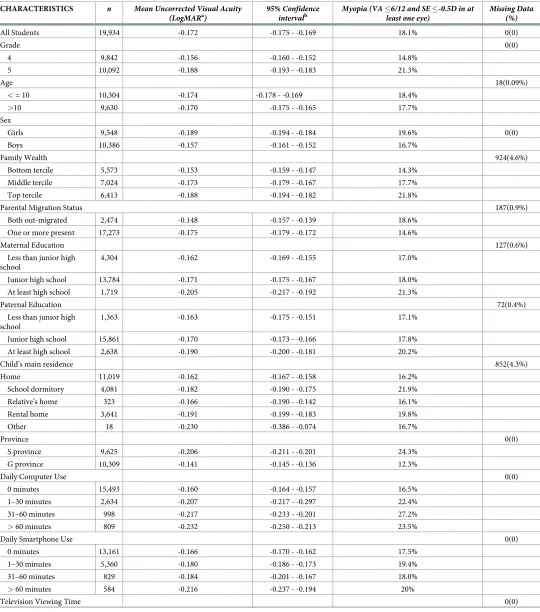
Among the 19,934 children in our study (mean age 10.6 +/-1.15 years, 48% girls), the mean LogMAR UCVA was -0.172, equivalent to a Snellen fraction of approximately 6/9. A total of 4939 children (24.8%) failed vision testing, and among them, 4659 (94.3%) underwent refrac-tion. The prevalence of myopia was 18.1% (3607 of 19,934 students).
Students in grade 5, girls, those from wealthier families, those with at least one parent at home, those with better-educated patents and S province residents had significantly (P<.001) worse UCVA and greater myopia. Greater computer use (P<.001), smartphone use, televi-sion viewing, and after-school study as well as less midday outdoor time, were also associated with lower UCVA and greater myopia prevalence (P<.001). Before- and after-school outdoor time were unassociated with UCVA and myopia (Table 1).
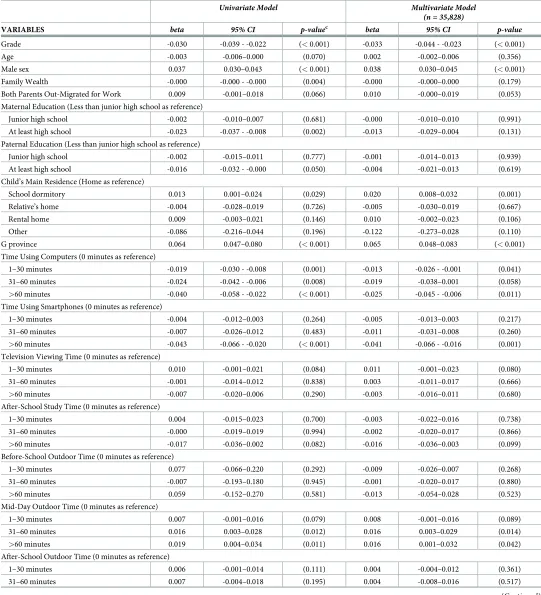
In multivariate regression models (Table 2), we found that using a computer 1 to 30 minutes and 31 to 60 minutes per day were associated with worse UCVA (0.019 LogMAR units, P = .001 and 0.024 LogMAR units, P = .008), while greater than 60 minutes of daily use was associated with a greater reduction in UCVA (0.040 LogMAR units, P<0.001). Using smartphones for 1 to 30 minutes and 31 to 60 minutes per day was uncorrelated with visual acuity, but use for greater than 60 minutes was associated with reduced UCVA (0.043 LogMAR units, P<0.001). Neither television viewing nor after-school study were significantly associated with declines in UCVA.
Our logistic regression models with myopia as the outcome (Table 2) showed consistent results for computer use and increased myopia risk, though smartphone usage was not signifi-cantly associated with visual acuity. As with the model using UCVA, television viewing and after-school study were unassociated with myopia risk. Such findings are consistent with those found in the literature[18–22].
Table 1. Visual acuity by student characteristics.
CHARACTERISTICS n Mean Uncorrected Visual Acuity (LogMARa)
95% Confidence intervalb
Myopia (VA�6/12 and SE�-0.5D in at least one eye)
Missing Data (%)
All Students 19,934 -0.172 -0.175 - -0.169 18.1% 0(0)
Grade 0(0)
4 9,842 -0.156 -0.160 - -0.152 14.8%
5 10,092 -0.188 -0.193 - -0.183 21.3%
Age 18(0.09%)
<= 10 10,304 -0.174 -0.178 - -0.169 18.4%
>10 9,630 -0.170 -0.175 - -0.165 17.7%
Sex
Girls 9,548 -0.189 -0.194 - -0.184 19.6% 0(0)
Boys 10,386 -0.157 -0.161 - -0.152 16.7%
Family Wealth 924(4.6%)
Bottom tercile 5,573 -0.153 -0.159 - -0.147 14.3%
Middle tercile 7,024 -0.173 -0.179 - -0.167 17.7%
Top tercile 6,413 -0.188 -0.194 - -0.182 21.8%
Parental Migration Status 187(0.9%)
Both out-migrated 2,474 -0.148 -0.157 - -0.139 18.6%
One or more present 17,273 -0.175 -0.179 - -0.172 14.6%
Maternal Education 127(0.6%)
Less than junior high school
4,304 -0.162 -0.169 - -0.155 17.0%
Junior high school 13,784 -0.171 -0.175 - -0.167 18.0%
At least high school 1,719 -0.205 -0.217 - -0.192 21.3%
Paternal Education 72(0.4%)
Less than junior high school
1,363 -0.163 -0.175 - -0.151 17.1%
Junior high school 15,861 -0.170 -0.173 - -0.166 17.8%
At least high school 2,638 -0.190 -0.200 - -0.181 20.2%
Child’s main residence 852(4.3%)
Home 11,019 -0.162 -0.167 - -0.158 16.2%
School dormitory 4,081 -0.182 -0.190 - -0.175 21.9%
Relative’s home 323 -0.166 -0.190 - -0.142 16.1%
Rental home 3,641 -0.191 -0.199 - -0.183 19.8%
Other 18 -0.230 -0.386 - -0.074 16.7%
Province 0(0)
S province 9,625 -0.206 -0.211 - -0.201 24.3%
G province 10,309 -0.141 -0.145 - -0.136 12.3%
Daily Computer Use 0(0)
0 minutes 15,493 -0.160 -0.164 - -0.157 16.5%
1–30 minutes 2,634 -0.207 -0.217 - -0.297 22.4%
31–60 minutes 998 -0.217 -0.233 - -0.201 27.2%
>60 minutes 809 -0.232 -0.250 - -0.213 23.5%
Daily Smartphone Use 0(0)
0 minutes 13,161 -0.166 -0.170 - -0.162 17.5%
1–30 minutes 5,360 -0.180 -0.186 - -0.173 19.4%
31–60 minutes 829 -0.184 -0.201 - -0.167 18.0%
>60 minutes 584 -0.216 -0.237 - -0.194 20%
Television Viewing Time 0(0)
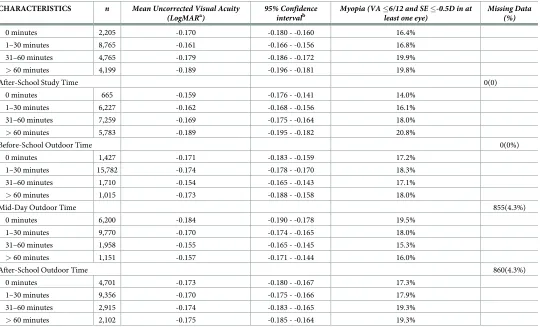
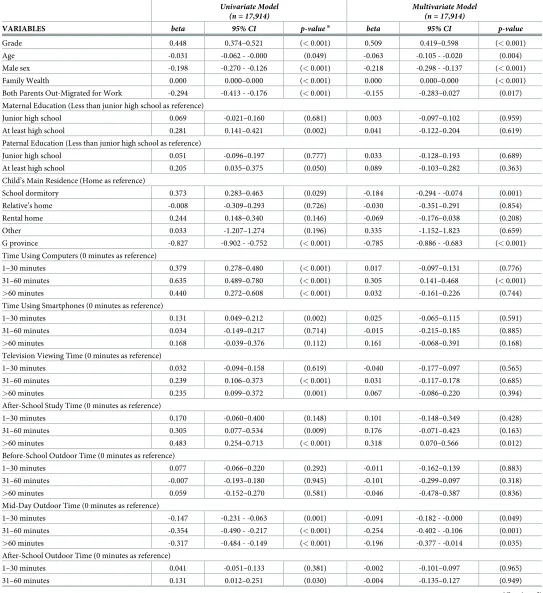
these differences for other times of day were not statistically significant (Table 2). Results for myopia risk were consistent: only spending more time outdoors at midday had a significant protective effect (Table 3).
Regarding other potential correlates of uncorrected vision and myopia, after controlling for school grade, there was no association between older age and UCVA. Girls had greater risk of worse vision and myopia than boys (Tables2and3). Having both parents out-migrated for work significantly increased the risk of myopia in multivariate models (OR -0.155, P = .017) (Table 3), but was not significantly associated with UCVA (Table 2).
None of the parental education indicators were associated with UCVA or myopia risk in multivariate models, though either parent finishing high school was significantly associated with worse UCVA in the univariate analysis. Compared with living at home, living in a school dormitory was negatively correlated with UCVA and myopia, while other residence types were unassociated with vision or refractive error (Tables2and3).
Discussion
Our models of UCVA and myopia both point to consistent conclusions that time using com-puters and smartphones is associated with more myopic refractive error, while television
Table 1. (Continued)
CHARACTERISTICS n Mean Uncorrected Visual Acuity (LogMARa
)
95% Confidence
intervalb Myopia (VA�6/12 and SE�-0
.5D in at least one eye)
Missing Data (%)
0 minutes 2,205 -0.170 -0.180 - -0.160 16.4%
1–30 minutes 8,765 -0.161 -0.166 - -0.156 16.8%
31–60 minutes 4,765 -0.179 -0.186 - -0.172 19.9%
>60 minutes 4,199 -0.189 -0.196 - -0.181 19.8%
After-School Study Time 0(0)
0 minutes 665 -0.159 -0.176 - -0.141 14.0%
1–30 minutes 6,227 -0.162 -0.168 - -0.156 16.1%
31–60 minutes 7,259 -0.169 -0.175 - -0.164 18.0%
>60 minutes 5,783 -0.189 -0.195 - -0.182 20.8%
Before-School Outdoor Time 0(0%)
0 minutes 1,427 -0.171 -0.183 - -0.159 17.2%
1–30 minutes 15,782 -0.174 -0.178 - -0.170 18.3%
31–60 minutes 1,710 -0.154 -0.165 - -0.143 17.1%
>60 minutes 1,015 -0.173 -0.188 - -0.158 18.0%
Mid-Day Outdoor Time 855(4.3%)
0 minutes 6,200 -0.184 -0.190 - -0.178 19.5%
1–30 minutes 9,770 -0.170 -0.174 - -0.165 18.0%
31–60 minutes 1,958 -0.155 -0.165 - -0.145 15.3%
>60 minutes 1,151 -0.157 -0.171 - -0.144 16.0%
After-School Outdoor Time 860(4.3%)
0 minutes 4,701 -0.173 -0.180 - -0.167 17.3%
1–30 minutes 9,356 -0.170 -0.175 - -0.166 17.9%
31–60 minutes 2,915 -0.174 -0.183 - -0.165 19.3%
>60 minutes 2,102 -0.175 -0.185 - -0.164 19.3%
a LogMAR = negative of the base-10 log of the Minimum Angle of Resolution b Based on LogMAR averaged over two eyes for each individual
Table 2. Effects of various factors on visual acuity (LogMAR of both eyesa) in Generalized Estimating Equations (GEE)bregression models.
Univariate Model Multivariate Model (n = 35,828)
VARIABLES beta 95% CI p-valuec
beta 95% CI p-value
Grade -0.030 -0.039 - -0.022 (<0.001) -0.033 -0.044 - -0.023 (<0.001)
Age -0.003 -0.006–0.000 (0.070) 0.002 -0.002–0.006 (0.356)
Male sex 0.037 0.030–0.043 (<0.001) 0.038 0.030–0.045 (<0.001)
Family Wealth -0.000 -0.000 - -0.000 (0.004) -0.000 -0.000–0.000 (0.179)
Both Parents Out-Migrated for Work 0.009 -0.001–0.018 (0.066) 0.010 -0.000–0.019 (0.053)
Maternal Education (Less than junior high school as reference)
Junior high school -0.002 -0.010–0.007 (0.681) -0.000 -0.010–0.010 (0.991)
At least high school -0.023 -0.037 - -0.008 (0.002) -0.013 -0.029–0.004 (0.131)
Paternal Education (Less than junior high school as reference)
Junior high school -0.002 -0.015–0.011 (0.777) -0.001 -0.014–0.013 (0.939)
At least high school -0.016 -0.032 - -0.000 (0.050) -0.004 -0.021–0.013 (0.619)
Child’s Main Residence (Home as reference)
School dormitory 0.013 0.001–0.024 (0.029) 0.020 0.008–0.032 (0.001)
Relative’s home -0.004 -0.028–0.019 (0.726) -0.005 -0.030–0.019 (0.667)
Rental home 0.009 -0.003–0.021 (0.146) 0.010 -0.002–0.023 (0.106)
Other -0.086 -0.216–0.044 (0.196) -0.122 -0.273–0.028 (0.110)
G province 0.064 0.047–0.080 (<0.001) 0.065 0.048–0.083 (<0.001)
Time Using Computers (0 minutes as reference)
1–30 minutes -0.019 -0.030 - -0.008 (0.001) -0.013 -0.026 - -0.001 (0.041)
31–60 minutes -0.024 -0.042 - -0.006 (0.008) -0.019 -0.038–0.001 (0.058)
>60 minutes -0.040 -0.058 - -0.022 (<0.001) -0.025 -0.045 - -0.006 (0.011)
Time Using Smartphones (0 minutes as reference)
1–30 minutes -0.004 -0.012–0.003 (0.264) -0.005 -0.013–0.003 (0.217)
31–60 minutes -0.007 -0.026–0.012 (0.483) -0.011 -0.031–0.008 (0.260)
>60 minutes -0.043 -0.066 - -0.020 (<0.001) -0.041 -0.066 - -0.016 (0.001)
Television Viewing Time (0 minutes as reference)
1–30 minutes 0.010 -0.001–0.021 (0.084) 0.011 -0.001–0.023 (0.080)
31–60 minutes -0.001 -0.014–0.012 (0.838) 0.003 -0.011–0.017 (0.666)
>60 minutes -0.007 -0.020–0.006 (0.290) -0.003 -0.016–0.011 (0.680)
After-School Study Time (0 minutes as reference)
1–30 minutes 0.004 -0.015–0.023 (0.700) -0.003 -0.022–0.016 (0.738)
31–60 minutes -0.000 -0.019–0.019 (0.994) -0.002 -0.020–0.017 (0.866)
>60 minutes -0.017 -0.036–0.002 (0.082) -0.016 -0.036–0.003 (0.099)
Before-School Outdoor Time (0 minutes as reference)
1–30 minutes 0.077 -0.066–0.220 (0.292) -0.009 -0.026–0.007 (0.268)
31–60 minutes -0.007 -0.193–0.180 (0.945) -0.001 -0.020–0.017 (0.880)
>60 minutes 0.059 -0.152–0.270 (0.581) -0.013 -0.054–0.028 (0.523)
Mid-Day Outdoor Time (0 minutes as reference)
1–30 minutes 0.007 -0.001–0.016 (0.079) 0.008 -0.001–0.016 (0.089)
31–60 minutes 0.016 0.003–0.028 (0.012) 0.016 0.003–0.029 (0.014)
>60 minutes 0.019 0.004–0.034 (0.011) 0.016 0.001–0.032 (0.042)
After-School Outdoor Time (0 minutes as reference)
1–30 minutes 0.006 -0.001–0.014 (0.111) 0.004 -0.004–0.012 (0.361)
31–60 minutes 0.007 -0.004–0.018 (0.195) 0.004 -0.008–0.016 (0.517)
viewing and after-school study are not. Evidence about the impact of smart phone and com-puter use on myopia has been inconsistent[13,14,23,24]. It may be that, as prevalence of use of these devices among school-age children continues to rise in China and elsewhere, the associa-tion is becoming clearer. It should be noted, though, that in the present cohort, daily use of both smartphones and computers was less common than the frequency of television watching and after-school study. Given the greater expected viewing distance for television, our failure to find an association with visual acuity or myopia, as opposed to computers and smartphones (generally used at closer distances), is consistent with the prevailing hypothesis that viewing distance plays a role in the influence of near work on myopia, due perhaps to greater periph-eral defocus at closer working distance[25]. We speculate that the lack of an observed associa-tion between after-school study time and myopia or decline in vision might be due to
afternoon study and tutorial classes, which some children may not have considered as “reading after school”. Once again, evidence on the impact of reading and studying on myopia inci-dence and progression has been somewhat inconsistent[13,14].
Recent trial evidence strongly suggests a causal association between increased time out-doors and decreased incidence of myopia[8,9]. However, the mechanism for the protective effect of outdoor time is still not definitively understood, with both increased exposure to bright light and decreased time focusing at near targets having been proposed. Our finding that statistically significant associations between outdoor time and reduced myopia were found only for the midday interval, and not before or after school, may support the hypothesis that light intensity plays a crucial role in the protective effects of outdoor time, corroborating results from animal experiments[26,27]. Time of day has not previously been identified as an important aspect when considering outdoor time as a mediator of myopia risk. Parts of China, including the current settings in our sample province, are at similar latitudes to areas with high sun exposure[28]; however, it may be that other factors such as weather and air pollution [29] partially block sunlight in China, requiring exposure at the brightest midday hours for protection against UCVA and leading in part to China’s high myopia prevalence[30,31].
Our findings suggest a potential anti-myopia intervention of encouraging more outdoor activities during the noon hours when illumination is greatest. Such strategies would be practi-cal in China, due to the widespread practice of offering a noon break of up to 2 hours in Chi-nese schools, during which many children return home to rest. Strategies to exploit this noon break in order to increase sunlight exposure would have to contend with the cultural norm of sleeping during this time, and would also need to address issues such as protecting children’s skin from bright sunlight. Further evidence of the greater effectiveness of noon-time outdoor activity in protecting against myopia is needed in other settings.
Strengths of this study include its population-based nature and large size. The “diary” approach explored the effects of time spent on a variety of activities, including various types of near work and outdoor activities at different times of day. This alleviates concerns of
Table 2. (Continued)
Univariate Model Multivariate Model (n = 35,828)
VARIABLES beta 95% CI p-valuec beta 95% CI p-value
>60 minutes 0.009 -0.003–0.021 (0.136) 0.005 -0.007–0.018 (0.410)
a
LogMAR = negative of the base-10 log of the Minimum Angle of Resolution
b
GEE adjusts for the correlation between eyes of a child.
c
Confidence intervals andp-values are based on robust standard errors adjusted for clustering at the school level.
Table 3. Effects of various factors on myopia (VA�6/12 and SE<= -0.5D in at least one eye) in logistic regression models.
Univariate Model (n = 17,914)
Multivariate Model (n = 17,914)
VARIABLES beta 95% CI p-valuea
beta 95% CI p-value
Grade 0.448 0.374–0.521 (<0.001) 0.509 0.419–0.598 (<0.001)
Age -0.031 -0.062 - -0.000 (0.049) -0.063 -0.105 - -0.020 (0.004)
Male sex -0.198 -0.270 - -0.126 (<0.001) -0.218 -0.298 - -0.137 (<0.001)
Family Wealth 0.000 0.000–0.000 (<0.001) 0.000 0.000–0.000 (<0.001)
Both Parents Out-Migrated for Work -0.294 -0.413 - -0.176 (<0.001) -0.155 -0.283–0.027 (0.017)
Maternal Education (Less than junior high school as reference)
Junior high school 0.069 -0.021–0.160 (0.681) 0.003 -0.097–0.102 (0.959)
At least high school 0.281 0.141–0.421 (0.002) 0.041 -0.122–0.204 (0.619)
Paternal Education (Less than junior high school as reference)
Junior high school 0.051 -0.096–0.197 (0.777) 0.033 -0.128–0.193 (0.689)
At least high school 0.205 0.035–0.375 (0.050) 0.089 -0.103–0.282 (0.363)
Child’s Main Residence (Home as reference)
School dormitory 0.373 0.283–0.463 (0.029) -0.184 -0.294 - -0.074 (0.001)
Relative’s home -0.008 -0.309–0.293 (0.726) -0.030 -0.351–0.291 (0.854)
Rental home 0.244 0.148–0.340 (0.146) -0.069 -0.176–0.038 (0.208)
Other 0.033 -1.207–1.274 (0.196) 0.335 -1.152–1.823 (0.659)
G province -0.827 -0.902 - -0.752 (<0.001) -0.785 -0.886 - -0.683 (<0.001)
Time Using Computers (0 minutes as reference)
1–30 minutes 0.379 0.278–0.480 (<0.001) 0.017 -0.097–0.131 (0.776)
31–60 minutes 0.635 0.489–0.780 (<0.001) 0.305 0.141–0.468 (<0.001)
>60 minutes 0.440 0.272–0.608 (<0.001) 0.032 -0.161–0.226 (0.744)
Time Using Smartphones (0 minutes as reference)
1–30 minutes 0.131 0.049–0.212 (0.002) 0.025 -0.065–0.115 (0.591)
31–60 minutes 0.034 -0.149–0.217 (0.714) -0.015 -0.215–0.185 (0.885)
>60 minutes 0.168 -0.039–0.376 (0.112) 0.161 -0.068–0.391 (0.168)
Television Viewing Time (0 minutes as reference)
1–30 minutes 0.032 -0.094–0.158 (0.619) -0.040 -0.177–0.097 (0.565)
31–60 minutes 0.239 0.106–0.373 (<0.001) 0.031 -0.117–0.178 (0.685)
>60 minutes 0.235 0.099–0.372 (0.001) 0.067 -0.086–0.220 (0.394)
After-School Study Time (0 minutes as reference)
1–30 minutes 0.170 -0.060–0.400 (0.148) 0.101 -0.148–0.349 (0.428)
31–60 minutes 0.305 0.077–0.534 (0.009) 0.176 -0.071–0.423 (0.163)
>60 minutes 0.483 0.254–0.713 (<0.001) 0.318 0.070–0.566 (0.012)
Before-School Outdoor Time (0 minutes as reference)
1–30 minutes 0.077 -0.066–0.220 (0.292) -0.011 -0.162–0.139 (0.883)
31–60 minutes -0.007 -0.193–0.180 (0.945) -0.101 -0.299–0.097 (0.318)
>60 minutes 0.059 -0.152–0.270 (0.581) -0.046 -0.478–0.387 (0.836)
Mid-Day Outdoor Time (0 minutes as reference)
1–30 minutes -0.147 -0.231 - -0.063 (0.001) -0.091 -0.182 - -0.000 (0.049)
31–60 minutes -0.354 -0.490 - -0.217 (<0.001) -0.254 -0.402 - -0.106 (0.001)
>60 minutes -0.317 -0.484 - -0.149 (<0.001) -0.196 -0.377 - -0.014 (0.035)
After-School Outdoor Time (0 minutes as reference)
1–30 minutes 0.041 -0.051–0.133 (0.381) -0.002 -0.101–0.097 (0.965)
31–60 minutes 0.131 0.012–0.251 (0.030) -0.004 -0.135–0.127 (0.949)
substitution effects as confounding factors. There is also a clear distinction between noon-time outdoor activity and other outdoor activities in our data.
Some caution is necessary in interpreting our results. Self-reported recall data, as adopted by most studies of visual acuity[3], depend on the reliability of informants[32–34]; this issue may be greater when younger children are involved, as in the present case. Given the resource limitations to researchers following a large cohort of young children for long periods of time, the self-reported recall was determined to be the best method for our study’s visual acuity data collection. Parents’ refraction data are often included to explain the incidence and progression of myopia[1], while resources to refract parents are rarely available in studies of children’s refractive error, glasses wear can be used as surrogate for myopia in high resource settings, but this is less useful in rural China, where few who need glasses wear them. Though a large num-ber of schools (over 250) were involved, all were selected from two adjacent areas in western China, and application of our findings to other settings must be made with caution.
Even with these limitations, our findings offer a novel evidence supporting the protective effects of increased outdoor time is protective against myopia. If further work confirms our assumption that higher levels of exposure to brighter lights during noontime is an effective method of myopia prevention, this may open the door to entirely-new myopia prevention strategies, such as the use of bright artificial lights in classrooms and various architectural accommodations to increase children’s exposure to higher levels of natural light.
Supporting information
S1 File. Related survey questions.
(ZIP)
Author Contributions
Conceptualization: Ning Neil Yu, Nathan Congdon.
Formal analysis: Hongyu Guan, Ning Neil Yu.
Funding acquisition: Matthew Boswell, Yaojiang Shi, Scott Rozelle, Nathan Congdon.
Investigation: Ning Neil Yu, Matthew Boswell, Yaojiang Shi, Scott Rozelle, Nathan Congdon.
Methodology: Huan Wang, Scott Rozelle, Nathan Congdon.
Project administration: Hongyu Guan, Huan Wang, Matthew Boswell.
Resources: Matthew Boswell, Scott Rozelle.
Supervision: Yaojiang Shi.
Writing – original draft: Hongyu Guan, Ning Neil Yu.
Writing – review & editing: Hongyu Guan, Huan Wang, Matthew Boswell, Nathan Congdon. Table 3. (Continued)
Univariate Model (n = 17,914)
Multivariate Model (n = 17,914)
VARIABLES beta 95% CI p-valuea beta 95% CI p-value
>60 minutes 0.131 -0.001–0.263 (0.053) -0.013 -0.159–0.134 (0.866)
a Confidence intervals and p-values are based on robust standard errors adjusted for clustering at the school level.
References
1. Rose KA, Morgan IG, Smith W, Burlutsky G, Mitchell P, Saw S-M. Myopia, lifestyle, and schooling in students of Chinese ethnicity in Singapore and Sydney. Arch Ophthalmol. 2008; 126: 527–530.https:// doi.org/10.1001/archopht.126.4.527PMID:18413523
2. French AN, Morgan IG, Mitchell P, Rose KA. Risk Factors for Incident Myopia in Australian Schoolchil-dren. Ophthalmology. 2013; 120: 2100–2108.https://doi.org/10.1016/j.ophtha.2013.02.035PMID:
23672971
3. Ramamurthy D, Lin Chua SY, Saw S-M. A review of environmental risk factors for myopia during early life, childhood and adolescence: Environmental risk factors for myopia Ramamurthy, Chua and Saw. Clinical and Experimental Optometry. 2015; 98: 497–506.https://doi.org/10.1111/cxo.12346PMID:
26497977
4. Zhou Z, Ma X, Yi H, Pang X, Shi Y, Chen Q, et al. Factors Underlying Different Myopia Prevalence between Middle- and Low-income Provinces in China. Ophthalmology. 2015; 122: 1060–1062.https:// doi.org/10.1016/j.ophtha.2014.12.019PMID:25660492
5. Rose KA, Morgan IG, Ip J, Kifley A, Huynh S, Smith W, et al. Outdoor Activity Reduces the Prevalence of Myopia in Children. Ophthalmology. 2008; 115: 1279–1285.https://doi.org/10.1016/j.ophtha.2007. 12.019PMID:18294691
6. Guo Y, Liu LJ, Xu L, Lv YY, Tang P, Feng Y, et al. Outdoor Activity and Myopia among Primary Students in Rural and Urban Regions of Beijing. Ophthalmology. 2013; 120: 277–283.https://doi.org/10.1016/j. ophtha.2012.07.086PMID:23098368
7. Guo Y, Liu LJ, Tang P, Lv YY, Feng Y, Xu L, et al. Outdoor activity and myopia progression in 4-year fol-low-up of Chinese primary school children: The Beijing Children Eye Study. Frishman L, editor. PLOS ONE. 2017; 12: e0175921.https://doi.org/10.1371/journal.pone.0175921PMID:28448513
8. He M, Xiang F, Zeng Y, Mai J, Chen Q, Zhang J, et al. Effect of Time Spent Outdoors at School on the Development of Myopia Among Children in China: A Randomized Clinical Trial. JAMA. 2015; 314: 1142.https://doi.org/10.1001/jama.2015.10803PMID:26372583
9. Wu P-C, Tsai C-L, Wu H-L, Yang Y-H, Kuo H-K. Outdoor Activity during Class Recess Reduces Myopia Onset and Progression in School Children. Ophthalmology. 2013; 120: 1080–1085.https://doi.org/10. 1016/j.ophtha.2012.11.009PMID:23462271
10. Morgan I, Rose K. How genetic is school myopia? Progress in Retinal and Eye Research. 2005; 24: 1– 38.https://doi.org/10.1016/j.preteyeres.2004.06.004PMID:15555525
11. Wojciechowski R. Nature and nurture: the complex genetics of myopia and refractive error. Clinical Genetics. 2011; 79: 301–320.https://doi.org/10.1111/j.1399-0004.2010.01592.xPMID:21155761 12. Day M, Duffy LA. Myopia and defocus: the current understanding. Scandinavian Journal of Optometry
and Visual Science. 2011; 4: 14.
13. Morgan IG, Ohno-Matsui K, Saw S-M. Myopia. The Lancet. 2012; 379: 1739–1748.https://doi.org/10. 1016/S0140-6736(12)60272-4
14. Goldschmidt E, Jacobsen N. Genetic and environmental effects on myopia development and progres-sion. Eye. 2014; 28: 126–133.https://doi.org/10.1038/eye.2013.254PMID:24357837
15. Ferris FL, Kassoff A, Bresnick GH, Bailey I. New visual acuity charts for clinical research. Am J Ophthal-mol. 1982; 94: 91–96. PMID:7091289
16. French AN, Ashby RS, Morgan IG, Rose KA. Time outdoors and the prevention of myopia. Experimen-tal Eye Research. 2013; 114: 58–68.https://doi.org/10.1016/j.exer.2013.04.018PMID:23644222 17. List of Chinese administrative divisions by GDP [Internet]. Wikipedia. 2018. Available:https://en.
wikipedia.org/w/index.php?title=List_of_Chinese_administrative_divisions_by_GDP&oldid=851283883
18. French AN, Morgan IG, Mitchell P, Rose KA. Patterns of myopigenic activities with age, gender and eth-nicity in Sydney schoolchildren. Ophthalmic Physiol Opt. 2013; 33: 318–328.https://doi.org/10.1111/ opo.12045PMID:23452023
19. Sewunet SA, Aredo KK, Gedefew M. Uncorrected refractive error and associated factors among pri-mary school children in Debre Markos District, Northwest Ethiopia. BMC Ophthalmol. 2014; 14: 95.
https://doi.org/10.1186/1471-2415-14-95PMID:25070579
20. You QS, Wu LJ, Duan JL, Luo YX, Liu LJ, Li X, et al. Factors associated with myopia in school children in China: the Beijing childhood eye study. PLoS ONE. 2012; 7: e52668.https://doi.org/10.1371/journal. pone.0052668PMID:23300738
22. Khader YS, Batayha WQ, Abdul-Aziz SMI, Al-Shiekh-Khalil MI. Prevalence and risk indicators of myo-pia among schoolchildren in Amman, Jordan. East Mediterr Health J. 2006; 12: 434–439. PMID:
17037714
23. Terasaki H, Yamashita T, Yoshihara N, Kii Y, Sakamoto T. Association of lifestyle and body structure to ocular axial length in Japanese elementary school children. BMC Ophthalmology. 2017;17.https://doi. org/10.1186/s12886-017-0414-6
24. Ferna´ndez-Montero A, Olmo-Jimenez JM, Olmo N, Bes-Rastrollo M, Galarraga L, Moreno-Montañe´ s J, et al. The impact of computer use in myopia progression: A cohort study in Spain. Preven-tive Medicine. 2015; 71: 67–71.https://doi.org/10.1016/j.ypmed.2014.12.005PMID:25524611 25. Smith EL. Optical treatment strategies to slow myopia progression: Effects of the visual extent of the
optical treatment zone. Experimental Eye Research. 2013; 114: 77–88.https://doi.org/10.1016/j.exer. 2012.11.019PMID:23290590
26. Ashby R. Animal Studies and the Mechanism of MyopiaVProtection by Light? Optometry and Vision Science. 2016; 93: 3.https://doi.org/10.1097/OPX.0000000000000757
27. Norton TT. What Do Animal Studies Tell Us about the Mechanism of MyopiaVProtection by Light? Optometry and Vision Science. 2016; 93: 3.https://doi.org/10.1097/OPX.0000000000000757 28. List of cities by sunshine duration [Internet]. Wikipedia. 2018. Available:https://en.wikipedia.org/w/
index.php?title=List_of_cities_by_sunshine_duration&oldid=855190230
29. Seinfeld JH, Pandis SN. Atmospheric Chemistry and Physics: From Air Pollution to Climate Change. Wiley; 2006.
30. He M, Huang W, Zheng Y, Huang L, Ellwein LB. Refractive error and visual impairment in school chil-dren in rural southern China. Ophthalmology. 2007; 114: 374–382.https://doi.org/10.1016/j.ophtha. 2006.08.020PMID:17123622
31. Yi H, Zhang L, Ma X, Congdon N, Shi Y, Pang X, et al. Poor vision among China’s rural primary school students: Prevalence, correlates and consequences. China Economic Review. 2015; 33: 247–262.
https://doi.org/10.1016/j.chieco.2015.01.004
32. Rah MJ, Mitchell GL, Mutti DO, Zadnik K. Levels of agreement between parents’ and children’s reports of near work. Ophthalmic Epidemiology. 2002; 9: 191–203.https://doi.org/10.1076/opep.9.3.191.1514
PMID:12045886
33. Kobayashi T, Boase J. No Such Effect? The Implications of Measurement Error in Self-Report Mea-sures of Mobile Communication Use. Communication Methods and MeaMea-sures. 2012; 6: 126–143.
https://doi.org/10.1080/19312458.2012.679243