Graphing Review
1. State the requested information about each of the following:
a) b)
Linear / Non-Linear Increasing / Decreasing
Outlier / No Outlier Linear / Non-Linear
Independent Variable: Temperature / Sales Increasing / Decreasing
Dependent Variable: Temperature / Sales Outlier / No Outlier
Trend: _______________________________ Trend:_______________________________
_______________________________ _______________________________
c) d)
Linear / Non-Linear Linear / Non-Linear
Increasing / Decreasing Increasing / Decreasing
Positive Slope / Negative Slope Positive Slope / Negative Slope
Direct Variation / Partial Variation Direct Variation / Partial Variation
X-Intercept: _________ X-Intercept: _________
e) C = 25n + 150 f) h = 70 – 5n g) A = 10n
Initial Value: ______ Initial Value: ______ Initial Value: ______
Rate of Change: ______ Rate of Change: ______ Rate of Change: ______
Variation: Direct / Partial Variation: Direct / Partial Variation: Direct / Partial
h) y = 3x – 7 i) y 7 x 4
10
j) y = 3x2 + 5
Linear / Non-Linear Linear / Non-Linear Linear / Non-Linear
Slope: ______ Slope: ______ Reasoning:
Y-Intercept: ______ Y-Intercept: ______
Parallel Slope: ______ Parallel Slope: ______
Perpendicular Slope: ______ Perpendicular Slope: ______
k) Worked Hours Earned Money l) X Y
0 50 -4 2
2 100 -2 4
4 150 0 8
6 200 2 16
8 250 4 32
Linear / Non-Linear Linear / Non-Linear
Initial Value: ______ Y-Intercept: ______
2. The scatter plot below shows the population of fruit flies in a lab over time.
Population of Fruit Flies
0 5 10 15 20 25 30 35 40 45 50
0 1 2 3 4 5 6 7 8 9 10 11 12 13 14 15 16 17 18 19 20
Days
N
u
m
b
er
o
f
F
lie
s
3. Determine the slope of the line that passes
through (6, -4) and (-3, -2). 4. Determine the slope of ½ that passes through y-intercept of a line with a (8, 3).
5. State the slope of a horizontal line.
6. State the equation of a horizontal line that passes through (5, 10).
7. State the slope of a vertical line.
8. State the equation of a vertical line that passes through (5, 10).
9. Graph the line y 4x 2 3
10. Determine the slope and y-intercept of the line 7x + 3y + 12 = 0.
11. Determine the equation of the line that passes through the points (–4, –2) and (2, 10).
a) State the trend.
b) Draw a line or curve of best fit on the graph.
c) Predict on which day there would be 27 flies.
d) Is part c) an example of
Graphing Review
1. Draw a 6 point scatter plot for each of the following:
a) Linear & Increasing b) Non-Linear & c) Linear with
Decreasing an Outlier
2. Determine whether each of the following is linear or non-linear. Show all of your work.
a) x y b) x y
1 2 1 5
2 8 2 10
3 16 3 15
4 26 4 20
3. The following graph shows the number of shots on goal vs. the number of goals scored.
a) What does the graph tell you about Player B?
b) State the co-ordinates of a point that represents a player who took more shots on goal than Player B, but scored fewer goals.
c) State the trend shown by the graph.
d) State the dependent variable. e) Predict the goals scored when there are 35 shots on goal. Is this interpolation or extrapolation?
Key Points
Linear
Points form a line.
Differences between
x and y-values are all the same.
Non Linear
Points make a curve
or have no pattern.
Differences between
x and y-values are not all the same.
Trend
The pattern shown
by the points.
Increasing
Points create an
upward trend.
Decreasing
Points create a
downward trend.
Outlier
A point that does not
fit with the trend of the rest of the points
Line of Best Fit
A line drawn to
approximate the trend shown by the graph.
Interpolation
A prediction made
inside of the data.
Extrapolation
A prediction made
outside of the data.
Independent Variable
The part of the
experiment that you have some control over.
Graphed on the
x-axis.
Dependent Variable
The part of the
experiment that you are interested in measuring.
Graphed on the
y-axis.
B
ANSWERS:
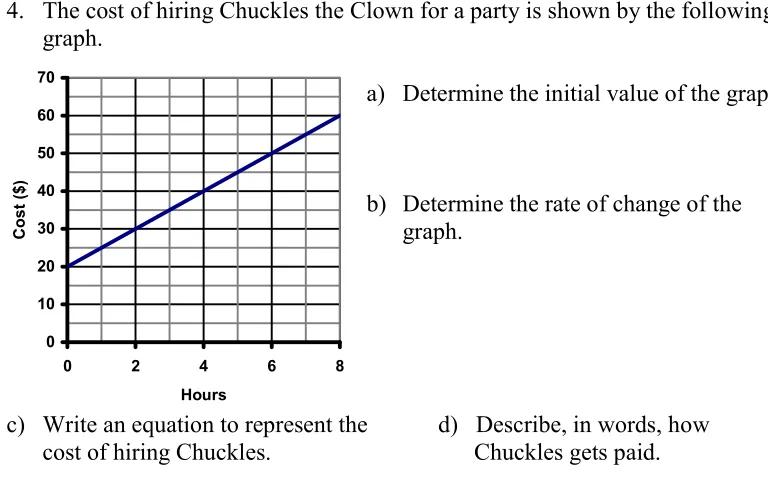
4. The cost of hiring Chuckles the Clown for a party is shown by the following graph.
a) Determine the initial value of the graph.
b) Determine the rate of change of the graph.
c) Write an equation to represent the d) Describe, in words, how cost of hiring Chuckles. Chuckles gets paid.
5. Determine the equation of the line that passes through (12, 17) and (18, 25).
6. Determine the equation of a line that is perpendicular to 2x
– 5y – 15 = 0 and passes
through (4, -8).
7. Graph the following lines and state the point of intersection.
y = 6x + 4 y = –½x – 9
Key Points
Initial Value (IV)
The starting amount or
cost.
Y-Intercept (b)
Point where graph
crosses the y-axis.
If equation is given,
sub in x = 0 to find.
If equation is not
given, use a point and the slope to find.
Rate of Change (Rate)
The change in y-values
divided by the change in x-values.
Calculate by making a
table of values, finding the differences, and dividing Δy/Δx
Slope (m)
The change in y-values
divided by the change in x-values.
Calculate the same as
rate of change or use
the formula 2 1
2 1
y y
x x
Equation of a Line
y = IV + Rate (n)
y = b + mx
Parallel Lines
Have the same slope.
Perpendicular Lines
Slopes are negative
reciprocals.
Standard Form
Equation is written
with all terms on one side.
Rearrange and isolate y
to find the slope and y-intercept.
Direct Variation
Initial Value is 0.
Partial Variation
Initial Value is not 0.
0 10 20 30 40 50 60 70
0 2 4 6 8
Hours C o s t ($ ) ANSWERS: