www.ann-geophys.net/28/499/2010/
© Author(s) 2010. This work is distributed under the Creative Commons Attribution 3.0 License.
Annales
Geophysicae
Global lightning distribution and whistlers observed at Dunedin,
New Zealand
A. B. Collier1,2, S. Bremner2, J. Lichtenberger3, J. R. Downs4, C. J. Rodger4, P. Steinbach3,5, and G. McDowell4
1Hermanus Magnetic Observatory, Hermanus, 7200, South Africa
2School of Physics, University of KwaZulu-Natal, Durban, 4041, South Africa 3Space Research Group, E¨otv¨os University, Budapest, P.O. Box 32, 1518, Hungary 4Department of Physics, University of Otago, Dunedin, 9054, New Zealand
5Research Group for Geology, Geophysics and Space Sciences, Hungarian Academy of Sciences, Budapest, P.O. Box 32,
1518, Hungary
Received: 9 October 2009 – Revised: 12 January 2010 – Accepted: 15 January 2010 – Published: 10 February 2010
Abstract. Whistlers observed at Dunedin, New Zealand, are an enigma since they do not conform to the classical model of whistler production developed by Storey (1953). It is gener-ally accepted that the causative lightning stroke for a whistler observed on the ground at a particular location was located in the neighbourhood of the conjugate point, and generated an electromagnetic signal which propagated in a plasmas-pheric duct stretched along a magnetic field line linking the two hemispheres. The causative stroke is thought to have oc-curred within reasonable proximity of one footpoint of this field line, while the observer was located in the vicinity of the other footpoint. Support for this model has come from a number of previous studies of whistler-lightning observa-tions and whistler-induced particle precipitation. However, as demonstrated here, this model does not always apply.
Whistlers detected at Dunedin are nearly as common as those at Tihany, Hungary, despite there being at least 3 orders of magnitude more lightning in Tihany’s conjugate region compared to that of Dunedin. Furthermore, whereas Tihany whistlers are generally observed at night, consistent with his-torical observations, Dunedin whistlers occur predominantly during the day.
This paper aims to resolve two paradoxes regarding whistler occurrence at Dunedin: (i) an observation rate which is at variance with conjugate lightning activity, and (ii) a di-urnal occurrence peak during daylight. The technique devel-oped by Collier et al. (2009) is used to diagnose the location of the source lightning for Dunedin whistlers. It is found that the majority of the causative strokes occur within a region extending down the west coast of Central America.
Correspondence to: A. B. Collier (abcollier@hmo.ac.za)
Keywords. Electromagnetics (Guided waves; Wave propa-gation) – Magnetospheric physics (Plasma waves and insta-bilities)
1 Introduction
Whistlers are dispersed Very Low Frequency (VLF) (3– 30kHz) emissions initiated in the brief electromagnetic pulse radiated by a lightning stroke. Within the Earth-ionosphere waveguide this pulse, or sferic, is not significantly dispersed and can travel considerable distances. Waveguide attenuation at 2kHz is in the range 15–30dB/Mm (Wait, 1962; Chap-man et al., 1966; Bernstein et al., 1974), where the upper limit applies during the day and the lower limit obtains at night. However, there also is a zonal propagation asymme-try: eastward propagation appears to suffer less attrition than westward (Crombie, 1963).
Since the ionosphere is partially permeable to VLF waves, some portion of the sferic energy may penetrate upwards through the ionosphere and enter the magnetosphere. In the inhomogeneous and anisotropic magnetospheric plasma the waves propagate along the Earth’s magnetic field lines in the whistler mode. When the waves reach the ionosphere in the conjugate hemisphere they are either reflected back into the magnetosphere or infiltrate the Earth-ionosphere waveguide, where they may be detected by receivers on the ground. The second eventuality only occurs if the waves are ducted through the magnetosphere in a field-aligned density irregu-larity.
mode. The quasi-longitudinal approximation to the whistler mode dispersion relation is
µ2= 5
2
ω(cosθ−ω), (1)
whereµis the refractive index,5andare, respectively, the plasma- and gyrofrequency,ωis the wave frequency, andθis the angle of propagation with respect to the static magnetic field. The derivation of Eq. (1) considers only the electron component of the plasma. Due to their substantially larger mass and lower gyrofrequency, ions do not contribute signif-icantly to the whistler mode dispersion relation.
Since the whistler mode is dispersive, the propagation de-lay varies with frequency, transforming the initial pulse into a complex tone with a unique frequency-time signature. As the group speed is a function of both5and, a whistler’s dispersion is determined by the plasma density and magnetic field strength along the path traversed through the magneto-sphere.
The conditioncosθ−ω=0 defines a resonance cone. Outside the resonance cone the refractive index is imag-inary and propagation is evanescent. Waves propagating close to the resonance cone couple strongly with the quasi-electrostatic lower hybrid mode. The lower hybrid resonance frequency is approximately the geometric mean of the elec-tron and ion gyrofrequencies, which is substantially higher than the ion gyrofrequency (Smith and Brice, 1964). At fre-quencies beneath the lower hybrid resonance the refractive index surface is closed and there is no resonance cone.
Due to the anisotropy in Eq. (1), the path of a whistler is guided by the static magnetic field. While the direction of energy propagation conforms roughly to the magnetic field lines, it is possible that the wave normal vector may deviate quite substantially from alignment with the magnetic field (Maeda and Kimura, 1959). In a dipole magnetic field, if the whistler is simply guided between hemispheres by the field there is a consistent poleward drift. As a result theL
shell along which the whistler propagates can change. Fur-thermore, oblique propagation may lead to reflection of the whistler at an altitude above the ionosphere where its fre-quency matches the lower hybrid resonance frefre-quency (e.g., Bortnik et al., 2003a,b; Shklyar et al., 2004).
For typical 5 and the ionosphere and plasmasphere haveµ1. Because the refractive index of the neutral atmo-sphere isµ∼1, waves entering the ionosphere from below are refracted into a narrow transmission cone which lies close to the local atmosphere-ionosphere boundary normal (e.g., Santol´ık et al., 2009). Apart from near dusk and dawn this boundary is roughly horizontal and the transmission cone is centred on the zenith. Similarly, the abrupt change in refrac-tive index obstructs coupling from the magnetosphere into the waveguide because waves propagating at an oblique an-gle with respect to the vertical undergo total internal reflec-tion. The half-width of the transmission cone is determined byµin the ionosphere, and is generally in the range 2–3◦.
Ionospheric penetration is contingent upon the wave normal angle lying within this slender cone.
However, if, in addition, the waves are trapped within a field-aligned plasma density irregularity, or duct, then the wave normal direction is more strongly confined to the mag-netic field, and there is a greater likelihood that the whistler will satisfy the transmission cone constraint, facilitating cou-pling through the ionosphere. Because they retain the small-est wave normal angles, almost all whistlers which are ad-mitted into the waveguide in the conjugate hemisphere are ducted (Smith, 1961). In the absence of a duct the waves are magnetospherically reflected near the lower hybrid reso-nance. Inan and Bell (1977) demonstrated that the plasma-pause can also control the trajectory of waves through the magnetosphere.
The majority of lightning strokes generate an upgoing, em-bryonic whistler detectable on Low Earth Orbit (LEO) satel-lites with only limited dispersion (Hughes, 1981; Li et al., 1991; Hughes and Rice, 1997; Holzworth et al., 1999). These whistlers are generally unducted and are thus not detected in the conjugate hemisphere. The observation of a whistler on the ground is thus determined by the presence of ducts suit-ably situated with respect to both the source lightning and the terrestrial receiver.
The intensity of lightning activity at a given location strongly influences the frequency of whistlers near the conju-gate point. Although the majority of lightning is confined to the tropics (Christian et al., 2003), these regions do not play a major role in generating whistlers at lowL. Whistler ob-servations near the geomagnetic equator are rare and there is evidence to suggest that a low-latitude cutoff exists (Koster and Storey, 1955; Rao et al., 1974; Helliwell, 1965; Thorne and Horne, 1994). However, tropical lightning may act as a source for whistlers propagating along field lines at higher latitudes. Although the frequency of lightning decreases by about two orders of magnitude between the equator and 60◦ latitude (Mackerras and Darveniza, 1994), whistlers are most commonly observed by mid to high latitude receivers. Fur-thermore, Christian et al. (2003, Fig. 7a) found that the mean annual land to ocean flash ratio is around 10:1. Whistlers are thus more likely to originate from continental storms.
number of whistlers observed with diminishing geomagnetic latitude.
Collisional absorption is not the only source of iono-spheric attenuation. Starks et al. (2008) and Lehtinen and Inan (2009) found that signals from terrestrial VLF transmit-ters measured at LEO were substantially weaker than pre-dicted from sophisticated propagation models. The discrep-ancies were attributed to the presence of small-scale irregu-larities in the ionosphere. Earlier, Sonwalkar and Harikumar (2000) concluded that ducts at low latitude are ineffectual for whistler propagation since they lie within the ionosphere and are thus prone to similar irregularities. Parrot et al. (2007) observed perturbed ionospheric characteristics above the NWC transmitter and ascribed them to plasma heating. It is not inconceivable that a similar effect might occur above an intense thunderstorm. In addition, electrons precipitated by upgoing whistler mode waves also perturb the local iono-sphere, and can be a significant source of ionisation at night (Clilverd et al., 2004; Rodger et al., 2007).
1.1 Whistler detection
The manual identification of whistlers in broadband VLF data is an extremely laborious procedure. However, the Automatic Whistler Detector (AWD) system developed at E¨otv¨os University (Lichtenberger et al., 2008) operates au-tonomously to distinguish whistlers in a continuous stream of VLF data. The AWD algorithm employs an idealised tem-plate whistler derived from a model which utilises Bernard’s (1973) approximation.
The AWD operates in two stages. The first stage executes in real time, using a sliding window to inspect the broad-band VLF data. If the window appears to contain a whistler then that portion of the data is retained for offline processing. The second stage, which does not function in real time, care-fully scrutinises and validates all of the records retained by the first stage. If a whistler is indeed identified, then its time of arrival is recorded as the time at which the trace passes through ∼6kHz. If the extract does not actually contain a whistler then it is discarded, thereby eliminating many false positive events. If, however, the initial stage fails to identify a segment of data which does indeed contain a whistler then this sample is not retained or subjected to the stringent anal-ysis of the second stage. There is thus still the possibility of false negative outcomes for whistlers which are too faint, submerged in noise or anomalous. The estimated efficiency of the two stages for whistler detection is around 95%.
The AWD system is not infallible and the first stage pro-duces a significant proportion of false triggers. Lichtenberger et al. (2008) indicated a false-positive rate of between 20% and 50%, whereas Rodger et al. (2008) found that around 58% of the events identified by the first stage were fallacious. However, since the results of the second stage are of much higher fidelity, the spurious events from the first stage would
not have an appreciable impact on the results of a statistical analysis.
A network of AWDs is currently being deployed around the globe (Lichtenberger et al., 2008). Efforts are presently being undertaken to upgrade the AWD software so that the systems can automatically scale the detected whistlers to pro-duce plasmaspheric electron density parameters. The system incorporating the analysis component will be known as an Automatic Whistler Detector and Analyser (AWDA). 1.2 Dunedin whistlers
Rodger et al. (2008) reported on recent whistler observations at Dunedin, New Zealand. Dunedin and its geomagnetic conjugate point are located far from strong lightning activ-ity. However, historical surveys (Allcock, 1959; Helliwell, 1965) reported high whistler occurrence rates in the region, despite the scarcity of conjugate lightning. Using the con-jugate lightning rate to predict the occurrence rate of one-hop whistlers at Dunedin results in∼0.00023min−1, which is less than one whistler per day. The occurrence rate derived by Rodger et al. (2008) is 0.12min−1, which is three orders of magnitude higher, comparable to that observed at other stations.
The novelty of the whistlers observed at Dunedin is best appreciated in contradistinction to observations made at Ti-hany, Hungary. Collier et al. (2006, 2009) discussed the re-lationship between whistlers observed at Tihany and global lightning activity, finding that the majority of whistlers were associated with lightning strokes within about 1000km of the conjugate point but that only around one in every 375 strokes produced a whistler detectable on the ground. The frequency of lightning near Dunedin’s conjugate point is around 1500 times less intense than that around the conjugate point of Ti-hany, yet the whistler detection rate at Dunedin is only about a factor of 3 smaller than that at Tihany. Dunedin whistlers are thus much more profuse than might be expected from conjugate lightning activity alone. The frequency of conju-gate lightning is thus certainly not the only factor in deter-mining whistler occurrence.
2 Data
Table 1. Seasonal daily whistler count [day−1] at Dunedin as a function of Northern Hemisphere season.
season mean
winter (Dec to Feb) 494±47 spring (Mar to May) 276±37 summer (Jun to Aug) 706±77 autumn (Sep to Nov) 517±48
2.1 Whistler data
VLF data were recorded at Swampy Summit, Dunedin, New Zealand, (45.78◦S 170.47◦E, L=2.75), where the local time is UTC+12h. The geomagnetic conjugate point is lo-cated at 55.84◦N 195.30◦E, close to the Aleutian Islands.
The whistler times used in this study were acquired using an AWD system (Lichtenberger et al., 2008). The template whistler has a nose frequency of 20kHz and covers the dis-persion rangeD0=40–100s1/2(Rodger et al., 2008). The
choice of this range is based on the average dispersion of
D0=60–65s1/2for whistlers recorded at Dunedin. A
spec-trogram of a whistler recorded at Dunedin is presented in Fig. 1.
Rodger et al. (2008) found that both low latitude (nose fre-quencies in the range 20–50kHz andD0=50–60s1/2) and
mid- to high-latitude (nose frequencies from 5–10kHz and
D0=70–90s1/2) whistlers were detected in Dunedin. The
observed whistlers consisted of single traces, multiple stroke traces and multiple path traces, and covered a relatively large range ofLfrom 1.6 to 3.9 (Rodger et al., 2008).
Between 20 May 2005 and 13 April 2009, 717 546 whistlers were identified at Dunedin, an average of 504 per day, of which 80% occurred during the daytime. The events between 20 May 2005 and 15 September 2007 were man-ually validated. Of the 233 316 records captured by the Dunedin AWD, 98 446 were found to contain whistlers, giv-ing a system accuracy of 42%, and hence a false trigger rate of 58%, in agreement with the earlier report of Rodger et al. (2008). Subsequent analysis by the AWD second stage re-vealed 347 323 distinct whistler traces during this period. Based on the statistics presented by Rodger et al. (2008), each record correctly identified by the first stage contains roughly 1.5 whistlers, each of which is composed of an aver-age of 2.6 traces.
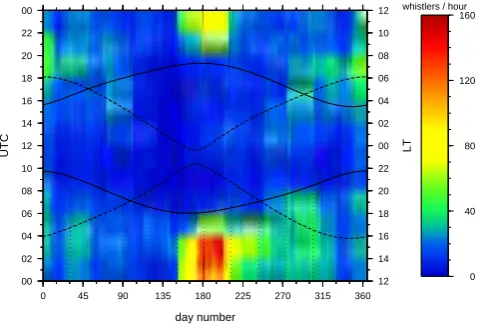
There is a clear seasonal variation reflected in the whistler rates presented in Table 1, with a daily average of 494 in winter and 706 in summer. The peak during the Northern Hemisphere summer corresponds to the period of maximum lightning activity. The detailed composite of the diurnal and annual distribution of Dunedin whistler activity is plotted in Fig. 2. This should be contrasted with Collier et al. (2006, Fig. 8b) and the alternative representation of this informa-tion by Rodger et al. (2008, Figs. 5 and 6). Although the
whistler statistics do exhibit a large variance in daily count rates, so that, in principle, a few extraordinarily active days might distort the distribution in Fig. 2, the general appear-ance is unaltered if only moderately active days are included in the statistics.
The seasonal variation shown in the Dunedin data is sistent with the annual cycle of lightning activity in the con-jugate hemisphere. Northern Hemisphere lightning is most profuse in the summer, peaking during July and August (Christian et al., 2003, Fig. 7b), corresponding to the annual maximum in Dunedin whistler activity.
The diurnal pattern of whistler observations at Tihany peaks between sunset and sunrise (Collier et al., 2006, 2009), which is consistent with the accepted wisdom that whistlers are most commonly observed on the ground at night (Helli-well, 1965). However, the diurnal distribution of Dunedin whistlers is at variance with expectations. The Dunedin whistler activity peaks around 15:00 LT (03:00 UTC), with high activity between roughly 11:00 and 18:00 LT. This is during daylight for both the receiver and conjugate point, when ionospheric absorption is at its highest. In addition to the pronounced peak during July, a broad enhancement ex-tends over most of the rest of the year but this too is clearly confined to daylight hours.
The principal factors determining the seasonal and diur-nal distribution of whistlers depicted in Fig. 2 are the spa-tial and temporal occurrence pattern of lightning and ducts. The characteristics of ducts also exhibit diurnal and seasonal changes, extending to lower altitudes at night and during winter and the equinoxes (Bernhardt and Park, 1977). Fur-thermore, ducts have a typical lifetime of a few days or less (Bernhardt and Park, 1977; Hansen et al., 1983; Hayakawa et al., 1983), and consequently the propensity of the mag-netosphere to conduct whistlers between hemispheres varies over comparable time scales.
The fact that whistlers are most commonly observed at Dunedin during daylight indicates that they are anomalous (Rodger et al., 2008), and suggests that the classical model of Storey (1953) might not apply. Furthermore, the diurnal variation of whistler occurrence at Dunedin is consistent with neither the daily pattern of lightning activity near the conju-gate point nor the changes in ionospheric conductivity in this local time sector.
0 0.5 1 1.5 2 time [s]
0 5 10 15 20
[image:5.595.53.550.62.187.2]frequency [kHz]
Fig. 1. A whistler recorded in Dunedin at 04:19:37 UTC on 14 December 2006.
0 45 90 135 180 225 270 315 360 day number
00 02 04 06 08 10 12 14 16 18 20 22 00
UTC
12 14 16 18 20 22 00 02 04 06 08 10 12
LT
0 40 80 120 160 whistlers / hour
Fig. 2. Annual and diurnal variation of whistler count rate at
Dunedin as a function of UTC and day number. Solid curves in-dicate the passage of the terminator at an altitude of 100 km over Dunedin, while the dashed curves apply to the conjugate point.
either or both of the source or receiver hemisphere (Clilverd et al., 1992).
The most active day at Dunedin was 12 July 2008, when 15 218 whistlers were detected. The distribution of global lightning on that day is displayed in Fig. 3. It is apparent that there is a paucity of lightning around Dunedin’s conjugate point, but an abundance over equatorial and North Amer-ica as well as the Maritime Continent. This immediately suggests that the causative lightning strokes for whistlers observed at Dunedin are not located close to the conjugate point, but must occur further afield.
2.2 Lightning data
At any instant up to 2000 thunderstorms are active over the surface of the Earth. Most of this activity is concentrated in the tropics over the land masses in South America, Africa and the Maritime Continent (Christian et al., 2003). There is a well defined diurnal variation in global lightning activity
which is dictated by the local diurnal cycle over each of these regions (Price, 1993).
The spatial and temporal distribution of lightning activity may be studied using data from satellite sensors and terres-trial networks. The latter utilise time-of-arrival techniques and have traditionally operated at Medium Frequency (MF) (0.3–3MHz) and required a dense network of receivers to ob-tain either local or regional coverage. More extensive cover-age has recently been achieved by the World Wide Light-ning Location Network (WWLLN), which operates in the VLF range, where attenuation is low, and is thus able to detect global lightning activity with only a limited number of receivers (Dowden et al., 2002, 2008a; Lay et al., 2004). MF networks use the leading edge of the sharp sferic im-pulse to calculate the time of arrival, while WWLLN em-ploys the Time of Group Arrival (TOGA) technique (Dow-den and Rodger, 2002; Dow(Dow-den et al., 2002) where extensive propagation in the Earth-ionosphere waveguide smears the sferic out into a dispersed wave train with a duration∼1ms. WWLLN operates exclusively on signals which have prop-agated in the waveguide mode, thereby avoiding the errors associated with mixing of skywave and groundwave signals (Dowden et al., 2008b). Each stroke identified by WWLLN is assigned a time and location, where the temporal and spa-tial accuracies are∼30µs and∼10km respectively (Rodger et al., 2005).
[image:5.595.48.288.248.411.2]0˚ 30˚ 60˚ 90˚ 120˚ 150˚ 180˚ 210˚ 240˚ 270˚ 300˚ 330˚ 0˚ −90˚
[image:6.595.49.548.65.323.2]−60˚ −30˚ 0˚ 30˚ 60˚ 90˚
Fig. 3. Location of World Wide Lightning Location Network (WWLLN) lightning strokes on 12 July 2008, when 15 218 whistlers (30 times
the average daily rate) were observed at Dunedin.
WWLLN seldom identifies strokes with peak current less than 25kA (Dowden et al., 2008a). Lay et al. (2004), using data from a local lightning detection network in Brazil, found the mean peak current for WWLLN events was between 70 and 80kA, which is appreciably above the average for global lightning activity. The bias towards lightning strokes car-rying larger currents arises because, in order to provide an unambiguous lightning location, WWLLN requires TOGA information from at least five stations. The data therefore in-clude a disproportionate number of intense lightning events. Comparison with other lightning detection systems has es-tablished that WWLLN still provides a representative reflec-tion of global lightning activity. Indeed, the global light-ning distribution obtained from an analysis of WWLLN data (Rodger et al., 2006) is consistent with the definitive work of Christian et al. (2003). The high threshold current resulted in a global detection efficiency of only around 2% for all strokes and 5% for cloud-to-ground (CG) strokes (Rodger et al., 2005, 2006; Jacobson et al., 2006). The detection ef-ficiency of WWLLN varies both spatially and temporally as a result of the non-uniform distribution of receivers and the fact that not all of the receivers are operational at any given time. However, because of various recent enhancements, WWLLN global detection efficiency is now∼5–6% for all strokes and∼15% for CG strokes (Rodger et al., 2009).
The low level of lightning activity around Dunedin’s con-jugate point is not an artifact of the non-uniform WWLLN receiver topology (the nearest station is in Seattle, Washing-ton, some∼3000km away) but reflects a genuine dearth of
lightning in this region. The study of Christian et al. (2003), using Optical Transient Detector (OTD) data, also recorded a paucity in lightning activity in this region. Lightning in the central north Pacific Ocean is most prevalent during the Northern Hemisphere autumn and winter and is generally as-sociated with frontal systems travelling eastward (Christian et al., 2003).
2.3 Data availability
As discussed by Collier et al. (2009), since WWLLN con-sists of a network of distributed receiver nodes, it is difficult to objectively identify periods during which its operational integrity is compromised. As a result WWLLN is assumed to be fully functional for the full period of the analysis.
day
1 4 7 10 13 16 19 22 25 28 31
2005/05 2005/08 2005/11 2006/02 2006/05 2006/08 2006/11 2007/02 2007/05 2007/08 2007/11 2008/02 2008/05 2008/08 2008/11 2009/02
# whistlers recording
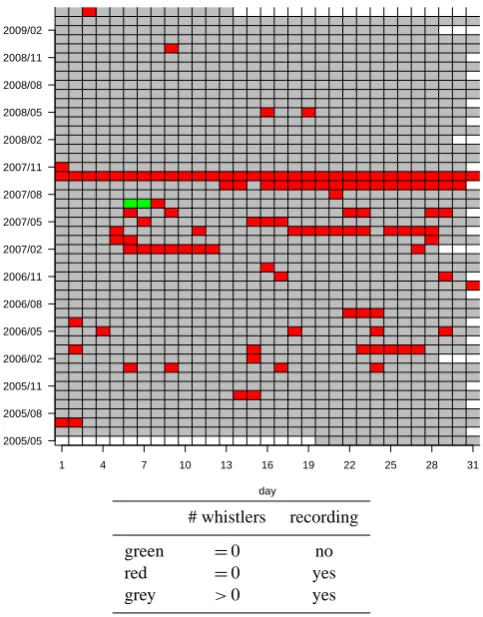
green =0 no
red =0 yes
[image:7.595.46.288.61.370.2]grey >0 yes
Fig. 4. Status of the AWD operating at Dunedin, New Zealand,
indicating whether the system was recording data and whether or not any whistlers were identified.
3 Analysis
Following the technique described by Collier et al. (2009), the capacity of a given region of the globe to produce whistlers is assessed by performing a correlation between lightning occurrence within that region and whistler inci-dence at Dunedin. The objective of this analysis is to identify those portions of the globe for which this correlation is high. The lightning data were first projected onto a 3◦by 3◦ spa-tial grid. The use of a relatively coarse grid ensures that the effects of spatial uncertainty in the WWLLN data are min-imised. The whistler and lightning data sets were then pre-pared for the correlation analysis by dividing the time period between 20 May 2005 and 13 April 2009 into intervals of length1t=1min. The number of events during each interval was then determined. Finally, the event counts were reduced to Boolean values, simply indicating the presence or absence of activity, but not its absolute intensity.
This analysis procedure does not take into account the causal relationship between lightning and whistlers. A light-ning stroke occurring after a whistler, but still within the same1t=1min interval, would still be associated with the whistler. In principle a more robust analysis might be carried out by identifying lightning strokes that occurred within a
short period prior to the whistler. This would respect causal-ity. However, the low efficiency of the WWLLN data ren-ders this approach unfeasible since there is a relatively high probability that the causative stroke would not have been de-tected. The binning of the data into 1t=1min segments therefore represents a compromise. However, should light-ning data of higher fidelity become available then this alter-native analysis is likely to yield improved results.
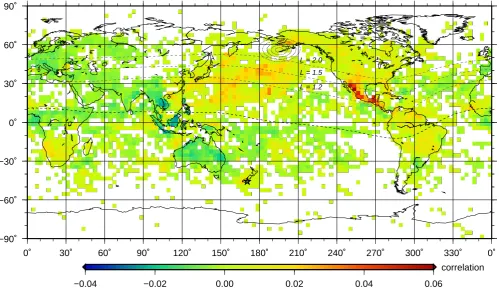
Figure 5 displays the correlation between the whistler se-quence at Dunedin and the lightning sese-quence in each of the grid cells spanning the globe. Data are plotted only for cells in which the correlation is significant at theα=0.01 level. A preliminary examination of the data in Fig. 5 reveals that the correlation is:
1. generally close to zero;
2. roughly independent of latitude (there is a vague tran-sition from negative to positive across the geomagnetic equator);
3. positive over a diffuse region in the north Pacific Ocean; 4. positive over a small region of Alaska close to the
con-jugate point;
5. maximised in a compact region located on the west coast of Central America, extending from just north of the geomagnetic equator to aroundL=2. This region is associated with a moderately intense flash rate density of around 10–20km−2year−1(Christian et al., 2003). One might immediately hypothesise that the region on the west coast of Central America should encompass the major-ity of the causative lightning discharges, and it is thus pro-posed as the principal source region for whistlers detected at Dunedin. Certainly, the lightning activity on the west coast of North America is generally low and only increases across the border into Mexico (Christian et al., 2003, Fig. 4). In fact, there are two zones of intense lightning activity in this region (Christian et al., 2003, Fig. 4): one extending west from Florida to Texas and the other in the region identified in Fig. 5.
L = 1.2 L = 1.5 L = 2.0
−0.04 −0.02 0.00 0.02 0.04 0.06
correlation
0˚ 30˚ 60˚ 90˚ 120˚ 150˚ 180˚ 210˚ 240˚ 270˚ 300˚ 330˚ 0˚
[image:8.595.49.549.64.355.2]−90˚ −60˚ −30˚ 0˚ 30˚ 60˚ 90˚
Fig. 5. Correlation between whistler observations at Dunedin, New Zealand, and global lightning strokes for1t=1min. Data are plotted
only in cells for which the correlation is statistically significant. The geomagnetic equator and the Northern HemisphereL=1.2, 1.5 and 2 contours are indicated by dashed curves. The location of Dunedin is reflected by a pentagram. The conjugate point is surrounded by circles at intervals of 200km up to a distance of 1000km.
results significantly altered. On this basis one might confi-dently assert that the results presented in Fig. 5 are robust and not unduly influenced by days on which bountiful whistlers were observed.
Figure 5 reflects a subtle transition in the correlation across the geomagnetic equator. South of the equator the correla-tion is close to zero but generally negative, while north of the equator there are more extensive areas which are positively correlated with the Dunedin whistlers. This hemispheric di-chotomy is caused by the seasonal distribution of lightning. Lightning activity in the Northern Hemisphere peaks during Boreal summer (June to August), when whistlers at Dunedin are most frequent. The prevalence of lightning in the South-ern Hemisphere is maximised during the Austral summer (December to February), a period of infrequent whistler oc-currence in Dunedin. Dunedin whistler activity is thus gen-erally in phase with Northern Hemisphere lightning and in antiphase with Southern Hemisphere lightning. The deepest anticorrelations are to be found over the Maritime Continent in the vicinity of the Indochina Peninsula, Malaysia and In-donesia.
3.1 Diurnal variation
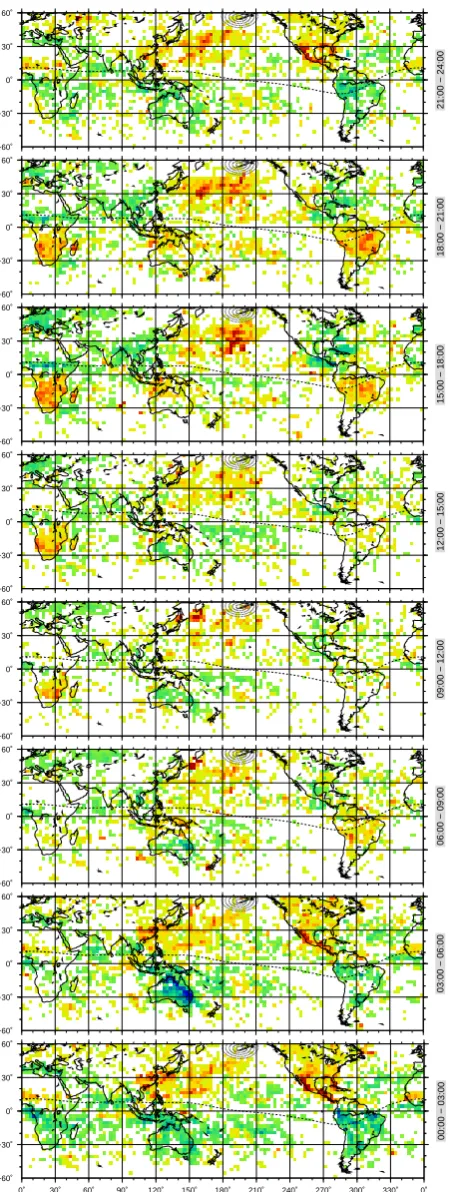
In order to determine whether there was a diurnal pattern in the correlation, the data were decomposed into 8 units corre-sponding to consecutive 3h intervals. The correlation anal-ysis was then repeated with each unit, yielding the results displayed in Fig. 6.
21:00 − 24:00
−60˚ −30˚ 0˚ 30˚ 60˚
18:00 − 21:00
−60˚ −30˚ 0˚ 30˚ 60˚
15:00 − 18:00
−60˚ −30˚ 0˚ 30˚ 60˚
12:00 − 15:00
−60˚ −30˚ 0˚ 30˚ 60˚
09:00 − 12:00
−60˚ −30˚ 0˚ 30˚ 60˚
06:00 − 09:00
−60˚ −30˚ 0˚ 30˚ 60˚
03:00 − 06:00
−60˚ −30˚ 0˚ 30˚ 60˚
00:00 − 03:00
0˚ 30˚ 60˚ 90˚ 120˚ 150˚ 180˚ 210˚ 240˚ 270˚ 300˚ 330˚ 0˚ −60˚
−30˚ 0˚ 30˚ 60˚
Fig. 6. Correlation coefficients derived from data decomposed into
3h intervals. The UTC for each period is indicated to the right of each panel.
It is interesting that Southern Africa and South America appear to contribute positively during the same time of day, 15:00 to 21:00 UTC. It is not clear whether the sferics from these regions propagate sub-ionospherically to the Northern Hemisphere before entering the magnetosphere or if they propagate along ducts at lowL, producing two-hop whistlers at Dunedin which still fall within the range ofD0accepted
by AWD. Thomson (1985) has demonstrated the feasibility of the first possibility, identifying the signal from the power-ful NWC, Australia, transmitter which reached Dunedin by a path other than the direct great circle path, presumably being reflected off a mountain range in the Northern Hemisphere before being ducted back to the Southern Hemisphere.
During the interval from 21:00 to 03:00 UTC lightning around Florida also plays a role in whistler generation. How-ever, the importance of this region declines until, from 03:00 to 06:00 UTC, its contribution is negligible compared to that of the proposed source region. During the Northern Hemi-sphere summer the interval from 21:00 until 03:00 UTC cor-responds to the afternoon hours, during which there is ample lightning activity over the southern portion of North Amer-ica. However, by 03:00 UTC this region is in darkness. At the peak time for whistler observation (July at around 03:00 UTC, according to Fig. 2), the proposed source region has just passed into darkness.
3.2 Statistical significance
This analysis examines the correlation between time se-quences which, in general, possess a relatively high degree of autocorrelation. The implications of finite autocorrelation were discussed by Collier et al. (2009). Autocorrelation does not influence the value of the correlation coefficient but it does have an impact on the associated uncertainties. The credibility of the whistler-lightning correlation coefficients may be evaluated with reference to the associatedp-values, which represent the probability of achieving results at least as extreme as those obtained assuming that the null hypothesis (no correlation) is, in fact, true.
Figure 5 reflects only those cells which havep <0.01, that is, correlation coefficients which are significant at the 1% level. There is still a 1% probability that by chance a pair of random sequences would yield a correlation exceeding a given value at theα=0.01 significance level. However, the fact that elevated correlations are observed in a spatially con-tiguous region makes this contingency somewhat implausi-ble. This is analogous to obtaining a significant correlation between random sequences several times in succession.
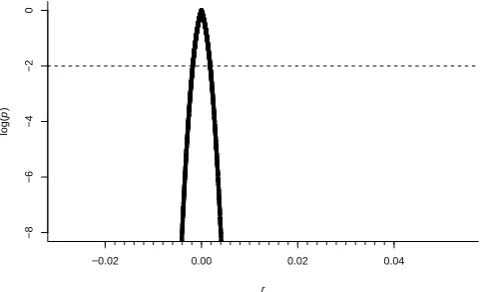
Figure 7 plots the relationship between the sample corre-lation coefficient and the associatedp-value for all cells on the geographic grid. The dashed horizontal line indicates the
[image:9.595.56.283.66.663.2]−0.02 0.00 0.02 0.04
−8
−6
−4
−2
0
r
log(
p
[image:10.595.47.289.63.209.2])
Fig. 7. Statistical significance of the calculated correlation
coeffi-cients given as the logarithm of the probability that the null hypoth-esis (zero correlation) is valid. The dashed horizontal line indicates theα=0.01 significance level.
null hypothesis. Locations which conform to this criterion for statistical significance occupy 56% of the area of the Earth’s surface. This high degree of statistical significance is amply evident in the extensive distribution of data in Fig. 5.
4 Discussion
It is generally believed that a region of limited extent around the conjugate point represents the area in which a whistler’s causative lightning stroke is most likely to have been located. Certainly this is a reasonable assumption if there is an appre-ciable level of lightning activity in the vicinity of the conju-gate point. But what might one surmise in the relative ab-sence of conjugate lightning?
Collier et al. (2009) demonstrated that the majority of whistlers observed at Tihany, Hungary, were associated with lightning activity within about 1000km of the conjugate point. The average lightning flash rate around Tihany’s conjugate point is between 6 and 20km−2year−1(Christian et al., 2003), which is appreciably higher than the global av-erage flash rate of around 3km−2year−1.
The flash rate of between 0.01 and 0.1km−2year−1 (Chris-tian et al., 2003) near the conjugate point of Dunedin, New Zealand, is well below the global average. Yet the rate at which whistlers are observed at Dunedin is comparable to that at Tihany. This suggests that the causative strokes for the Dunedin whistlers do not occur around the conjugate point. A correlation analysis following the technique of Col-lier et al. (2009) has demonstrated that the region of highest correlation between Dunedin whistlers and global lightning occurs on the west coast of Central America, north of the geomagnetic equator. Rodger et al. (2008) previously hy-pothesised that the source of Dunedin whistlers was in North America.
Furthermore, a comparison of the diurnal patterns of whistler occurrence at Tihany and Dunedin immediately sug-gests that, while the former conform to the classical model of whistler generation, the latter are anomalous. Thus the fact that the causative strokes for the Dunedin whistlers are not clustered around the conjugate point should not be entirely unexpected.
Sferics can propagate enormous distances in the Earth-ionosphere waveguide with minimal attenuation. As a re-sult the causative lightning stroke, the guiding magnetic field line and the receiver may be significantly displaced with re-spect to each other (Holzworth et al., 1999; Chum et al., 2006; Santol´ık et al., 2009). Indeed the path through the magnetosphere need not have a footpoint at either the source or the receiver, but may be displaced with respect to both. Whistlers have been initiated by lightning strokes occurring more than 2000km from the duct footprint (Weidman et al., 1983; Carpenter and Orville, 1989; Li et al., 1991; Clilverd et al., 1992; Holzworth et al., 1999). The Central Ameri-can source region proposed above is thus certainly plausible. However, the question remains: along what magnetic merid-ian are the whistlers ducted? Do the sferics penetrate the ionosphere in the vicinity of the source, being subsequently ducted to the Southern Hemisphere before propagating to Dunedin within the Earth-ionosphere waveguide? Alterna-tively, does the bulk of the sub-ionospheric propagation oc-cur from the source region to the proximity of Dunedin’s con-jugate point before the impulse enters the magnetosphere? Or, finally, a compromise, where sub-ionospheric propaga-tion occurs both before and after the passage of the signal through the magnetosphere? It is not currently possible to make a definitive statement about which of these possibili-ties is valid. Their relative merits are discussed below.
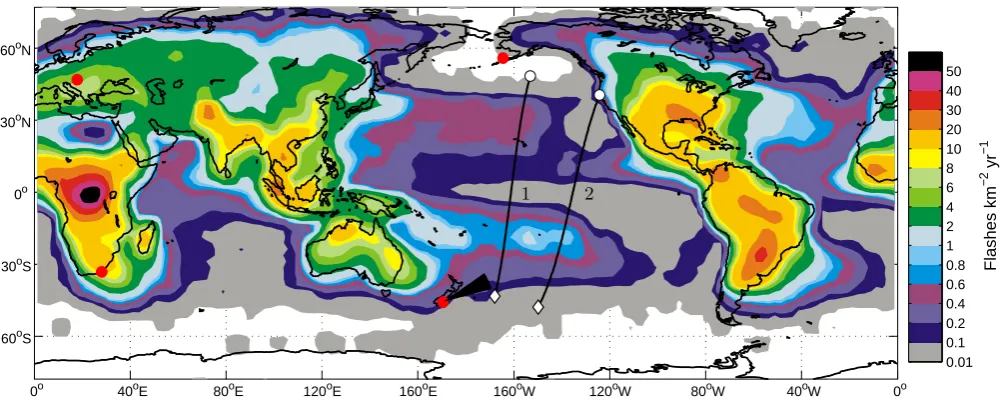
Clilverd et al. (1992) found that there were two preferred paths for the propagation of signals from the NLK (24.8kHz) transmitter in Seattle, Washington, to Dunedin. NLK is lo-cated some distance to the north west of the proposed source region, roughly half way to the conjugate point. Figure 8 reflects the lightning climatology derived from the com-bined LIS/OTD satellite data and indicates the two preferred paths identified by Clilverd et al. (1992) and their relation-ship to Dunedin and its conjugate point. The arrival bear-ing of the NLK signal at Dunedin exhibited a bimodal dis-tribution, with peaks centred on 60◦ and 110◦, implicating paths with exit points to the east of Dunedin. The entry points for these paths were found to be located to the west (close to Dunedin’s conjugate) and south (near the transmit-ter) of NLK respectively. The occurrence of the latter path presented an annual variation, being most common in May and least common in November, while the former path was perennially active. Neither of the paths was located at theL
0o 40oE 80oE 120oE 160oE 160oW 120oW 80oW 40oW 0o 60oS
30oS 0o 30oN 60oN
Flashes km
−
2 yr
−
1
0.01 0.1 0.2 0.4 0.6 0.8 1 2 4 6 8 10 20 30 40 50
[image:11.595.47.548.61.263.2]1 2
Fig. 8. The annual average global lightning activity (flashes/km2/year) from the gridded LIS/OTD satellite 2.5◦Low Resolution
An-nual/Diurnal Climatology (LRADC) v2.2 data. These data were produced by the NASA LIS/OTD Science Team (Principal Investi-gator, Hugh J. Christian, NASA/Marshall Space Flight Center) and are available from the Global Hydrology Resource Center (http: //ghrc.msfc.nasa.gov). Red dots mark AWD locations in New Zealand and Hungary, and their geomagnetic conjugates. The heavy black lines show the preferred plasmaspheric propagation paths from NLK to Dunedin identified by Clilverd et al. (1992). Entry points are shown by white dots, and exit points by white diamonds. Bearings between 55◦and 75◦are indicated by the black wedge centred on Dunedin.
at Wellington, New Zealand, was most likely to propagate along ducts at either the magnetic longitude of the source or the receiver. Shimakura et al. (1987) and Ladwig and Hughes (1989) found that transmission loss was minimised for paths aligned with the source or receiver magnetic merid-ian. These observations suggest that the whistlers originating from lightning strokes on the west coast of Central America either enter a duct close to the source region or near to the conjugate point. Is it possible to discriminate between these two options? There are two principle considerations: the relative attenuation incurred along each of these paths and the applicable conditions for refraction between the Earth-ionosphere waveguide and magnetospheric ducts.
The relative importance of transionospheric absorption and attenuation due to propagation in the Earth-ionosphere waveguide (a graphic comparison is presented by Smith and Jenkins, 1998, Fig. 2) may play a role in determining which is the most likely path between hemispheres. The absorption induced by the passage of a signal through the ionosphere de-pends on geomagnetic latitude, decreasing as one approaches the magnetic poles (Helliwell, 1965). The proposed source region has a magnetic latitude of λm≈30◦. According to Helliwell (1965, Figs. 3–35), the ionospheric attenuation of a 2kHz signal at this latitude is∼4dB at night and∼19dB during the day. Similarly, at Dunedin’s conjugate point, lo-cated at λm≈55◦, a 2kHz signal experiences ∼2dB and
∼11dB ionospheric attenuation during the night and day re-spectively. If one takes a point atP =20◦N 255◦E as rep-resentative of the source region, then the conjugate location
is atP0=35◦S 244◦E. The distance fromP0 to Dunedin
is around 6150km, while the distance fromP to Dunedin’s conjugate point is about 6330km. Therefore, in terms of the distance which the signal must propagate in the Earth-ionosphere waveguide, there is little to choose between the two options. However, the illumination of these two paths is significant. Since the waveguide attenuation differs by around 3dB/Mm between day and night (Helliwell, 1965, p. 144), a path of 6000km leads to a difference in attenuation of roughly 18dB. BothP and the path fromP0 to Dunedin are in darkness at the time of peak whistler occurrence, while most of the path fromP to Dunedin’s conjugate is illumi-nated. Consequently the total transionospheric attenuations for the two paths are 8dB (4dB at each footpoint) and 22dB (11dB at each footpoint), respectively, while the latter also incurs an extra 18dB in the waveguide. Therefore consid-eration of both transionospheric and waveguide attenuation appears to strongly favour a duct closer to the source.
conjugate point at higher magnetic latitude, again advocat-ing a duct proximate to the source.
There is evidence to suggest that a low-latitude cutoff exists for whistlers at geomagnetic latitudes below ∼15◦ (equivalent toL∼1.1) (Rao et al., 1974; Thorne and Horne, 1994). This may be due to the paucity and limited degree of enhancement (Andrews, 1978; Clilverd and Horne, 1996) of ducts at low latitudes. Certainly at such lowLthe field lines barely penetrate the plasmasphere and lie mainly within the ionosphere. Furthermore, at low magnetic latitudes the overlap between transmission and trapping cones is small or completely absent. A limited fraction of the wave energy may thus be refracted across the ionospheric boundary, and then, only provided that there is a sufficient range of wave normal angles present. However, since the proposed source region only extends down to L∼1.2, these considerations are not too stringent and one cannot discount the possibility of ducting near the source on these grounds alone.
Broadband recordings made in Dunedin during a case study period in July 2007 produced 141 whistlers which were suitable for directional analysis. These whistlers were found predominantly during local daytime and are thus represen-tative of the broader dataset used in this study. In order to provide a good quality direction analysis, the events selected were traces that had only mild noise interference from sfer-ics. Two thirds of the case study whistlers were found to arrive in Dunedin with angles of 40◦ to 60◦relative to the magnetically aligned east-west loop. Using a local decli-nation of 25◦, this range corresponds to bearings between 55◦ and 75◦. Certainly the case study is strongly sugges-tive of our whistlers coming via the first of the two preferred paths suggested by Clilverd et al. (1992). While there was no evidence of the second favoured path reported by Clil-verd et al. (1992), this could be due to our experimental tech-nique. The Dunedin AWD triggers only off the north-south loop observations, and the 110◦ bearing path is essentially perpendicular to this loop. Nonetheless, this case study is consistent with a lightning source in Central America lead-ing to whistlers observed in Dunedin, followlead-ing propaga-tion through a duct located in the mid-Pacific Ocean. More detailed direction finding work, employing vertical electric field measurements to avoid bearing ambiguity, should shed further light on this.
It is interesting to speculate about the fact that the other zone of intense lightning activity in North America, located between Florida and Texas, does not appear to contribute appreciably to Dunedin whistlers. This region is fraction-ally further (a few 10km) from Dunedin’s conjugate, and is conjugate to an area which is somewhat closer (a couple of 100km) to Dunedin, so there is little to distinguish between them in terms of waveguide propagation.
Although the vigorous lightning centred over the Maritime Continent is more distant from the conjugate point than Cen-tral America, it is rather perplexing that this area does not play a more active role in producing whistlers at Dunedin.
Certainly it is closer to the geomagnetic equator, but if ex-tensive waveguide propagation is allowed prior to entering the magnetosphere then this factor should not be significant. In light of the asymmetry in zonal propagation within the waveguide (Crombie, 1963), one would have anticipated that regions west of the conjugate would be more effective than those to the east.
Combining the whistler-derived plasmaspheric electron densities from the AWDA network with field line resonance observations (e.g., Menk et al., 2004) will allow determina-tion of the plasmaspheric composidetermina-tion (Denton et al., 2004), and how it varies with local time. However, in order to derive a reasonable local time dependence, it is necessary to deter-mine the magnetic meridian long which the whistlers prop-agate and hence what portion of the plasmasphere is being sampled. In the case of Tihany, the majority of the whistlers appear to propagate more or less directly from the conjugate region. However, this is clearly not the case for whistlers observed at Dunedin. Identification of the source lightning that produces the Dunedin whistlers should help clarify this conundrum.
5 Conclusions
The use of whistlers as passive probes of the magnetosphere has produced numerous insights into the Earth’s near-space environment (Sazhin et al., 1992), for example, the discovery of the outer boundary of the plasmasphere (Carpenter, 1963). The salient information acquired from whistler analysis is plasma density as a function ofL. However, a reasonable interpretation of such data can only be made if one is able to determine the magnetic meridian, and hence magnetic local time, of the path that the whistler traversed through the mag-netosphere. If the causative lightning stroke and the VLF receiver are approximately conjugate to each other then it is not unreasonable to assume that the magnetospheric path roughly links these two locations. However, if this is not the case then the interpretation of the density profile is con-founded.
at Tihany may have originated from lightning strokes over South America and the Maritime Continent, both of which are remote from the conjugate point. In this regard it might prove illuminating to compare the distribution of whistler in-tensities at Dunedin and Tihany, taking into account the typ-ical power of lightning discharges in their respective source regions. However, the systematic determination of whistler intensities is a non-trivial problem owing to the fact that there are generally sferics superimposed upon the whistler signals. Although the two sets of waveforms are not inextri-cably mixed, their separation in either the time or frequency domain is an intricate problem. Furthermore, whereas the whistlers detected at Tihany are generally isolated traces, the Dunedin whistlers are usually comprised of groups of multi-ple traces, which would also confound an equitable compar-ison.
The fact that Dunedin experiences an abundance of whistlers despite the paucity of lightning around the con-jugate point suggests that either there is something rather unique about the location or that one should expect copious whistlers at all locations withL'2.75.
In the case of whistlers observed at Dunedin it appears that the majority of the causative lightning strokes are located on the west coast of Central America, so that the source and re-ceiver are separated by around 67◦of magnetic longitude or, equivalently, 4.5h of MLT. Therefore, in order to achieve a critical interpretation of density profiles derived from the Dunedin whistlers it is necessary to determine whether they were ducted close to the magnetic meridian of the source or receiver, or indeed along an intermediate path. It is proba-ble that a direction-finding analysis would at least partially resolve this issue.
In generating the data depicted in Fig. 5 it was assumed that no external factors influenced the correlation between lightning and whistlers. However, it is quite conceivable that exogenous influences, such as the level of solar or geomag-netic activity, might bias the results. This bias might be quan-tified by performing a partial correlation analysis which iso-lates the effects of any such controlling factors.
The results presented here introduce a new paradigm for whistler generation: lightning strokes produce whistlers even if they occur at a significant distance from the conjugate point. This idea was already alluded to by Collier et al. (2009), but supporting evidence has now been firmly estab-lished. Although contrary to the original model of Storey (1953), this broader scenario for whistler production is con-sistent with the fact that sferics propagate tremendous dis-tances in the Earth-ionosphere waveguide.
Acknowledgements. We are grateful to Brett Delport for assisting
with the data analysis. We acknowledge the numerous sites host-ing WWLLN nodes and their efforts in maintainhost-ing the consistent global coverage of the network.
Topical Editor C. Jacobi thanks J. Bortnik and J. Chum for their help in evaluating this paper.
References
Allcock, G. M.: The electron density distribution in the outer iono-sphere derived from whistler data, J. Atmos. Terr. Phys., 14, 185– 199, doi:10.1016/0021-9169(59)90031-5, 1959.
Allcock, G. M. and McNeill, F. A.: The Reception of Whistler Mode Signals at a Point Remote from the Transmitter’s Magnetic Conjugate Point, J. Geophys. Res., 71, 2285–2294, 1966. Andrews, M.: Non-ducted whistler-mode signals at low latitudes,
J. Atmos. Terr. Phys., 40, 429–436, doi:10.1016/0021-9169(78) 90174-5, 1978.
Bernard, L. C.: A new nose extension method for whistlers, J. At-mos. Terr. Phys., 35, 871–880, 1973.
Bernhardt, P. A. and Park, C. G.: Protonospheric-Ionospheric Mod-eling of VLF Ducts, J. Geophys. Res., 82, 5222–5230, doi: 10.1029/JA082i032p05222, 1977.
Bernstein, S. L., Burrows, M. L., Evans, J. E., Griffiths, A. S., McNeil, D. A., Niessen, C. W., Richer, I., White, D. P., and Willim, D. K.: Long-Range Communications at Extremely Low Frequencies, Proc. IEEE, 62, 292–312, 1974.
Bortnik, J., Inan, U. S., and Bell, T. F.: Frequency-time spectra of magnetospherically reflecting whistlers in the plasmasphere, J. Geophys. Res., 108, 1030, doi:10.1029/2002JA009387, 2003a. Bortnik, J., Inan, U. S., and Bell, T. F.: Energy distribution and
life-time of magnetospherically reflecting whistlers in the plasmas-phere, J. Geophys. Res., 108, 1199, doi:10.1029/2002JA009316, 2003b.
Carpenter, D. L.: Whistler evidence of a ‘knee’ in the magneto-spheric ionization density profile, J. Geophys. Res., 68, 1675– 1682, 1963.
Carpenter, D. L. and Orville, R. E.: The Excitation of Active Whistler Mode Signal Paths in the Magnetosphere by Lightning: Two Case Studies, J. Geophys. Res., 94, 8886–8894, 1989. Chapman, F. W., Jones, D. L., Todd, J. D. W., and Challinor,
R. A.: Observations on the Propagation Constant of the Earth-Ionosphere Waveguide in the Frequency Band 8 c/s to 16 kc/s, Radio Sci., 1, 1273–1282, 1966.
Christian, H. J., Blakeslee, R. J., Boccippio, D. J., Boeck, W. L., Buechler, D. E., Driscoll, K. T., Goodman, S. J., Hall, J. M., Koshak, W. J., Mach, D. M., and Stewart, M. F.: Global fre-quency and distribution of lightning as observed from space by the Optical Transient Detector, J. Geophys. Res., 108, 4005, doi: 10.1029/2002JD002347, 2003.
Chum, J., Jiricek, F., Santolik, O., Parrot, M., Diendorfer, G., and Fiser, J.: Assigning the causative lightning to the whistlers ob-served on satellites, Ann. Geophys., 24, 2921–2929, 2006, http://www.ann-geophys.net/24/2921/2006/.
Clilverd, M. A. and Horne, R. B.: Ground-based evidence of latitude-dependent cyclotron absorption of whistler mode signals originating from VLF transmitters, J. Geophys. Res., 101, 2355– 2367, 1996.
Clilverd, M. A., Thomson, N. R., and Smith, A. J.: Observation of two preferred propagation paths for whistler mode VLF signals received at a non-conjugate location, J. Atmos. Terr. Phys., 54, 1075–1079, doi:10.1016/0021-9169(92)90073-T, 1992. Clilverd, M. A., Rodger, C. J., and Nunn, D.: Radiation belt electron
precipitation fluxes associated with lightning, J. Geophys. Res., 109, A12208, doi:10.1029/2004JA010644, 2004.
southern Africa and correlation with European whistler observa-tions, Ann. Geophys., 24, 529–542, 2006,
http://www.ann-geophys.net/24/529/2006/.
Collier, A. B., Delport, B., Hughes, A. R. W., Lichtenberger, J., Steinbach, P., ¨Oster, J., and Rodger, C. J.: Correlation between Lightning and Whistlers observer at Tihany, Hungary, J. Geo-phys. Res., 114, A07210, doi:10.1029/2008JA013863, 2009. Crombie, D. D.: Nonreciprocity of propagation of VLF radio waves
along the magnetic equator, Proc. IEEE, 51, 617–618, 1963. Denton, R. E., Menietti, J. D., Goldstein, J., Young, S. L., and
An-derson, R. R.: Electron density in the magnetosphere, J. Geo-phys. Res., 109, A09215, doi:10.1029/2003JA010245, 2004. Dowden, R. L. and Rodger, C. J.: True Global Mapping of
Light-ning Using Widely Spaced VLF Receivers on the Ground, in: 27th URSI General Assembly, Maastricht, http://www.ursi.org/ Proceedings/ProcGA02/papers/p0476.pdf, 2002.
Dowden, R. L., Brundell, J. B., and Rodger, C. J.: VLF light-ning location by time of group arrival (TOGA) at multiple sites, J. Atmos. Solar-Terr. Phys., 64, 817–830, doi:10.1016/ S1364-6826(02)00085-8, 2002.
Dowden, R. L., Holzworth, R. H., Rodger, C. J., Lichtenberger, J., Thomson, N. R., Jacobson, A. R., Lay, E., Brundell, J. B., Lyons, T. J., O’Keefe, S., Kawasaki, Z., Price, C., Prior, V., Ort´ega, P., Weinman, J., Mikhailov, Y., Woodman, R., Qie, X., Burns, G., Collier, A., Pinto Jr., O., Diaz, R., Adamo, C., Williams, E. R., Kumar, S., Raga, G. B., Rosado, J. M., Avila, E. E., Clilverd, M. A., Ulich, T., Gorham, P., Shana-han, T. J. G., Osipowicz, T., Cook, G., and Zhao, Y.: World-Wide Lightning Location Using VLF Propagation in the Earth-Ionosphere Waveguide, IEEE Antennas Propag. Mag., 50, 40– 60, doi:10.1109/MAP.2008.4674710, 2008a.
Dowden, R. L., Holzworth, R. H., Rodger, C. J., Lichtenberger, J., Thomson, N. R., Jacobson, A. R., Lay, E., Brundell, J. B., Lyons, T. J., O’Keefe, S., Kawasaki, Z., Price, C., Prior, V., Ort´ega, P., Weinman, J., Mikhailov, Y., Woodman, R., Qie, X., Burns, G., Collier, A., Pinto Jr., O., Diaz, R., Adamo, C., Williams, E. R., Kumar, S., Raga, G. B., Rosado, J. M., Avila, E. E., Clilverd, M. A., Ulich, T., Gorham, P., Shanahan, T. J. G., Osipowicz, T., Cook, G., and Zhao, Y.: World-Wide Lightning Location Using VLF Propagation in the Earth-Ionosphere Waveguide, The Radio Science Bulletin, 327, 39–53, 2008b.
Hansen, H. J., Scourfield, M. W. J., and Rash, J. P. S.: Whistler Duct Lifetimes, J. Atmos. Terr. Phys., 45, 789–794, 1983. Hayakawa, M., Tanaka, Y., Okada, T., and Ohtsu, J.: Time scales for
the formation, lifetime and decay of low latitude whistler ducts, Ann. Geopys., 1, 515–518, 1983.
Helliwell, R. A.: Whistlers and Related Ionospheric Phenomena, Stanford University Press, 1965.
Holzworth, R. H., Winglee, R. M., Barnum, B. H., Li, Y. Q., and Kelley, M. C.: Lightning whistler waves in the high-latitude mag-netosphere, J. Geophys. Res., 104, 17369–17378, 1999. Hughes, A. R. W.: Satellite measurements of whistler dispersion
at low latitudes, Adv. Space Res., 1, 377–380, doi:10.1016/ 0273-1177(81)90138-1, 1981.
Hughes, A. R. W. and Rice, W. K.: A satellite study of low latitude electron and proton whistlers, J. Atmos. Solar-Terr. Phys., 59, 1217–1222, doi:10.1016/S1364-6826(96)00111-3, 1997. Inan, U. S. and Bell, T. F.: The plasmapause as a VLF wave guide, J.
Geophys. Res., 82, 2819–2827, doi:10.1029/JA082i019p02819,
1977.
Jacobson, A. R., Holzworth, R. H., Harlin, J., Dowden, R. L., and Lay, E. H.: Performance Assessment of the World Wide Light-ning Location Network (WWLLN), Using the Los Alamos Sferic Array (LASA) as Ground Truth, J. Atmos. Ocean. Tech., 23, 1082–1092, 2006.
Koster, J. R. and Storey, L. R. O.: An Attempt to observe Whistling Atmospherics near the Magnetic Equator, Nature, 175, 36–37, doi:10.1038/175036a0, 1955.
Ladwig, J. M. and Hughes, A. R. W.: An asymmetry in the direction of arrival of whistlers at Sanae, Antarctica, J. Atmos. Terr. Phys., 51, 61–65, doi:10.1016/0021-9169(89)90105-0, 1989.
Lay, E. H., Holzworth, R. H., Rodger, C. J., Thomas, J. N., Pinto Jr., O., and Dowden, R. L.: WWLL global lightning detection system: Regional validation study in Brazil, Geophys. Res. Lett., 31, L03102, doi:10.1029/2003GL018882, 2004.
Lay, E. H., Jacobson, A. R., Holzworth, R. H., Rodger, C. J., and Dowden, R. L.: Local time variation in land/ocean light-ning flash density as measured by the World Wide Lightlight-ning Lo-cation Network, J. Geophys. Res., 112, D13111, doi:10.1029/ 2006JD007944, 2007.
Lehtinen, N. G. and Inan, U. S.: Full-wave modeling of transiono-spheric propagation of VLF waves, Geophys. Res. Lett., 36, L03104, doi:10.1029/2008GL036535, 2009.
Li, Y. Q., Holzworth, R. H., Hu, H., McCarthy, M., Massey, R. D., Kintner, P. M., Rodrigues, J. V., Inan, U. S., and Armstrong, W. C.: Anomalous Optical Events Detected by Rocket-Borne Sensor in the WIPP Campaign, J. Geophys. Res., 96, 1315–1326, 1991.
Lichtenberger, J., Ferencz, C., Bodn´ar, L., Hamar, D., and Stein-bach, P.: Automatic Whistler Detector and Analyzer system: Au-tomatic Whistler Detector, J. Geophys. Res., 113, A12201, doi: 10.1029/2008JA013467, 2008.
Mackerras, D. and Darveniza, M.: Latitudinal variation of lightning occurrence characteristics, J. Geophys. Res., 99, 10813–10822, 1994.
Maeda, K. and Kimura, I.: Calculation of the propagation path of whistling atmospherics, J. Atmos. Terr. Phys., 15, 58–65, doi: 10.1016/0021-9169(59)90170-9, 1959.
Menk, F. W., Mann, I. R., Smith, A. J., Waters, C. L., Clilverd, M. A., and Milling, D. K.: Monitoring the plasmapause using ge-omagnetic field line resonances, J. Geophys. Res., 109, A04216, doi:10.1029/2003JA010097, 2004.
Parrot, M., Sauvaud, J. A., Berthelier, J. J., and Lebreton, J. P.: First in-situ observations of strong ionospheric perturbations gener-ated by a powerful VLF ground-based transmitter, Geophys. Res. Lett., 34, L11111, doi:10.1029/2007GL029368, 2007.
Price, C.: Global surface temperatures and the atmospheric elec-trical circuit, Geophys. Res. Lett., 20, 1363–1366, doi:10.1029/ 93GL01774, 1993.
Rao, M., Somayajulu, V. V., Dikshit, S. K., and Tantry, B. A. P.: Low-Latitude Cutoff for Whistlers Observed on the Ground, J. Geophys. Res., 79, 3867–3869, 1974.
Rodger, C. J., Brundell, J. B., and Dowden, R. L.: Location accu-racy of VLF World-Wide Lightning Location (WWLL) network: Post-algorithm upgrade, Ann. Geophys., 23, 277–290, 2005, http://www.ann-geophys.net/23/277/2005/.
the VLF World-Wide Lightning Location Network (WWLLN): initial case study, Ann. Geophys., 24, 3197–3214, 2006, http://www.ann-geophys.net/24/3197/2006/.
Rodger, C. J., Enell, C.-F., Turunen, E., Clilverd, M. A., Thom-son, N. R., and Verronen, P. T.: Lightning-driven inner radi-ation belt energy deposition into the atmosphere: implicradi-ations for ionisation-levels and neutral chemistry, Ann. Geophys., 25, 1745–1757, 2007,
http://www.ann-geophys.net/25/1745/2007/.
Rodger, C. J., Lichtenberger, J., McDowell, G., and Thom-son, N. R.: Automatic Whistler Detection: Operational Re-sults from New Zealand, Radio Sci., 44, RS2004, doi:10.1029/ 2008RS003957, 2008.
Rodger, C. J., Brundell, J. B., and Holzworth, R. H.: Improve-ments in the WWLLN Network: Bigger Detection Efficiencies Through More Stations and Smarter Algorithms, Paper presented at the IAGA 11th Scientific Assembly, Sopron, Hungary, 201-MON-O1415-0989, 2009.
Ruhnke, L. H. and Latham, J. (Eds.): Proceedings in Atmospheric Electricity, A. Deepak Publishing, 1983.
Santol´ık, O., Parrot, M., Inan, U. S., Bure˘sov´a, D., Gurnett, D. A., and Chum, J.: Propagation of unducted whistlers from their source lightning: A case study, J. Geophys. Res., 114, A03212, doi:10.1029/2008JA013776, 2009.
Sazhin, S. S., Hayakawa, M., and Bullough, K.: Whistler diagnos-tics of magnetospheric parameters: A review, Ann. Geopys., 10, 293–308, 1992.
Shimakura, S., Tsubaki, A., and Hayakawa, M.: Very unusual low latitude whistlers with additional traces of the Earth-ionosphere waveguide propagation effect, J. Atmos. Terr. Phys., 49, 1081, doi:10.1016/0021-9169(87)90091-2, 1987.
Shklyar, D. R., Chum, J., and Jir´ıˇcek, F.: Characteristic properties of Nu whistlers as inferred from observations and numerical mod-elling, Ann. Geophys., 22, 3589–3606, 2004,
http://www.ann-geophys.net/22/3589/2004/.
Smith, A. and Jenkins, P.: A survey of natural electromagnetic noise in the frequency range f=1–10 kHz at Halley station, Antarc-tica. 1. Radio atmospherics from lightning, J. Atmos. Solar-Terr. Phys., 60, 263–277, doi:10.1016/S1364-6826(97)00057-6, 1998.
Smith, R. L.: Propagation Characteristics of Whistlers Trapped in Field-Aligned Columns of Enhanced Ionization, J. Geophys. Res., 66, 3699–3707, doi:10.1029/JZ066i011p03699, 1961. Smith, R. L. and Brice, N.: Propagation in
Multicompo-nent Plasmas, J. Geophys. Res., 69, 5029–5040, 10.1029/ JZ069i023p05029, 1964.
Sonwalkar, V. S. and Harikumar, J.: An explanation of ground ob-servations of auroral hiss: Role of density depletions and meter-scale irregularities, J. Geophys. Res., 105, 18867–18883, 2000. Starks, M. J., Quinn, R. A., Ginet, G. P., Albert, J. M., Sales, G. S.,
Reinisch, B. W., and Song, P.: Illumination of the plasmasphere by terrestrial very low frequency transmitters: Model validation, J. Geophys. Res., 113, A09320, doi:10.1029/2008JA013112, 2008.
Storey, L. R. O.: An Investigation of Whistling Atmospherics, Phil. Trans. Roy. Soc., A–246, 113–141, 1953.
Thomson, N. R.: Reflection of VLF radio waves from distant moun-tain ranges, J. Atmos. Terr. Phys., 47, 353–362, doi:10.1016/ 0021-9169(85)90015-7, 1985.
Thorne, R. M. and Horne, R. B.: Landau Damping of Magneto-spherically Reflected Whistlers, J. Geophys. Res., 99, 17249– 17258, 1994.
Wait, J. R.: Electromagnetic Waves in Stratified Media, vol. 3 of International Series of Monographs on Electromagnetic Waves, Pergamon Press, New York, 1962.
Weidman, C. D., Krider, E. P., Park, C. G., and Blockley, B.: Corre-lated Measurements of Lightning Radiation Fields and Whistlers, in: Ruhnke and Latham (1983), pp. 334–337, 1983.
![Table 1. Seasonal daily whistler count [day−1] at Dunedin as afunction of Northern Hemisphere season.](https://thumb-us.123doks.com/thumbv2/123dok_us/8162540.250036/4.595.94.241.101.169/table-seasonal-whistler-dunedin-afunction-northern-hemisphere-season.webp)