Ann. Geophys., 28, 11–16, 2010 www.ann-geophys.net/28/11/2010/
© Author(s) 2010. This work is distributed under the Creative Commons Attribution 3.0 License.
Annales
Geophysicae
Communica
tes
Role of mixed precipitating cloud systems on the typhoon rainfall
C. J. Pan1, K. Krishna Reddy2, H. C. Lai3, and S. S. Yang1
1Institute of Space Science, National Central University, Taiwan 2Dept. of Physics, Yogi Vemana University, Kadapa, India
3Dept. of Eng. & Manag. of Advanced Tech., Chang Jung Christian University, Taiwan Received: 21 October 2009 – Accepted: 14 December 2009 – Published: 8 January 2010
Abstract. L-band wind profiler data are utilized to diagnose
the vertical structure of the typhoon precipitating cloud sys-tems in Taiwan. For several typhoons, a pronounced bright band (BB) around 5 km is commonly observed from the ob-servation. Since strong convection within typhoon circula-tion may disturb and/or disrupt the melting layer, the BB shall not appear persistently. Hence, an understanding of the vertical structure of the BB region is important because it holds extensive hydrometeors information on the type of precipitation and its variability. Wind profiler observational results suggest that the mixture of convective and strati-form (embedded type) clouds are mostly associated with ty-phoons. In the case of one typhoon, BB is appeared around 5.5 km with embedded precipitation and also BB height of 1 km higher than ordinary showery precipitation. This is ev-ident from the long-term observations of wind profiler and Tropical Rainfall Measuring Mission. The Doppler veloc-ity profiles show hydrometers (ice/snow) at 6 km but liquid below 5 km for typhoons and 4 km for showery precipita-tion. In the BB region the melting particles accelerations of 5.8 ms−1km−1and 3.2 ms−1km−1are observed for typhoon and showery precipitation, respectively.
Keywords. Meteorology and atmospheric dynamics
(Pre-cipitation)
1 Introduction
Typhoons in the West Pacific Ocean, where Taiwan Island is located, are equivalent to hurricanes in the west coast of the US originated by the warmer sea temperature in West Pa-cific Ocean and the southwest monsoons from South China
Correspondence to: C. J. Pan
(cjpan@jupiter.ss.ncu.edu.tw)
Sea, there are in general five to ten typhoons affected Tai-wan every summer and early autumn. Typhoons are the most serious meteorological phenomena that threaten East Asia and those islands of Cuba, Hispaniola, and Puerto Rico in the Caribbean, as well as Luzon in the northern Philippines (Wu and Kuo, 1999). In 2005, Hurricane Katrina caused se-vere destruction along the Gulf coast from central Florida to Texas. The most severe loss of life and property damage occurred in New Orleans, Louisiana since 80% of the city became flooded and the floodwaters lingered for weeks.
Recently in 2009, typhoon Morakot, a vast, slow-moving tropical storm packing heavy rains, blew through Taiwan on 7 and 8 August. The volume of water it dropped on the is-land, about 2.5 m, was the highest in five decades. Southern areas of the island encountered more rainfall in one day than they normally observed in one year. As pointed by the Cen-tral Weather Bureau of Taiwan, a longer residence time, a wider storm radius and an unsymmetrical structure are three major reasons that the storm caused the record-breaking pre-cipitation over southern Taiwan. The disastrous prepre-cipitation triggered widespread flooding, debris flows, and landslides results in more than 670 deaths, 85 missing, 27 bridges col-lapsed and numerous miles of road washed away, and more than 4.8 billion US dollars economic loss. This disaster could result from a natural hazard and an example of possible outcomes of climate change. As the tremendous increased amounts of precipitation becomes more and more frequent, understanding of the vertical structure of the typhoon pre-cipitating cloud system becomes important issue and needs further investigations.
12 C. J. Pan et al.: Role of mixed precipitating cloud systems on the typhoon rainfall unlike microwave frequencies over 10 GHz. Another
advan-tage of the wind profiler is to measure directly the vertical wind component within a convective environment (Gage et al., 1994). Three moment’s data of wind profiler, namely, reflectivity, Doppler velocity, and spectral width allow us to retrieve the drop size distribution (DSD) of rain (Williams, 2002).
The melting layer has been identified as a possible source of bias in microwave rainfall retrievals in stratiform regions (Olson et al., 2001). Several researchers [Tokay et al., 1999; Atlas and Williams, 2003; Teshiba et al., 2009] have used wind profiler to reveal details about the vertical structure of precipitating cloud systems associated with mesoscale and large scale precipitating environments. Chandrasekar and Khajonrat (2006) utilized the Tropical Rainfall Measuring Mission (TRMM) satellite Precipitation Radar (PR) for a systematic study of vertical profile of reflectivity (VPR) of hurricanes over North Atlantic, typhoons over North West-ern Pacific and cyclones over South Indian Ocean. Yang and Houze (1995) indicated that the simulated dynamic and kinematic features, such as rear inflow, of a squall-line type mesoscale convective system are highly sensitive to the mi-crophysical parameterization scheme employed in the model. Wang (2002) further showed in his idealized tropical cyclone (TC) simulations that the cloud structures of the simulated TC are quite sensitive to the cloud microphysics scheme.
As wind profilers, Doppler radar, modeling studies and space-based rainfall retrieval algorithms have gained in so-phistication and hence need to properly address the bright band issue. In this paper, effect of bright band on heavy rain-fall associated with different typhoons is studied by using an L-band wind profiler and TRMM.
2 Experimental set-up
In 2006 the DEGREWIND PCL1300 profiler was deployed at an industrial park (120.38◦E, 22.6◦N) close to Kao-Hsiung city in the southern Taiwan and operated continu-ously almost every day in order to observe the clear and precipitation echoes in the lower atmosphere. It was then moved to downtown Kao-Hsiung (120.29◦E, 22.69◦N) from
the spring of 2008. The topography of Taiwan and the lo-cation of wind profiler are referred to the Fig. 1 of Pan et al. (2008). The main characteristics of this profiler radar are a 1290-MHz transmitted frequency, with a 4-kW peak pulse power, a 25-kHz pulse repetition frequency, and a 150-m pulse length. One vertical and four oblique bea150-ms, with an off-zenith angle of 17 degrees disposed every 90 degrees in azimuth, are swinging continuously to detect the winds. The altitude coverage is from 0.235 km to 6.543 km with a 150-m range resolution. 20 successive Doppler spectra obtained from a 128-point discrete Fourier transform are used to ex-tract the first three moments of the atmospheric echoes. The information about the echo power intensity, radial winds as
well as noise level is then deduced. We further incoherently average the derived products in the time domain to present the horizontal winds and the signal-to-noise ratio (SNR) at every 30 min. For more details on technical information of this wind profiler, refer to Heo et al. (2003).
The observations with the L-band wind profiler were car-ried out fairly continuously since its inception during the end of December 2005. A total of 342 days of wind profiler data are available from 1 January 2006 to 31 December 2006 for analysis. During the observational period, non-availability of the data for a few days was mainly due to system main-tenance and system failure. It then was implemented for se-vere weather observation only since 2007. Monthly aver-aged bright band heights from the Tropical Rainfall Measur-ing Missions’ 3A25 monthly product statistical data for the year 2006 are also utilized for present study. For more de-tails on Tropical Rainfall Measuring Mission (TRMM) and data products, refer to Kummerow and Giglio (1994).
Williams et al. (1995) classified wind profiler observed precipitating cloud system as a deep convection, shallow convection, mixed (convection/stratiform), stratiform types. White et al. (2002) proposed a method for bright band height detection algorithm by using the change rate of signal to noise ratio to the altitude and reflectivity profile for the pur-pose of monitoring the melting level forecasting. Since the physical and dynamical processes of air motion in stratiform clouds are different from convective clouds. And also the vertical profiles of latent heat released in the atmospheric are distinctly different for convective and stratiform precipitat-ing cloud systems. For the present study, we adopted hy-brid algorithm based on Williams et al. (1995) and White et al. (2002) the vertical structure of the precipitating cloud sys-tems as deep/shallow convective (without existence of bright band), merged clouds (mixture of convective and stratiform clouds developed due to expansion of convection cloud into a broad hinged/banded cloud system with BB existence be-low 4.5 km altitude), Embedded clouds (several relatively high intensity convection cells are formed inside a stratiform cloud system with BB existence above 5 km altitude) and weak stratiform (BB presence without convective clouds).
3 Results and discussions
C. J. Pan et al.: Role of mixed precipitating cloud systems on the typhoon rainfall 13
Fig.1 Observation during the passage of Typhoon Morakot during 7-8 August 2009.
(a)
Time-height Cross section of range-corrected Signal-to-Noise ratio (dB) and
(b) hourly rainfall accumulation at Zuoying. Meteorological Station,
Fig. 1. Observation during the passage of Typhoon Morakot during 7–8 August 2009. (a) Time-height Cross section of range-corrected
Signal-to-Noise ratio (dB) and (b) hourly rainfall accumulation at Zuoying. Meteorological Station.
distance of about 60 km and 20 km, respectively. More in-formation refers to Pan et al. (2008). On the other hand, strong typhoon Jangmi and moderate typhoon Morakot made landfall at the northeastern Taiwan with the distances about 250 km and 200 km, respectively to the observation site. Due to the big size of these two typhoons, strong precip-itations caused by the storms are recorded although their centers are far from the observation site. The shape of the Doppler spectra is characterized by the first three spectral moment information about the hydrometeors in the precip-itating cloud systems. The moments yield the reflectivity [Signal-to-Noise Ratio (SNR), dB] of the hydrometeors, the reflectivity-weighted fall speed of the hydrometeors and the variance of the hydrometeor fall speeds within the observing volume. By identifying the appearance of melting layer that causes a “bright band” feature in the echo power profiles, and determining the presence of turbulence or hydrometeors, the vertical structure of the precipitating cloud systems are investigated.
Figure 1a shows wind profiler observation of time-height cross-section of range corrected SNR during the passage of devastating typhoon Morakot. Pronounced bright and is con-tinuously observed around 5.5 km with increased reflectiv-ity in the area where ice crystals are melting. It is caused when relatively large, low-density ice particles acquire di-electric properties that are more similar to those of water be-fore they collapse into water droplets below the melting layer (Battaglia et al., 2003).
From Fig. 1a one can notice a bright band around 5.5 km altitude from 04 Z to 01 Z next day. Due to electric power failure, wind profiler operation was stopped at 04 Z. Wind profiler observations show that the convective cells embed-ded in stratiform precipitation quite often appears and it is primarily responsible for heavy rainfall over large region of Taiwan. The precipitation caused by the embedded
precipi-tating clouds lasted more than 24 h with 440 mm of rainfall accumulated over Zuoying (about 300 m away from wind profiler site) weather station (Fig. 1b). During the typhoon Morakot invading period, the TRMM satellite also measured excess of 600 mm of rain in the southern Taiwan (figure not shown).
We have observed 10 typhoon cases that are announced by the Central Weather Bureau of Taiwan since 2006 on-wards. Among those 10 typhoons, 4 of them made land-fall over Taiwan and produced moderate to heavy rainland-fall. Figure 2 shows the vertical profiles of SNR of those landed typhoons at the time that the storm centers are at the clos-est distance to the observation site. In addition, to compare the bright band features of typhoon precipitation, an after-noon shower precipitating clouds (on 14 September 2006) is also used because the background condition in the melting layer may vary significantly for different precipitation events. Wind profiler observational results for those 10 typhoons (the remaining un-landed typhoon cases are not shown in this fig-ure) all show the bright band occurred above 5 km altitude and, moreover, for typhoon Morakot around 5.5 km. This high bright band altitude phenomenon seems to be common in Taiwan area for all the precipitation associated with ty-phoon.
Figure 3 shows the vertical profiles of Doppler velocity observed during passage of four landed typhoons and show-ery precipitation overhead of the wind profiler with the same periods as presented in the Fig. 2.
[image:3.604.87.512.69.247.2]14 C. J. Pan et al.: Role of mixed precipitating cloud systems on the typhoon rainfall
2
Fig.2: Vertical Profiles of Signal-to-Noise Ratio [SNR (dB)] Observed during passage of four different typhoons and showery precipitation overhead of the wind profiler. Fig. 2. Vertical Profiles of Signal-to-Noise Ratio [SNR (dB)]
Ob-served during passage of four different typhoons and showery pre-cipitation overhead of the wind profiler.
ordinary shower are noticed in the Fig. 3. In Morakot case, rain forms from 5 km which is 1 km higher than shower pre-cipitation. Therefore, one can find that the Doppler veloc-ity gradient (DVG) of hydrometers in the case of Morakot is 5.8 ms−1km−1whereas 3.2 ms−1km−1 for shower precipi-tation. This information may reveal the different acceleration process in the microphysical changes for typhoon and show-ery rainfall.
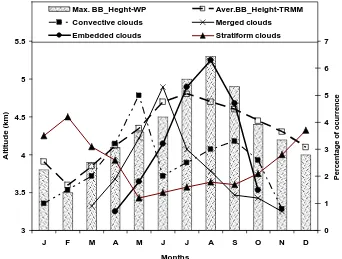
In order to investigate the effect of the melting layer/bright band height on typhoon precipitating clouds (observed dur-ing July to September), and other types of precipitatdur-ing clouds (such as Meiyu, showery and winter precipitation clouds), long period wind profiler and TRMM data from Jan-uary 2006–December 2006 has been analyzed. Wind profiler observed 10 typhoons and 59 other precipitating cloud sys-tems are used for analysis. Figure 4 shows the monthly oc-currence of height of the melting layer/bright band and occur-rence percentage of (all cloud fractions) convective clouds, merged clouds, embedded clouds and weak stratiform clouds observed during January to December 2006. In the present study we have mainly focused on embedded clouds to know the physical processes responsible for heavy rainfall and bright band height observations from wind profiler
[image:4.604.309.556.70.387.2](indi-3
Fig.3: Vertical profiles of Doppler velocity observed during passage of four typhoons and showery precipitation overhead of the wind profiler.
Fig. 3. Vertical profiles of Doppler velocity observed during
pas-sage of four typhoons and showery precipitation overhead of the wind profiler.
[image:4.604.51.296.73.380.2]C. J. Pan et al.: Role of mixed precipitating cloud systems on the typhoon rainfall 15
4
33.5 4 4.5 5 5.5
J F M A M J J A S O N D
Months
A
lti
tu
d
e
(
k
m
)
0 1 2 3 4 5 6 7
P
e
rc
e
n
ta
ge of
o
c
u
rr
e
nce
Max. BB_Heght-WP Aver.BB_Height-TRMM
Convective clouds Merged clouds
Embedded clouds Stratiform clouds
Fig. 4 Monthly occurrence of height of the melting layer/bright band and Occurrence percentage of Convective clouds, Merged clouds, Embedded clouds and Stratiform clouds observed during January to December 2006. Bright band height observations from Wind profiler (indicates as bar, maximum height of the Bright Band and also excluding Typhoon precipitating clouds) and also from Tropical Rainfall Measuring Mission (indicated as dash with open square symbol).
Fig. 4. Monthly occurrence of height of the melting layer/bright band and Occurrence percentage of Convective clouds, Merged clouds,
Embedded clouds and Stratiform clouds observed during January to December 2006. Bright band height observations from Wind profiler (indicates as bar, maximum height of the Bright Band and also excluding Typhoon precipitating clouds) and also from Tropical Rainfall Measuring Mission (indicated as dash with open square symbol).
In this study, wind profiler and TRMM observations on ty-phoons suggest the high bright band altitude associated with stratiform precipitation and accompanied with convection systems has a severe impact on the rainfall over Taiwan.
L-band wind profiler observations during the year 2006 demonstrate that for typhoons the bright band existed above 5 km and in case of showery precipitation around 4.5 km. The characteristics of the bright band may reveal important cloud microphysical processes. With the topography induced modifications, the cloud and precipitation developments over the mountainous area are expected to be different from those over a coastal region. Cha et al. (2009) made a long term measurement of Micro Rain Radar at two sites (mountain re-gion and a coastal rere-gion) in Korea and found that stratiform precipitation was more prevalent at the mountain site, but convective precipitation tended to occur more at the coastal site. As the observation site locates near the coast with more than 35 km away from the nearest mountain, the topography effect may not play a dominant role in the variation of melt-ing levels. Fabry and Zawadzki (1995) reported that the mix-ture of ice, air, and water leads to a greater increase in the radar reflectivity than that expected from the change from ice to water. Although the convection takes place in the typhoon precipitation, the thermo-dynamical process shall be differ-ent from the convection classified by Williams et al. (1995) that detects no bright band. Moreover, the altitude
varia-tion of the melting levels for different typhoons is significant. This may be due to the diverse features of different typhoons with variant tracks, intensities and distances with respect to the wind profiler. We may conclude that the high bright band associated with embedded convection is a common feature of the typhoon precipitation in the island. However, the re-lation between the elevated melting layer and the embedded convection needs further investigation.
4 Summary and conclusions
[image:5.604.126.468.71.330.2]16 C. J. Pan et al.: Role of mixed precipitating cloud systems on the typhoon rainfall
Acknowledgements. This wind profiler is operated by the Envi-ronmental Protection Administration (EPA) of Taiwan; R.O.C. C. J. Pan is supported by the NSC of Taiwan, R.O.C. through grant NSC 98-2111-M-008-009.
Topical Editor P. Drobinski thanks K. Gage for his help in eval-uating this paper.
References
Atlas, D. and Williams, C. R.: The Anatomy of a continental tropi-cal convective storm, J. Atmos. Sci., 60, 3–15, 2003.
Battaglia, A., Kummerow, C., Shin, D. B., and Williams, C.: Con-straining Microwave Brightness Temperatures by Radar Bright-band Observations, J. Atmos. Oceanic Technol., 20, 856–871, 2003.
Cha, J.-W., Chang, K.-H., Yum, S. S., and Choi, Y.-J.: Compari-son of the Bright Band Characteristics Measured by Micro Rain Radar (MRR) at a Mountain and a Coastal Site in South Korea, Adv. Atmos. Sci., 26, 211–221, 2009.
Chandrasekar, V. and Khajonrat, D.: Comparison of vertical struc-tures of Hurricanes Typhoons and Cyclones as observed by Spaceborne Precipitation Radar, Proc. of SPIE, 6410, 64100B, doi:10.1117/12.693359, 2006.
Chang, W. Y., Chen Wang, T. C., and Lin, P. L.: The Characteristics of Raindrop Size Distribution and Drop shape Relation in Ty-phoon Systems in the Western Pacific from 2D-Video Disdrom-eter and NCU C-Band Polarimetric Radar, J. Atmos. Oceanic Technol., 26, 1973–1993, doi:10.1175/2009JTECHA1236.1, 2009.
Ecklund, W. L., Gage, K. S., and Williams, C. R.: Tropical pre-cipitation studies using a 915 MHz wind profiler, Radio Sci., 30, 1055–1064, 1995.
Fabry, F. and Zawadzki, I.: Long-term radar observation of the melt-ing layer of precipitation and their interpretation, J. Atmos. Sci., 52, 838–851, 1995.
Gage, K. S., Williams, C. R., and Ecklund, W. L.: UHF wind profil-ers: A new tool for diagnosing tropical convective cloud systems, B. Am. Meteorol. Soc., 75, 2289–2294, 1994.
Heo, B.-H., Jacoby-Koaly, S., Kim, K.-E., Campistron, B., Benech, B., and Jung, E.-S.: Use of the Doppler spectral width to improve the estimation of the convective boundary layer height from UHF wind profiler observations, J. Atmos. Oceanic Technol., 20, 408– 424, 2003.
Kummerow, C. and Giglio, L.: A passive microwave technique for estimating rainfall and vertical structure information from space. Part I: Algorithm description, J. Appl. Meteor., 33, 3–18, 1994. Olson, W. S., Bauer, P., Kummerow, C. D., Hong, Y., and Tao,
W.: A melting-layer model for passive/active microwave remote sensing applications. Part II: Simulation of TRMM observations, J. Appl. Meteor., 40, 1164–1179, 2001.
Pan, C. J., Lai, H. C., Yang, S. S., Reddy, K. K., and Chang, S.-C.: Wind profiler radar investigation on typhoon-orography interaction, Geophys. Res. Lett., 35, L24812, doi:10.1029/2008GL036368, 2008.
Teshiba, M. S., Chilson, P. B., Ryzhkov, A. V., Schuur, T. J., and Palmer, R. D.: A combined Wind Profiler and Polarimetric Weather Radar Method for the investigation of Precipitation and vertical velocities, J. Atmos. Oceanic Technol., 26, 1940–1954, doi:10.1175/2008JTECHA11021, 2009.
Tokay, A., Short, D. A., Williams, C. R., Ecklund, W. L., and Gage, K. S.: Tropical rainfall associated with convective and stratiform clouds: Intercomparison of disdrometer and profiler measure-ments, J. Appl. Meteorol., 38, 302–320, 1999.
Wang, Y.: An explicit simulation of tropical cyclones with a triply nested movable mesh primitive equation model: TCM3. Part II: Model refinements and sensitivity to cloud microphysics param-eterization, Mon. Weather Rev., 130, 3022–3036, 2002. White, A. B., Gottas, D. J., Strem, E. T., Ralph, F. M., and Neiman,
P. J.: An automated bright band height detection algorithm for use with Doppler radar spectral moment, J. Atmos. Oceanic Technol., 19, 687–697, 2002.
Williams, C. R., Ecklund, W. L., and Gage, K. S.: Classification of precipitating clouds in the tropics using 915-MHz wind profilers, J. Atmos. Oceanic Technol., 12, 996–1012, 1995.
Williams, C. R.: Simultaneous ambient air motion and raindrop size distributions retrieved from UHF vertical incident profiler ob-servations, Radio Sci., 37(2), 1024, doi:10.1029/2000RS002603, 2002.
Wu, C.-C. and Kuo, Y.-H.: Typhoon affecting Taiwan: current un-derstanding and future challenges, B. Am. Meteorol. Soc., 80, 67–80, 1999.

![Fig. 2. Fig.2: Vertical Profiles of Signal-to-Noise Ratio [SNR (dB)] Observed during passage of Vertical Profiles of Signal-to-Noise Ratio [SNR (dB)] Ob-served during passage of four different typhoons and showery pre-four different typhoons and showery precipitation overhead of the wind profiler.](https://thumb-us.123doks.com/thumbv2/123dok_us/8162698.250078/4.604.51.296.73.380/vertical-profiles-observed-vertical-proles-different-different-precipitation.webp)