www.biogeosciences.net/8/551/2011/ doi:10.5194/bg-8-551-2011
© Author(s) 2011. CC Attribution 3.0 License.
Biogeosciences
Contribution of riverine nutrients to the silicon biogeochemistry of
the global ocean – a model study
C. Y. Bernard1, H. H. D ¨urr2, C. Heinze1, J. Segschneider3, and E. Maier-Reimer3
1Bjerknes Centre for Climate Research, Geophysical Institute, University of Bergen, All´egaten 70, 5007 Bergen, Norway 2Department of Physical Geography, Faculty of Geosciences, Utrecht University, The Netherlands
3Max-Planck-Institute for Meteorology, 20146, Hamburg, Germany
Received: 17 June 2010 – Published in Biogeosciences Discuss.: 25 June 2010 Revised: 11 February 2011 – Accepted: 21 February 2011 – Published: 4 March 2011
Abstract. Continental shelf seas are known to support a
large fraction of the global primary production. Yet, they are mostly ignored or neglected in global biogeochemical models. A number of processes that control the transfer of dissolved nutrients from rivers to the open ocean remain poorly understood. This applies in particular to dissolved sil-ica which drives the growth of diatoms that form a large part of the phytoplankton biomass and are thus an important con-tributor to export production of carbon.
Here, the representation of the biogeochemical cycling along continents is improved by coupling a high resolution database of riverine fluxes of nutrients to the global bio-geochemical ocean general circulation model HAMOCC5-OM. Focusing on silicon (Si), but including the whole suite of nutrients – carbon (C), nitrogen (N) and phosphorus (P) in various forms – inputs are implemented in the model at coastal coupling points using the COSCAT global database of 156 mega-river-ensemble catchments from Meybeck et al. (2006). The catchments connect to the ocean through coastal segments according to three sets of criteria: natural limits, continental shelf topography, and geophysical dynam-ics.
According to the model the largest effects on nutrient con-centrations occur in hot spots such as the Amazon plume, the Arctic – with high nutrient inputs in relation to its total vol-ume, and areas that encounter the largest increase in human activity, e.g., Southern Asia.
Correspondence to: C. Y. Bernard
1 Introduction
Continental shelf seas play a crucial role in biogeochemi-cal fluxes from the continents to the open ocean. They are known to support a large part of the global primary produc-tion (Conley et al., 1993; Rabouille et al., 2001): they make up for only 8% of the ocean surface but 25% of the ocean primary production (Ver et al., 1999). They are also highly sensitive to human perturbations (Ver et al., 1999). The high level of production is supported by complex dynamics in-cluding interplay of riverine supply of nutrients with coastal processes such as tidal currents or upwelling. Our perception of the functioning of the biogeochemical cycles in the global ocean requires a better understanding of the processes tak-ing place on the continental margins (Jahnke, 2010). Global biogeochemical models partly fail to integrate processes tak-ing place on the continental margins such as benthic/pelagic coupling, tidal currents mixing, coastal upwelling driven by wind forcing or general circulation and the land/ocean inter-action; they reproduce only crudely the nutrient enrichment supported by coastal upwelling.
Taking into account this context, continental margins should be considered as a complex but essential interface be-tween land and ocean, a contributor to global oceanic bio-geochemical cycles and not just as passive boundaries.
6.6 t km−2yr−1, i.e.>2×the global average, correspond to 17% of the global continental ice-free exorheic area but con-tribute 56% of DSi fluxes from the continents to the coastal zones. Pacific catchments hold most of the hyper-active ar-eas (>5×global average), probably due to a close connec-tion between tectonic activity and DSi fluxes resulting from silicate weathering.
In the open ocean, biogeochemical cycles follow a rel-atively simple scheme: plankton takes up nutrients, dies and sinks to the deep ocean. The sinking organic matter is progressively remineralised and only a very small frac-tion reaches the sea floor and is buried in the sediments on a geological time scale. This removal is assumed to be mainly balanced by the riverine input of silica (Ragueneau et al., 2010; Tr´eguer et al., 1995). The euphotic layer where plankton growth takes place is then fuelled by the currents that bring back the nutrients to allow plankton growth. The system is more complex on the continental shelf: first the sinking process is highly modified by eddies, then interac-tion of bathymetry with waves and tidal currents can lead to the resuspension of deposited organic matter, wind along the shore creates upwelling that brings nutrient rich waters rapidly back to the surface. Furthermore, many coastal wa-ters receive continuous fluxes of nutrients from the rivers. The riverine inputs are difficult to take into account in mod-els because of the lack of data for thousands of smaller rivers, which in total can contribute a significant amount of nutri-ents. A comprehensive work of data integration is neces-sary to build up a database covering the entire world, and not only limited to the major rivers. This new generation of database is now made available: D¨urr et al. (2009), Meybeck et al. (2006) and the Global-NEWS project (Seitzinger et al., 2005).
Detailed regional models succeed in describing the pro-gressive transfer of nutrients from estuarine areas to the ad-jacent sea (Fennel et al., 2011; Kroeze and Seitzinger, 1998; Lancelot et al., 2007; Rabalais et al., 1996), but only few efforts, mostly through global box modelling (Ver et al., 1999), have been made to study the land/ocean coupling at the global scale (Da Cunha et al., 2007). Recent modelling studies successfully pointed out the sensitivity of shelf seas to anthropogenic perturbations of the riverine loads but un-fortunately omitting riverine DSi inputs and focusing mostly on the carbon sink/source role of continental margins (Duck-low and McCallister, 2005; Liu et al., 2010; Mackenzie et al., 2005).
[image:2.595.308.547.63.211.2]Satellite-derived estimates of the chlorophyll concentra-tion give evidence of high primary producconcentra-tion in coastal ar-eas: 9 Pg C yr−1 according to Muller-Karger et al. (2005), while global models still fail to reproduce the belts of high chlorophyll concentration along the continents. Regional studies have tried to show the link between the reduc-tion/increase of primary production and changes in nutrient ratios as for example in the East China Sea after the Three Gorges Dam across the Yangtze River was built (Gong et
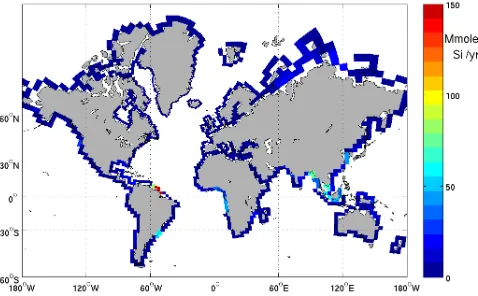
Fig. 1. Integrated annual flux of silica as added in the model grid,
according to the 129 coastal segments from the COSCAT approach. Riverine silica inputs are given in megamoles Si per year.
al., 2006). An increasing number of regions of the world (e.g. Chesapeake Bay, northern Adriatic Sea, Gulf of Mex-ico) have seen their jellyfish biomass increased, supported by an increasing riverine nutrient load due to human activity (crops fertilization and urban sewage) (Graham, 2001; Pur-cell et al., 1999). PurPur-cell et al. (2007) discussed the effect of fisheries combined with eutrophication. Fisheries affect the predator chain and favour jellyfish biomass by reduc-ing the grazreduc-ing pressure. Eutrophication benefits jellyfish by increasing small-zooplankton abundance, turbidity and hy-poxia, all conditions that may favour jellyfish over fish (Pur-cell et al., 2007).
As shown by Humborg et al. (2000), changes in N:Si and P:Si alter biogeochemistry and aquatic food webs in coastal marine environments since diatoms need silica to build up their siliceous frustules, and, in many coastal ecosystems, di-atoms are the dominant phytoplankton species and the basic element of the food web.
The insufficient integration of river contribution masks part of the potential of continental shelf seas productivity. In this work we demonstrate the importance of riverine inputs of DSi to the global biogeochemical cycles on the global scale by adding the riverine fluxes of nutrients to a global scale biogeochemical general circulation model (BGCM). Region-alized inputs allow highlighting the importance of dynamics in the export of the nutrients to the open ocean and how long these nutrients are available to support the plankton produc-tion before being exported out of the system. The DSi uptake to form the siliceous shells of diatoms and the riverine inputs of silica are necessary to balance the burial of opal (biogenic silica) in the sediments (Tr´eguer et al., 1995). The high reso-lution database (Fig. 1) of preindustrial riverine fluxes illus-trates the spatial heterogeneity of the riverine contribution to the marine silica cycle and allows for the first time a spatially resolved picture of effect of riverine DSi inputs on the ocean biogeochemistry.
2 Model and data base
2.1 Model and forcing
This work is based on simulations with two numerical mod-els, the ocean model MPI-OM (Marsland et al., 2003) and the biogeochemical model HAMOCC5 (Maier-Reimer, 1993; Maier-Reimer et al., 2005). The two models are coupled on-line and are running with the same vertical and horizontal resolution and the same time step.
The general circulation model MPI-OM grid is an orthog-onal curvilinear C-grid with an average resolution of 3◦. To
optimize calculations, the North Pole is artificially located over Greenland and the South Pole over Antarctica. The re-sulting resolution is from 29 km in the Arctic to about 390 km in the Tropics. The water column is divided vertically into 40 vertical levels whose thickness gradually increases with depth, from 12 m in the surface layer to a maximum of 600 m in the deep ocean. The time step of the calculations is 0.1 day. The biogeochemical model HAMOCC5 is based on the work of Reimer (1993) and Six and Maier-Reimer (1996). The HAMOCC5 model version used here is essentially identical with the one used by Wetzel (2004) and Wetzel et al. (2005). We will only discuss the features relevant for the study presented here, a complete description of HAMOCC5 and MPI-OM are available on internet (see the Technical descriptions, Maier-Reimer et al., 2005).
HAMOCC5 is a NPZD (Nutrient Plankton Zooplankton Detritus) model with one phytoplankton and one zooplank-ton box, photosynthesis is co-limited by N, P and Fe (Au-mont et al., 2003), and is driven by the same radiation val-ues as the OM. Temperature and salinity from MPI-OM are used to calculate chemical transformation rates and constants. In the surface layer, nitrate (NO3) dynamics (uptake and remineralisation) follows phosphate (PO4) dy-namics corrected by the Redfield ratio (molar element ra-tio: RN:P). There is no variation of the internal N:P ratio of particulate or dissolved constituents from surface layer processes. HAMOCC5 simulates processes of denitrifica-tion and N-fixadenitrifica-tion, formadenitrifica-tion of calcium carbonate due to coccolithophorides as well as foraminifera and opaline shells from diatom growth, sinking of detritus and marine snow, uptake and release of dissolved iron by biogenic particles, as well as atmospheric dust deposition and sinking (Maier-Reimer et al., 2005). Since the focus of this study is the riverine input of DSi, it is assumed here that there is no ae-olian input of dissolved silica (only iron and clay). The at-mospheric compartments allowed the computation of gases such as CO2, O2and N2and their fluxes at the air-sea sur-face intersur-face. In this version atmospheric carbon dioxide concentration is set to its preindustrial concentration, as are the riverine DSi inputs.
Phytoplankton growth depends on the availability of light and nutrients. The local light supply is calculated from the temporally and spatially varying solar radiation at the sea
surface. Beneath the surface, light intensity decreases with depth due to attenuation by sea water and chlorophyll.
The phytoplankton growth is assimilated to an amount of organic phosphorous (P) and is driven by the light availability and the limiting nutrient, Eqs. (1) and (2), which is defined as the least available nutrient (phosphate, nitrate, or iron). As-suming that phytoplankton takes up P, N, and Fe in constant proportions determined by the Redfield ratios, the potential limiting effect of each nutrient correspond to the concentra-tion of each nutrient multiplied by a stoichiometric coeffi-cient: 1/RN:Pand 1/RFe:P, Eq. (2).
Photosynthesis = Phy·L(z,t )· X KPO4
Phy+X
(1)
With
Phy: phytoplankton, KPO4
Phy: half-saturation constant for phosphate uptake, L(z;t ): light availability.
X=min
[PO4],[NO3] RN:P
, [Fe] RFe:P
(2) Zooplankton grazing on phytoplankton transfers a part of the organic matter produced by the photosynthesis into the zooplankton biomass. During the ingestion of this organic matter, a fraction is immediately released in water (as faecal pellets) and forms the detritus fraction (det). The remain-ing fraction supports zooplankton growth. The metabolism of zooplankton and phytoplankton produces waste that is excreted in the form of dissolved organic matter (DOM). The zooplankton and phytoplankton mortality returns or-ganic matter to the water column and forms the detritus frac-tion that will sink to the deep ocean. To summarise, the de-tritus originates from dead phytoplankton, dead zooplankton and faecal pellets from the zooplankton grazing on phyto-plankton. At this step the model calculates the opal and the calcium carbonate production as the two fractions of the non-living part of the detritus, the shells.
It is assumed that phytoplankton consists of diatoms, coc-colithophorids, and flagellates. As diatoms are known to be the fastest competitors (Egge and Aksnes, 1992), opal pro-duction by diatoms is computed first in the time loop if silica is available.
Opal production is computed from the detritus production as:
Prodopal=min 1det 1t RSi:P
DSi
KPhyDSi+DSi,0.5 DSi
!
(3)
and is limited to half of the available dissolved silica (0.5 DSi).
Where:
RSi:P: stoichiometric coefficient to relate P and Si according to the Redfield ratio,
1det
1t : detritus production by plankton,
DSi: dissolved silica concentration.
The 0.5 DSi limitation slows down the DSi uptake and depletion in the euphotic layer to better compare with ob-servations. This model set up was used by Six and Maier-Reimer (1996), Wetzel (2004) and Wetzel et al. (2005).
The calcium carbonate fraction is computed from the de-tritus production after as shown in Eq. (3).
ProdCaCO3=RCa:P 1det
1t
KPhyDSi
KPhyDSi+DSi (4) RCa:P: required CaCO3:P ratio by phytoplankton
The calcium carbonate production is regulated by the DSi availability, and follows the reverse path of opal production in Eq. (2). For that reason it is computed using same constant as for opal production corrected by the Redfield ratio. In presence of abundant DSi, the model produces opal, lower DSi concentrations benefit to calcium carbonate production. Opal concentration results from the equilibrium between opal production and its remineralisation. Symmetrically, DSi concentration results from the equilibrium between DSi up-take by the opal production and DSi release by opal reminer-alisation. The dissolution of opal depends on temperature and rate constant,λopal;DSi.
1opal
1t = +Prodopal−λopal:DSi·0,1·(T+3)·Opal (5) 1DSi
1t = −Prodopal+λopal:DSi·0,1·(T+3)·Opal (6) WithT: temperature (◦C).
The flux of particles through the water column redis-tributes phosphorous, silica and associated tracers along the sinking part, enriching the deep waters in nutrients. Par-ticles have constant sinking speeds, wDET, wCaCO3, wOpal andwDust for organic detritus, CaCO3, opal and clay, re-spectively. The export production is computed as the mate-rial leaving the euphotic layer, i.e. 90 m depth of the surface ocean, separately for opal and CaCO3. Remineralisation of opal and CaCO3occurs all along the sinking of particles af-ter they left the euphotic layer. Fluxes from the bottom layer in each grid cell provide the boundary condition for the sed-iment module that includes 4 sedsed-iment weight fractions and 12 layers following Heinze et al. (1999). The sediment mod-ule computes the accumulation of the deposited material on the sea floor as well as processes of remineralization in the sediments and the release of redissolved tracers to the lowest level of the water column.
The model is forced with NCEP based climatology (Na-tional Centre for Environmental Prediction). Dust deposition was generated by the National Centre for Atmospheric Re-search’s Community Climate System Model for the current
climate, they have been shown to be consistent with present day satellite and deposition data (Mahowald et al., 2006).
2.2 Initial conditions and model spin-up
The model was run for a 2400 yr spin-up from a homoge-neous distribution of the 18 tracers in the water column af-ter 600 yr of spin-up of the global circulation model. Af-ter 2400 yr the simulated distribution of tracers is consistent with observed surface map concentrations and cross sections of the Pacific, Atlantic and Indian Oceans. The coupling of the riverine fluxes of nutrients to the HAMOCC5 model is then integrated on a 100 yr time period (900 CPU hours per run). The MPI mode of the model currently runs on a dis-tributed shared-memory system, each simulated year takes 35 min running on 16 processors for a total of 9 CPU hours per simulated year.
2.3 River nutrient databases
We use current state-of-the-art datasets for riverine nutri-ent exports in differnutri-ent forms (Table 1), as established for the reference year 1995 (for C, N, P except DIC) by the Global-NEWS project (Seitzinger et al., 2005); we used the merged and slightly adapted dataset as made available to us by the group in January 2008, and for pre-industrial conditions for silica as established by D¨urr et al. (2009). Results from Beusen et al. (2009) were not yet available at the time the model runs were performed. Essentially their results are similar to the ones used here as the D¨urr et al. (2009) data was used in their study. For DIC, we used the alkalinity flux data as calculated by Amiotte-Suchet et al. (2003). Global-NEWS established the datasets at a 0.5 degree resolution for the ∼6200 river basins available from the STN-30 (Simulated Topological Network at 30 min, i.e. 0.5◦, resolution) dataset of V¨or¨osmarty et al. (2000a, b). They have been aggregated here to the resolution of∼140 mega-river-catchments (COSCATs) corresponding to homo-geneous coastal segments with fixed segment boundaries as established by Meybeck et al. (2006). These segments have a median length of∼2000 km and were specifically designed for standardized spatial analysis and reporting of material fluxes – water, dissolved and particulate material such as nu-trients and carbon species – from the exorheic (i.e. ing to the oceans, as opposed to the endorheic parts drain-ing to internal end points) parts of the continents (see also D¨urr et al., 2009 and a complete discussion in Meybeck et al., 2006). The silica flux dataset is directly available at the COSCAT resolution. The DIC data has also been directly calculated summing up the 1 degree original data set to the COSCAT resolution. Injection points are calculated as the central coastal point for each COSCAT, and adapted to the ocean model resolution (see Fig. 1).
Table 1. Data sources for nutrient forms used here as riverine inputs.
Nutrient form Acronym Method Data format used Reference
Dissolved DSi Extrapolation from river Data directly D¨urr et al. (2009) silica catchments to COSCATs available at the
using characteristics like COSCAT resolution lithology, climate, lake
occurrence
Dissolved DIN Spatially explicit Data originally Dumont et al. (2005) inorganic regression models developed for the
nitrogen linking basin STN-30 v.6 river
Dissolved DIP characteristics at 0.5 basins, merged data Harrison et al. (2005b) inorganic degree resolution plus set used here and
phosphorus human influence to aggregated to the
Dissolved DON, nutrient export COSCAT resolution Harrison et al. (2005a) organic DOP, of∼140 mega
river-nutrient forms DOC ensemble catchments
Dissolved DIC Data originally Fluxes are used as Amiotte-Suchet et al. (2003) inorganic calculated at 1 degree aggregated at the
carbon resolution, regression COSCAT resolution model using
methodology derived from monolithologic watersheds
Particulate PP, Spatially explicit Data originally Beusen et al. (2005) nutrient PN, regression model for developed for the
forms PC suspended sediments STN-30 v.5 river (same model strategy as basins, merged for DIN, DIP and data set used here organic matter), the (adapted for STN-30 v.6) nutrient partitioning is and aggregated to the derived from known COSCAT resolution relationships resulting in of∼140 mega river-fractions of suspended ensemble catchments matter flux
2.4 Coupling
The coastal segments (COSCATs) are defined as the coast-line between two geographical locations. The riverine fluxes of nutrients are released in the near-shore model grid cells located in between both ends of a given segment. Due to the low resolution of the model grid, some of the 156 orig-inal segments were merged, resulting in 129 segments used here. Coupled fluxes of nutrients are computed at each time step (10 times a day). The flux is released homogeneously all along the coast line in the corresponding grid cells in the upper layer (first 12 m). The fluxes are assumed to be con-stant over time; the river discharge does not yet take into ac-count the seasonal cycle or interannual variability. However, such information progressively becomes available and will be incorporated in later versions of the model. The
fresh-water riverine input are provided by the default MPI-OM set up. This was done in order to avoid an expensive new model spin-up.
The model code relies on the Redfield Ratio, i.e. nutrient uptake occurs according to a 122:16:1 C:N:P ratio. The same applies to the remineralisation process.
The data of riverine nutrient fluxes included dissolved or-ganic nitrogen, phosphorous and carbon (DON, DOP and DOC) that had to be merged into POC and DOM.
The dissolved organic matter (DOM) was regarded as the least available organic element (either phosphate or carbon): DOM=min
DOP,DON 16 ,
DOC 122
26
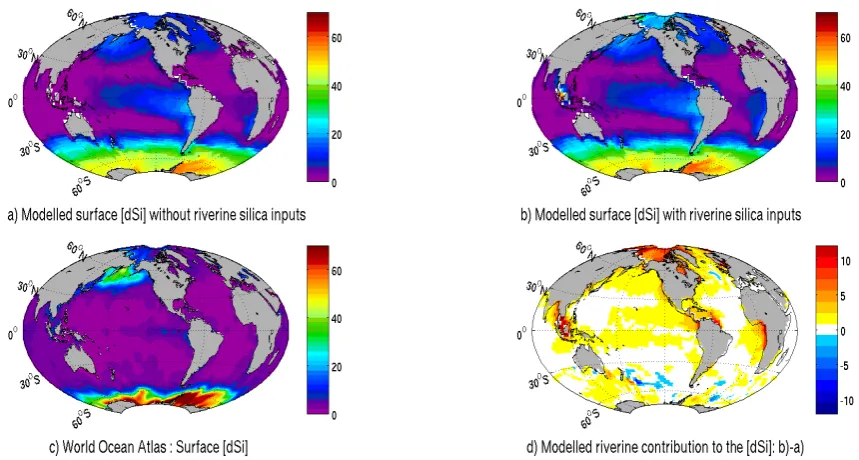
Figure 2. River contribution to the surface silicic acid concentration. Sea surface
concentration given in µmol l
-1: a) modelled DSi without riverine silica inputs b) modelled
DSi with riverine silica inputs c) surface DSi concentration from the World Ocean Atlas d)
[image:6.595.82.512.60.290.2]the computed difference with/without riverine silica inputs (b-a).
Fig. 2. River contribution to the surface silicic acid concentration. Sea surface concentration given in µmol l−1: (a) modelled DSi without riverine silica inputs (b) modelled DSi with riverine silica inputs (c) surface DSi concentration from the World Ocean Atlas (d) the computed difference with/without riverine silica inputs (b–a).
example in the case P is the least available nutrient (either phosphate or nitrate, see Eqs. 7 and 8).
FDIN=DIN+(DON−16·DOP) (8) While,
FDIC=DIC+(DOC−122·DOP) (9) The same approach was applied to particulate matter.
3 Results
Mapping the silicic acid concentration of the ocean surface shows four major hotspots (Fig. 2d) when comparing the run with riverine silicon loads (Fig. 2b) to the run with-out (Fig. 2a): the Arctic Ocean, the eastern Gulf of Guinea (coast of Cameroon, Gabon, Congo and Angola), the Ama-zon plume and South Eastern Asia (Fig. 2d). The total flux of 6.2 teramoles of silicon per year (or 371 Mt SiO2per year) is in agreement with earlier estimates of 6.1±2.0 teramoles of silicon per year (Tr´eguer et al., 1995).
In the Arctic Ocean, the largest effect of the riverine silica occurs along the Siberian coast where rivers that drain the Siberian plateau annually release 0.25 teramoles Si (15 Mt SiO2), this results in a 15 µmol l−1 increase of the dissolved silica concentration (Fig. 2d). In the Eastern Gulf of Guinea, the largest river in Western Central Africa, the Congo River (21 Mt SiO2yr−1or 0.35 teramoles Si yr−1) contributes to a 5 to 10 µmol l−1increase of the silicic acid concentration all along the 1000 km coastline from its mouth
to the coast of Cameroon, extending the silica supply from the Benguela upwelling system. Across the Atlantic Ocean, at the same latitude, the Amazon releases 0.94 teramoles Si per year, more than 15% of the global land-ocean flux of silica, 1.1 teramoles Si per year, together with the Orinoco River (0.16 teramoles Si per year). Combined, the Orinoco and Amazon load is the strongest input of silica to the open ocean and can be traced all along its plume drifting North West sustaining a 10 µmol l−1 excess concentration into the Caribbean. The plume of the Amazon drifts North-West along the north coast of South America and mixes in the Gulf of Mexico with the waters from the Mississippi. The time se-ries in Fig. 3 show the annual cycle of nutrients, photosynthe-sis, opal and calcium carbonate production on an integrated ocean surface of 1.74×10⁶km2 adjacent to the Amazon mouth. Despite the distance from the coast, the comparison of the two runs with/without riverine nutrients clearly shows a large increase of photosynthesis maximum when riverine nutrients are added (0.05 and 0.025 mmol P l−1d−1), accom-panied by a more significant increase of opal production than calcium carbonate production. The run with all nutrients ex-cept DSi shows a large increase of the calcium carbonate pro-duction while the opal propro-duction is unchanged due to DSi limitation. The calcium carbonate production benefits from the low dissolved silica concentration through the silica lim-itation of opal production. The other river plume hot spots show similar behaviour.
The major hotspot of dissolved silica release to the ocean is located in South Eastern Asia (Fig. 2b and d). The Ganges River and its neighbouring smaller rivers support
Fig. 3. The seasonal cycle of nutrient limitation (element equivalent
phosphorous) in the Amazon plume region (1.74×10⁶km2, corre-sponding to 23 grid cells (275×275 km), located between longitude 64◦and 48◦west, latitude 14.5◦north and the coastline). Opal and calcium carbonate export (F opal and F calcarb) at 10m depth in response to photosynthesis (upper panels) with all riverine nutrients (left) and without any riverine nutrients (middle) or with riverine nutrients without DSi (right). Nutrient limitation (lower panels) is expressed as the concentration adjusted to the necessary stoichio-metric concentration of nitrogen and iron relative to phosphate. The limitation of photosynthesis is driven by the lowest concentration equivalent phosphate (iron, nitrate or phosphate). Opal and calcium carbonate competition is driven by the silica concentration.
an annual input of 0.4 teramoles Si (or 23.32 Mt SiO2) to the Bay of Bengal. Not as strong, but on a larger spatial scale, the coastline of the Indonesian archipelago receives the equivalent of the Amazon’s load; with the Mekong River (21 Mt SiO2 or 0.35 teramoles Si per year), Indonesia and Malaysia (21.4 Mt SiO2or 0.36 teramoles Si per year). The dissolved silica concentration rises by about 20 µmol l−1Si in the Java Sea, between Indonesia, Sumatra and Java, but these numbers should be considered with caution as this sea basin does not account for more than a few model cells. The weak simulated advection of tracers could artificially increase the accumulation process locally.
The open ocean also benefits from the riverine input of sil-ica. Figure 2d shows an increased silicic acid concentration of a few µmol l−1 on large surfaces of the Equatorial East Pacific Ocean and in the North Pacific Ocean. The Congo River raises the eastern South Atlantic surface silicic acid concentration by 2 µmol l−1, which is significant for such a low Si-concentration area.
The silica concentration shows local accumulation pro-cesses but opal production better describes the utilisation of the silica provided by the continents. Delivery of silica by rivers increases the concentration, while phytoplankton uti-lization decreases the concentration. Where these two pro-cesses are not in balance there is either accumulation or de-pletion of the dissolved silica. As shown on Fig. 4, there is little photosynthesis in the Arctic Ocean because of sea ice. The photosynthesis is not responding to changes in riverine inputs of silica for the simple reason that if diatom growth is limited by silica availability it is replaced by calcium car-bonate production which leaves the annual primary produc-tion unchanged. In the model code, the photosynthesis only depends on light availability, phytoplankton and the limiting nutrient (phosphate, nitrate or iron). It is therefore interest-ing to note that hotspots of riverine silica inputs (Fig. 2d) are mainly located in highly productive areas (Fig. 4) for two different reasons: (i) the nutrient availability supplied by the river itself (Amazon plume, Fig. 3) and (ii) in some cases the vicinity of coastal upwelling (Southwest coast of Africa). In this case the riverine silica mixes with the silica-enriched wa-ters of the upwelling, and both contributions work in synergy to maintain a high level of silica concentration. The situation is slightly different in the Indonesian archipelago. Despite a large riverine input of N and P, the iron limitation driving the photosynthesis of most of the Pacific Ocean (Behrenfeld et al., 1996) maintains photosynthesis below a few moles of P m−2yr−1.
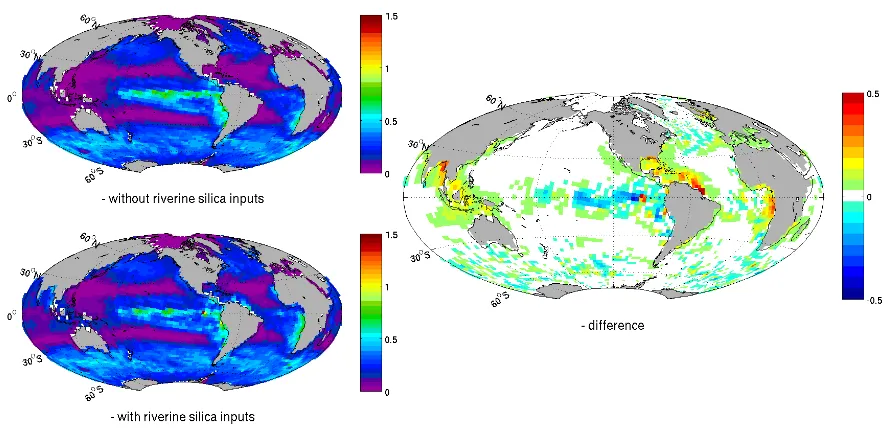
The opal export production is the flux of opal that exits the euphotic layer (set to 90 m depth in the model code). Two main areas of the global oceans show a significant increase of the vertical export of silica via opal export: the Amazon plume including the Caribbean Sea and the Gulf of Mexico and South-eastern Asia. The strongest increase of opal export production is due to the Amazon and Orinoco rivers. These two rivers alone contribute to maintain an annual opal ex-port of up to a 0.8 mol Si m−2along the north coast of South America (Fig. 5). This large input of silica (1.1 teramoles Si per year) enhances diatom growth and opal export as far as the Caribbean Sea, and mixes its signal with the input of the Mississippi River in the Gulf of Mexico. The second area where riverine silica significantly increases opal export cov-ers a large part of the East Indian Ocean between Australia and South-eastern Asia. The annual opal export production is enhanced by 0.2 mol Si m−2all around Indonesia. The river-ine contribution reaches its maximum along the coast of In-dia and Burma where the annual opal export production lo-cally increases by 0.5 mol Si m−2.
4 Discussion
Fig. 4. Left, annually integrated photosynthesis in the euphotic ocean layer, the photosynthesis is expressed in mmol P m−2yr−1. Right, limiting nutrient driving the photosynthesis in the surface layer.
Fig. 5. Rivers contribution to the Opal export production in mol Si m−2yr−1– without silica riverine inputs (top-left) – with silica riverine inputs (bottom-left) and the computed difference with/without riverine silica inputs (right).
the sediment (in a steady state ocean, Tr´eguer et al., 1995). Unfortunately, the computing cost of simulation does not al-low a complete spin up of the sediment compartment. This was discussed in Bernard et al. (2010) as one of the weak-nesses of high resolution GCM simulations in comparison with box models studies. The burial is therefore not further discussed in this paper.
Atmospheric silica inputs such as dust deposition and dis-solved silicic acid in rain are not considered here. We assume that deposited aeolian silica would be deposited as sand par-ticles whose sinking speed would not allow any major dis-solution resulting in a significant input of silicic acid (John-son et al., 2006). Previous studies range aeolian DSi input from 0.20 to 0.18 Tmol yr−1(Da Cunha et al., 2007; Moore et al., 2002). This is one order of magnitude lower than the riverine silica input. These numbers are based on a dissolu-tion rate of 7.5% of the silica contained in the dust particles (Moore et al., 2001) and are in agreement with a theoretical 5–10% range (Harrison, 2000; Tr´eguer et al., 1995). This is
still much higher than the 0.02–1.1% suggested by a study from Baker et al. (2006) on the dissolution of Saharan dust particles. In addition the large dissemination of dust parti-cles over the world ocean (mainly Atlantic) is more likely to have little impact on the marine silica cycle compared to the distribution of riverine inputs along the world coastline.
Riverine input of silicic acid occurs at the same time as the other limiting nutrients supporting a vigorous primary production (Figs. 2 and 4), except on the Pacific side of South-East Asia which is limited by iron. The conditions are then favourable to a local use of the available silicic acid that explains the relative low export of the silica from these marginal seas. Consequently, a large part of the opal is buried on the continental margins (Tr´eguer et al., 1995). The situ-ation is different for the Arctic region that receives a large flux of DSi in relation to the shallowness of the basin and its volume (D¨urr et al., 2009) and where sea ice does not al-low plankton growth (Fig. 4). This combined factors lead to higher concentrations of DSi in the Arctic basin.
[image:8.595.75.520.215.429.2]Table 2. Model runs, riverine nutrients inputs (Tmol Si yr−1).
DIN, DON, PN DIP, DOP, PP DOC, POC, DIC DSi
Run ref, no rivers “Run NoRiv”
Run N, P, C “Run NPC” X X X
Run N, P, C and Si “Run NPCSi” X X X X
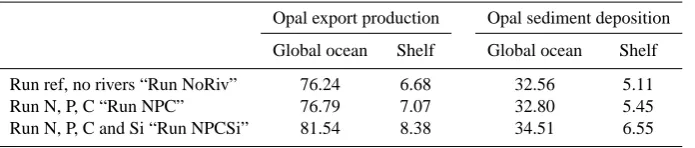
Table 3. Model runs and opal production budgeting (Tmol Si yr−1).
Opal export production Opal sediment deposition
Global ocean Shelf Global ocean Shelf
Run ref, no rivers “Run NoRiv” 76.24 6.68 32.56 5.11 Run N, P, C “Run NPC” 76.79 7.07 32.80 5.45 Run N, P, C and Si “Run NPCSi” 81.54 8.38 34.51 6.55
The maps of the surface DSi (Fig. 2) and opal export pro-duction (Fig. 5) point out the strong spatial heterogeneity of the riverine silica contribution to the oceanic biogeochemical cycle of silica. This is not surprising given the enormous het-erogeneity in the spatial distribution of riverine silica inputs (D¨urr et al., 2009).
The effect of riverine inputs of silica is often amplified by the absence of alternative supply of DSi; these areas en-counter no major input from upwelling (Amazon, South-eastern Asia, Arctic rivers as shown on Fig. 2). The silica delivery in these areas is dominated by direct riverine flux and delayed flux due to recycling in the sediments of the opal produced and initially supported by the riverine inputs. It is also interesting to note the general climate impact on the regionalization of total input of silica to the euphotic layer. Both riverine and upwelling supply depend on climate. The precipitation on the continents drives the weathering of rocks and the transport of silica to the ocean while winds drive the upwelling processes along the shore. Any changes in the atmospheric circulation could thus spatially redistribute the riverine silica inputs to the sea surface of the ocean.
The effect on the surface silica concentration depends on the location of the river mouth. The effect of the silica in-puts from the Amazon appears to be small when compared to the Siberian Rivers. The Siberian COSCATs combined con-tribute to raise the surface silica concentration by 15 µmol l−1 with an annual input of 0.26 teramoles of Si. There is a weak primary production in the Arctic Ocean due to an overesti-mation by the model of the sea ice coverage. In summer, the Siberian coast is a large ice free zone of the Arctic; this allows utilisation of Siberian river inputs of DSi. Of course the sea ice cover benefits to the DSi concentration rise but the geography of the Arctic basin and its ventilation also benefits to the comparatively high DSi concentration. The
model results should however be considered carefully given the coarse quality of the sea ice cover representation in the model and the sensitivity of nutrients utilisation to sea ice cover. As shown in recent studies, sea ice retreat caused by climate change is expected to increase primary production by ∼20% in the Beaufort Sea, affecting surface water nutrient concentration (Arrigo et al., 2008; Lavoie et al., 2010).
[image:9.595.126.474.202.276.2]to a few hundreds of kilometres from the coast, supporting opal production far outside the continental shelf. DeMas-ter and Aller (2001) estimated that nearly all of the riverine silicate inputs was transported offshore as either silicate or as biogenic silica which also matches the far reaching bio-geochemical impact of the Amazon plume on the observed oceanic uptake of atmospheric CO2(K¨ortzinger, 2010). The silica taken up by diatoms to build up their siliceous shells is directly exported to the deep ocean after diatoms die. In the case of the Arctic Ocean, the sea ice prevents plankton growth and silica uptake, which causes an accumulation.
The complex pattern of iron during its transfer to the ocean does not allow a direct flux from the rivers (Wells and Mayer, 1991; Poulton and Raiswell, 2002). Iron aggregates and set-tles in the estuary when freshwater and sea waters mixes (Poulton and Raiswell, 2002). A large part remains trapped in the estuary. However recent studies show that most of the riverine iron inputs from the north-western US is not trapped in the estuary and supports coastal waters primary produc-tivity (Chase et al., 2007). The transfer riverine iron might also be affected by the regional climates. Indeed, monsoonal climate would logically benefit to a fast transfer of iron to the coastal seas rather than to favour estuarine retention. The input of iron is assumed to be mainly supported by dust de-position and remineralisation in the sediment pore waters of the coastal sediments before advection to the surface (John-son et al., 1999). Given the lack of knowledge of iron trans-fer patterns at the land/ocean interface, riverine iron input is not considered in this study. It is assumed that on the continental margins iron originates from the remineralisa-tion taking place in the sediments. It is also well established that the active recycling of iron on the continental margins prevents iron limitation on the continental margins except in coastal upwelling regimes (Hutchins and Bruland, 1998). The dissolved iron availability interacts with the utilisation of riverine silica through its potential control of photosynthe-sis. Currently, the model generates an iron limitation in the coastal zone due to the high use and export of the original iron caused by the high supply of nutrients. The model fails to reproduce the iron recycling from the shelf sediments. The primary source of iron in the continental shelf seas is resus-pension of particles and redissolution of deposited iron in the benthic boundary layer, followed by upwelling of this iron-rich water, rather than direct riverine input (Johnson et al., 1999). The generated artificial iron limitation masks part of the potential of the continental margins primary production potential. It probably artificially decreases the opal produc-tion of the marginal seas.
To use riverine iron concentration from the literature would rather generate an iron fertilization experiment than give a better picture of the marginal seas productivity. A re-alistic approach would consist in getting a better simulation of the iron return from the coastal sediments to the surface on continental margins as suggested by Wells and Trick (2004) by extending redissolution to iron in the sediments and by
en-hancing resuspension by increasing the vertical mixing coef-ficient in the coastal cells as described in Giraud et al. (2008). This might be the reason why the model fails to reproduce the high production belt along the continents even when riverine nutrient input is taken into account.
To better simulate the land-ocean interface it is necessary to enhance the implementation of coastal processes, taking into consideration regional patterns of the estuarine and near-shore retention of riverine nutrients. The idea is to over-come the coarse resolution of the BGCM by using a box model that will prescribe the riverine flux for each coastal segment of the COSCATs database, with a specific parame-terisation for each segment. The next step would also include the riverine bSiO2 inputs. Conley et al. (1997, 2002) and Laruelle et al. (2009) suggest that the terrestrial opal produc-tion transferred to the ocean via the river systems releases a significant input of bSiO2. The bSiO2 encounters mas-sive dissolution under the pH and salinity shift in estuaries (Loucaides et al., 2008; Roubeix et al., 2008). This input (1.05±0.2 Tmol Si yr−1, Conley, 1997) is believed to be of the same order of magnitude as the estuarine dissolved silica retention (roughly 20%, Laruelle et al., 2009).
Riverine silica input shows high sensitivity to land use and human activity in general (Conley et al., 1993; Humborg et al., 2000). River damming and artificial reservoirs trap part of the riverine silica and as DSi ultimately originates from natural weathering of rocks (Meybeck, 1998), mea-surements have shown a decrease of the riverine DSi during the last decades (Humborg et al., 2000; Justic et al., 1995b; McGinnis et al., 2006). DSi export since preindustrial times has probably decreased by 10–20% (respectively D¨urr et al., 2009; and Beusen et al., 2009). In parallel, human activity had the opposite effect on N and P: agriculture, industry or urban sewage increased N and P emissions. The combined result is a general decrease of the riverine Si:N and Si:P ratio (Justic et al., 1995a, b). Ongoing projects of damming major rivers such as the Three-Gorges Dam have already shown changing nutrient concentrations and ratios in the coastal zone and the East China Sea (filling phase started in June 2003). Investigations carried out by Gong et al. (2006) have shown that the Si:N ratio in the river-affected region changed from 1.5 in 1998 to 0.4 in 2004. In addition, the increased in-put of N and P stimulates the primary production fuelling the silica pump. Sediment beneath the Mississippi River plume showed an increased accumulation of biogenic silica over the past two decades (Rabalais et al., 1996), despite a decrease of the Mississippi supply in silica. It is therefore interest-ing to note that South Eastern Asia, which receives one of the most significant inputs of riverine silica, is the region of the world that encounters the strongest population growth, urbanization and development. It is therefore probable to ex-pect a large change in the land-ocean nutrient flux potentially resulting in shifts in the plankton populations.
The coupling of the model to the database of riverine nutrients achieved here will allow running scenarios with
changes in the nutrient river fluxes, once they become avail-able. Global-NEWS models are currently under develop-ment, using the Millennium Ecosystem Assessment Scenar-ios (Carpenter et al., 2005). All over the world, all nutrients are expected to be impacted; a model based study suggest a 30% increase in riverine DIN export between 1970 and 2000 (Seitzinger et al., 2010), the same study for the period 2000– 2030 predicts changes varying from an 18% increase to a general decrease for scenarios focusing on ecosystem man-agement and water quality policy on a global scale.
The recent development of the river biogeochemical states is different depending on the regional level of economical development. In a few developed countries, reduction of eu-trophication (wastewater treatment, denitrified and diphos-phorilated) and sustainable land use changes may stabilise the riverine load of N and P. In some rare cases the load of N and P tends to decrease. For example, in Poland, econom-ical changes in the early 1990s, led to a drastic decrease in fertilizer consumption (Eriksson et al., 2007). Water quality management policies and rehabilitation of aquatic habitats forced to a limitation of the release of nutrients in the rivers to limit eutrophication impacts on the environment. Never-theless, this local improvement might still be small compared to the forecasted global increase of nutrient river loads in the rest of the world and its resulting expected decrease of the Si:N and Si:P ratios.
5 Conclusions
Regionalisation of silica inputs highlights the heterogeneity of land water contributions to the marine cycle of silicon. The fate of the riverine silica input is largely dependant on the input location and local level of productivity. Hot spots of riverine DSi inputs are mainly located in areas where there is little support of the marine ecosystem through upwelling. It makes these areas dependant on the riverine fluxes and sen-sitive to the human activity that affects the riverine transport of nutrients. The uniform distribution of riverine silica at the surface of the ocean commonly used in global models to bal-ance opal burial in the sediments can no longer be used if one plans to properly describe the biogeochemical cycle of silica, especially for models taking into consideration the competi-tion between calcifiers and diatoms. Here we take the first steps to a full integration of nutrient cycling, including the continental shelf seas and land/ocean coupling, in an Earth System modelling context.
Acknowledgements. The work on this project was made possible by financial support from the Bjerknes Centre for Climate Research – University of Bergen, the EU (Si-WEBS, contract number HPRN-CT-2002-000218) and Utrecht University (High Potential project G-NUX). Sybil Seitzinger and Emilio Mayorga (Institute of Marine & Coastal Sciences, Rutgers University, USA) are acknowledged for the communication of the merged Global-NEWS data sets. Discussions and suggestions from K. Assmann were
greatly appreciated. Computations where carried out under project nn2980k at the Norwegian Metacenter for Computational Science NOTUR. This is publication no. A320 from the Bjerknes Centre for Climate Research.
Edited by: J. Middelburg
References
Amiotte-Suchet, P. A., Probst, J. L., and Ludwig, W.: Worldwide distribution of continental rock lithology: Implications for the atmospheric/soil CO2uptake by continental weathering and al-kalinity river transport to the oceans, Global Biogeochem. Cy., 1(2), 1038–1051, 2003.
Arrigo, K. R., van Dijken, G., and Pabi, S.: Impact of a shrinking Arctic ice cover on marine primary production, Geophys. Res. Lett., 35, L19603, doi:10.1029/2008gl035028, 2008.
Aumont, O., Maier-Reimer, E., Blain, S., and Monfray, P.: An ecosystem model of the global ocean including Fe, Si, P colimitations, Global Biogeochem. Cy., 17, 1060, doi:10.1029/2001GB001745, 2003.
Baker, A. R., French, M., and Linge, K. L.: Trends in aerosol nutrient solubility along a west-east transect of the Saharan dust plume, Geophys. Res. Lett., 33, L07805, doi:10.1029/2005gl024764, 2006.
Behrenfeld, M. J., Bale, A. J., Kolber, Z. S., Aiken, J., and Falkowski, P. G.: Confirmation of iron limitation of phytoplank-ton photosynthesis in the equatorial Pacific Ocean, Nature, 383, 508–511, 1996.
Bernard, C. Y., Laruelle, G. G., Slomp, C. P., and Heinze, C.: Im-pact of changes in river fluxes of silica on the global marine sil-icon cycle: a model comparison, Biogeosciences, 7, 441–453, doi:10.5194/bg-7-441-2010, 2010.
Beusen, A. H. W., Dekkers, A. L. M., Bouwman, A. F., Ludwig, W., and Harrison, J.: Estimation of global river transport of sediments and associated particulate C, N, and P, Global Bio-geochem. Cy., 19, GB4S05, doi:10.1029/2005GB002453, 2005. Beusen, A. H. W., Bouwman, A. F., Durr, H. H., Dekkers, A. L. M., and Hartmann, J.: Global patterns of dissolved sil-ica export to the coastal zone: Results from a spatially ex-plicit global model, Global Biogeochem. Cy., 23, GB0A02, doi:10.1029/2008gb003281, 2009.
Bidle, K. D. and Azam, F.: Accelerated dissolution of diatom silica by marine bacterial assemblages, Nature, 397, 508–512, 1999. Carpenter, S. R., Pingali, P. L., Bennett, E. M., and Zurek, M.
B.: Millennium Ecosystem Assessment (MA), Ecosystems and Human Well-Being: Scenarios, Island Press, Washington, DC, USA, 2005.
Chase, Z., Strutton, P. G., and Hales, B.: Iron links river runoff and shelf width to phytoplankton biomass along the U.S. West Coast, Geophys. Res. Lett., 34, L04607, doi:10.1029/2007gl029924, 2007.
Conley, D. J.: Riverine contribution of biogenic silica to the oceanic silica budget, Limnol. Oceanogr., 42, 774–777, 1997.
Conley, D. J.: Terrestrial ecosystems and the global biogeo-chemical silica cycle, Global Biogeochem. Cy., 16(8), 1121, doi:10.1029/2002gb001894, 2002.
Ecol.-Prog. Ser., 101, 179–192, 1993.
Da Cunha, L. C., Buitenhuis, E. T., Le Quere, C., Giraud, X., and Ludwig, W.: Potential impact of changes in river nutrient supply on global ocean biogeochemistry, Global Biogeochem. Cy., 21, GB4007, doi:10.1029/2006GB002718, 2007.
DeMaster, D. J. and Aller, R. C.: Biogeochemical processes on the Amazon shelf: changes in dissolved and particulate fluxes dur-ing river/ocean mixdur-ing, in: The Biogeochemistry of the Amazon Basin, edited by: McClain, M. E., Victoria, R. L., and Richey, J. E., Oxford University Press, New York, 328–357, 2001. Ducklow, H. W. and McCallister, S. L.: The biogeochemistry of
carbon dioxide in the coastal oceans, Chapter 9, in: The Sea, edited by: Robinson, A. R. B. K., Harvard Univ. Press, Cam-bridge, 269–315, 2005.
Dugdale, R. C., Wilkerson, F. P., and Minas, H. J.: The Role of a Silicate Pump in Driving New Production, Deep-Sea Res. Pt. I, 42, 697–719, 1995.
Dumont, E., Harrison, J. A., Kroeze, C., Bakker, E. J., and Seitzinger, S. P.: Global distribution and sources of dissolved inorganic nitrogen export to the coastal zone: Results from a spatially explicit, global model, Global Biogeochem. Cy., 19, GB4S02, doi:10.1029/2005GB002488, 2005.
D¨urr, H. H., Meybeck, M., Hartmann, J., Laruelle, G. G., and Roubeix, V.: Global spatial distribution of natural riverine sil-ica inputs to the coastal zone, Biogeosciences Discuss., 6, 1345– 1401, doi:10.5194/bgd-6-1345-2009, 2009.
Egge, J. K. and Aksnes, D. L.: Silicate as Regulating Nutrient in Phytoplankton Competition, Mar. Ecol.-Prog. Ser., 83, 281–289, 1992.
Eriksson, H., Pastuszak, M., Lofgren, S., Morth, C. M., and Hum-borg, C.: Nitrogen budgets of the Polish agriculture 1960–2000: implications for riverine nitrogen loads to the Baltic Sea from transitional countries, Biogeochemistry, 85, 153–168, 2007. Fennel, K., Hetland, R., Feng, Y., and DiMarco, S.: A coupled
physical-biological model of the Northern Gulf of Mexico shelf: model description, validation and analysis of phytoplankton vari-ability, Biogeosciences Discuss., 8, 121–156, doi:10.5194/bgd-8-121-2011, 2011.
Giraud, X., Le Quere, C., and da Cunha, L. C.: Importance of coastal nutrient supply for global ocean biogeochemistry, Global Biogeochem. Cy., 22, Gb2025, doi:10.1029/2006gb002717, 2008.
Gong, G. C., Chang, J., Chiang, K. P., Hsiung, T. M., Hung, C. C., Duan, S. W., and Codispoti, L. A.: Reduction of primary produc-tion and changing of nutrient ratio in the East China Sea: Effect of the Three Gorges Dam?, Geophys. Res. Lett., 33, L07610, doi:10.1029/2006GL025800, 2006.
Graham, W. M.: Numerical increases and distributional shifts of Chrysaora quinquecirrha (Desor) and Aurelia aurita (Linne) (Cnidaria : Scyphozoa) in the northern Gulf of Mexico, Hydro-biologia, 451, 97–111, 2001.
Harrison, J. A., Caraco, N., and Seitzinger, S. P.: Global patterns and sources of dissolved organic matter export to the coastal zone: Results from a spatially explicit, global model, Global Biogeochem. Cy., 19, GB4S04, doi:10.1029/2005GB002480, 2005a.
Harrison, J. A., Seitzinger, S. P., Bouwman, A. F., Caraco, N. F., Beusen, A. H. W., and Vorosmarty, C. J.: Dissolved inorganic phosphorus export to the coastal zone: Results from a spatially
explicit, global model, Global Biogeochem. Cy., 19, GB4S03, doi:10.1029/2004GB002357, 2005b.
Harrison, K. G.: Role of increased marine silica input on paleo-pCO(2) levels, Paleoceanography, 15, 292–298, 2000.
Heinze, C., Maier-Reimer, E., Winguth, A. M. E., and Archer, D.: A global oceanic sediment model for long-term climate studies, Global Biogeochem. Cy., 13, 221–250, 1999.
Humborg, C., Conley, D. J., Rahm, L., Wulff, F., Cociasu, A., and Ittekkot, V.: Silicon retention in river basins: Far-reaching effects on biogeochemistry and aquatic food webs in coastal marine en-vironments, Ambio, 29, 45–50, 2000.
Hutchins, D. A. and Bruland, K. W.: Iron-limited diatom growth and Si : N uptake ratios in a coastal upwelling regime, Nature, 393, 561–564, 1998.
Jahnke, R. A.: Global Synthesis, in: Carbon and Nutrient Fluxes in Continental Margins, edited by: Liu, K.-K., Atkinson, L., Qui˜nones, R., and Talaue-McManus, L., Global Change – The IGBP Series, Springer Berlin Heidelberg, Berlin, 597–615, 2010. Johnson, H. P., Hautala, S. L., Bjorklund, T. A., and Zarnetske, M. R.: Quantifying the North Pacific silica plume, Geochem. Geophy. Geosy., 7, Q05011, doi:10.1029/2005GC001065, 2006. Johnson, K. S., Chavez, F. P., and Friederich, G. E.: Continental-shelf sediment as a primary source of iron for coastal phytoplank-ton, Nature, 398, 697–700, 1999.
Justic, D., Rabalais, N. N., and Turner, R. E.: Stoichiometric nu-trient balance and origin of coastal eutrophication, Mar. Pollut. Bull., 30, 41–46, 1995a.
Justic, D., Rabalais, N. N., Turner, R. E., and Dortch, Q.: Changes in nutrient structure of river-dominated coastal waters: stoi-chiometric nutrient balance and its consequences, Estuar. Coast. Shelf S., 40, 339–356, 1995b.
K¨ortzinger, A.: The outer Amazon plume: An atmospheric CO2 sink, in: Carbon and Nutrient Fluxes in Continental Margins, edited by: Liu, K.-K., Atkinson, L., Qui˜nones, R., and Talaue-McManus, L., Global Change – The IGBP Series, Springer Berlin Heidelberg, Berlin, 450–453, 2010.
Kroeze, C. and Seitzinger, S. P.: Nitrogen inputs to rivers, estuaries and continental shelves and related nitrous oxide emissions in 1990 and 2050: a global model, Nutr. Cycl. Agroecosys., 52, 195–212, 1998.
Lancelot, C., Gypens, N., Billen, G., Garnier, J., and Roubeix, V.: Testing an integrated river-ocean mathemati-cal tool for linking marine eutrophication to land use: The Phaeocystis-dominated Belgian coastal zone (Southern North Sea) over the past 50 years, J. Marine Syst., 64, 216–228, doi:10.1016/j.jmarsys.2006.03.010, 2007.
Laruelle, G. G., Roubeix, V., Sferratore, A., Brodherr, B., Ciuffa, D., Conley, D. J., D¨urr, H. H., Garnier, J., Lancelot, C., Le Thi Phuong, Q., Meunier, J.-D., Meybeck, M., Michalopoulos, P., Moriceau, B., N´ı Longphuirt, S., Loucaides, S., Papush, L., Presti, M., Ragueneau, O., Regnier, P. A. G., Saccone, L., Slomp, C. P., Spiteri, C., and Van Cappellen, P.: Anthropogenic pertur-bations of the silicon cycle at the global scale: the 1 key role of the land-ocean transition, Global Biogeochem. Cy., 23, GB4031, doi:10.1029/2008GB003267, 2009.
Lavoie, D., Denman, K. L., and Macdonald, R. W.: Effects of fu-ture climate change on primary productivity and export fluxes in the Beaufort Sea, J. Geophys. Res.-Oceans, 115, C04018, doi:10.1029/2009jc005493, 2010.
Liu, K. K., Atkinson, L., Qui˜nones, R., and Talaue-McManus, L.: Biogeochemistry of Continental Margins in a Global Context, in: Carbon and Nutrient Fluxes in Continental Margins, edited by: Liu, K.-K., Atkinson, L., Qui˜nones, R., and Talaue-McManus, L., Global Change – The IGBP Series, Springer Berlin Heidel-berg, Berlin, 3–24, 2010.
Loucaides, S., Van Cappellen, P., and Behrends, T.: Dissolution of biogenic silica from land to ocean: Role of salinity and pH, Limnol. Oceanogr., 53, 1614–1621, 2008.
Mackenzie, F. T., Andersson, A. J., Lerman, A., and Ver, L. M.: Boundary exchanges in the global coastal margin: Implications for the organic and inorganic carbon cycles, in: The Sea, edited by: Robinson, A. R. and Brink, K. H., Harvard University Press, 1033 pp., 2005.
Mahowald, N. M., Muhs, D. R., Levis, S., Rasch, P. J., Yoshioka, M., Zender, C. S., and Luo, C.: Change in atmospheric mineral aerosols in response to climate: Last glacial period, preindustrial, modern, and doubled carbon dioxide climates, J. Geophys. Res.-Atmos., 111, D10202, doi:10.1029/2005JD006653, 2006. Maier-Reimer, E.: Geochemical cycles in an ocean general
cir-culation model. Preindustrial tracer distributions, Global Bio-geochem. Cy., 7, 645–677, 1993.
Maier-Reimer, E., Kriest, I., Segschneider, J., and Wetzel, P.: Technical description of the HAMburg Ocean Carbon Cycle model, version 5.1 (HAMOCC5.1), and of its interface to MPI-OM, available at: http://edoc.mpg.de/get.epl?fid=17575&did= 249293&ver=0, 2005.
Marsland, S. J., Haak, H., Jungclaus, J. H., Latif, M., and Roske, F.: The Max-Planck-Institute global ocean/sea ice model with orthogonal curvilinear coordinates, Ocean Model., 5, 91–127, 2003.
McGinnis, D. F., Bocaniov, S., Teodoru, C., Friedl, G., Lorke, A., and Wuest, A.: Silica retention in the Iron Gate I reservoir on the Danube River: The role of side bays as nutrient, River Res. Appl., 22, 441–456, 2006.
Meybeck, M., D¨urr, H. H., and V¨or¨osmarty, C. J.: Global coastal segmentation and its river catchment contributors: A new look at land-ocean linkage, Global Biogeochem. Cy., 20, GB1S90, doi:10.1029/2005GB002540, 2006.
Moore, J. K., Doney, S. C., Kleypas, J. A., Glover, D. M., and Fung, I. Y.: An intermediate complexity marine ecosystem model for the global domain, Deep-Sea Res. Pt. II, 49, 403–462, doi:10.1016/s0967-0645(01)00108-4, 2001.
Moore, J. K., Doney, S. C., Glover, D. M., and Fung, I. Y.: Iron cycling and nutrient-limitation patterns in surface waters of the World Ocean, Deep-Sea Res. Pt. II, 49, 463–507, 2002. Muller-Karger, F. E., Varela, R., Thunell, R., Luerssen, R., Hu,
C., and Walsh, J. J.: The importance of continental margins in the global carbon cycle, Geophys. Res. Lett., 32, L01602, doi:10.1029/2004gl021346, 2005.
Nikiema, O., Devenon, J. L., and Baklouti, M.: Numerical model-ing of the Amazon River plume, Cont. Shelf Res., 27, 873–899, 2007.
Poulton, S. W. and Raiswell, R.: The low-temperature geochem-ical cycle of iron: From continental fluxes to marine sediment deposition, Am. J. Sci., 302, 774–805, 2002.
Purcell, J. E., Malej, A., and Benovic, A.: Potential links of jelly-fish to eutrophication and jelly-fisheries, in: Ecosystems at the land-sea margin: drainage basin to coastal land-sea, edited by: Malone, T.
C., Malej, A., Harding, L. W., Smodlaka, N., and Turner, R. E., Coast. Estuar. Stud., 55, 241–263, 1999.
Purcell, J. E., Uye, S., and Lo, W. T.: Anthropogenic causes of jelly-fish blooms and their direct consequences for humans: a review, Mar. Ecol.-Prog. Ser., 350, 153–174, doi:10.3354/meps07093, 2007.
Rabalais, N. N., Wiseman, W. J., Turner, R. E., SenGupta, B. K., and Dortch, Q.: Nutrient changes in the Mississippi River and system responses on the adjacent continental shelf, Estuaries, 19, 386–407, 1996.
Rabouille, C., Mackenzie, F. T., and Ver, L. M.: Influence of the hu-man perturbation on carbon, nitrogen, and oxygen biogeochem-ical cycles in the global coastal ocean, Geochim. Cosmochim. Ac., 65, 3615–3641, 2001.
Ragueneau, O., Chauvaud, L., Leynaert, A., Thouzeau, G., Paulet, Y. M., Bonnet, S., Lorrain, A., Grall, J., and Corvaisier, R.: Di-rect evidence of a biologically active coastal silicate pump: Eco-logical implications, Limnol. Oceanogr., 47, 1849–1854, 2002. Ragueneau, O., Conley, D. J., DeMaster, D. J., D¨urr, H. H., and
Dit-tert, N.: Biogeochemical Transformations of Silicon Along the Land-Ocean Continuum and Implications for the Global Carbon Cycle, in: Carbon and Nutrient Fluxes in Continental Margins, edited by: Liu, K. K., Atkinson, L., Qui˜nones, R., and Talaue-McManus, L., Global Change – The IGBP Series, Springer, Berlin, 515–527, 2010.
Roubeix, V., Becquevort, S., and Lancelot, C.: Influence of bacte-ria and salinity on diatom biogenic silica dissolution in estuarine systems, Biogeochemistry, 88, 47–62, doi:10.1007/s10533-008-9193-8, 2008.
Seitzinger, S. P., Harrison, J. A., Dumont, E., Beusen, A. H. W., and Bouwman, A. F.: Sources and delivery of carbon, nitrogen, and phosphorus to the coastal zone: An overview of Global Nutrient Export from Watersheds (NEWS) models and their application, Global Biogeochem. Cy., 19, GB4S01, doi:10.1029/2005GB002606, 2005.
Seitzinger, S. P., Mayorga, E., Bouwman, A. F., Kroeze, C., Beusen, A. H. W., Billen, G., Van Drecht, G., Dumont, E., Fekete, B. M., Garnier, J., and Harrison, J. A.: Global river nutrient export: A scenario analysis of past and future trends, Global Biogeochem. Cy., 24, GB0A08, doi:10.1029/2009gb003587, 2010.
Six, K. D. and MaierReimer, E.: Effects of plankton dynamics on seasonal carbon fluxes in an ocean general circulation model, Global Biogeochem. Cy., 10, 559–583, 1996.
Tr´eguer, P., Nelson, D. M., Vanbennekom, A. J., Demaster, D. J., Leynaert, A., and Queguiner, B.: The Silica Balance in the World Ocean: A Reestimate, Science, 268, 375–379, 1995.
Ver, L. M. B., Mackenzie, F. T., and Lerman, A.: Carbon cycle in the coastal zone: effects of global perturbations and change in the past three centuries, Chem. Geol., 159, 283–304, 1999. V¨or¨osmarty, C. J., Fekete, B. M., Meybeck, M., and Lammers, R.
B.: Global system of rivers: Its role in organizing continen-tal land mass and defining land-to-ocean linkages, Global Bio-geochem. Cy., 14, 599–621, 2000a.
V¨or¨osmarty, C. J., Fekete, B. M., Meybeck, M., and Lammers, R. B.: Geomorphometric attributes of the global system of rivers at 30-minute spatial resolution, J. Hydrol., 237, 17–39, 2000b. Wells, M. L. and Mayer, L. M.: Variations in the Chemical Lability
Wells, M. L. and Trick, C. G.: Controlling iron availability to phy-toplankton in iron-replete coastal waters, Mar. Chem., 86, 1–13, doi:10.1016/j.marchem.2003.10.003, 2004.
Wetzel, P.: Interannual and Decadal Variability in the Air-Sea Ex-change of CO2– a Model Study, Ph.D. thesis, 127 pp., 2004.
Wetzel, P., Winguth, A., and Maier-Reimer, E.: Sea-to-air CO2flux from 1948 to 2003: A model study, Global Biogeochem. Cy., 19, Gb2005, doi:10.1029/2004GB002339, 2005.