IJBCP International Journal of Basic & Clinical Pharmacology
Research Article
Pharmacovigilance programme of India from the perspective
of nursing students
Karunasree Nagarur
1*, Karunasree Podila
2INTRODUCTION
Pharmacovigilance is the branch of science and activities relating to the detection, assessment, understanding and prevention of adverse effects or any other drug-related problem. Good Pharmacovigilance programs help in identifying the risks and risk factors associated with drugs in the shortest possible time so that harm can be avoided or minimized. Without the Pharmacovigilance programme, many adverse effects of the drugs have not been known and the banned drugs would be still in the market causing potential harm.1
When communicated effectively, this informationallows for the intelligent, evidence-based use ofmedicines and has the potential for preventing manyadverse reactions. Physicians, pharmacists, nurses and the consumers play a key role in Pharmacovigilance programs, but in many studies underreporting was observed. An estimated median underreporting rate (defined as percentage of ADRs detected from intensive data collection that were not reported to relevant spontaneous reporting systems) of 94% and occurs frequently for serious and unlabelled reactions.2,3 This can delay detection of important ADRs. Studies from different settings indicate inadequate knowledge about pharmacovigilance among healthcare professionals as well as attitudes that are associated with
ABSTRACT
Background: Lack of knowledge and awareness of reporting adverse drug reactions is common among the nursing staff. As the nursing staffs are more close to the patients, this study was undertaken to evaluate their knowledge, attitude and perception about pharmacovigilance and ADR reporting. The objective of this study was to assess the knowledge, attitude and perception of nursing staff about pharmacovigilance programme and finding out the ways of improving the ADR reporting rate.
Methods: Across-sectional, anonymous, questionnaire based study was conducted at the Government hospital, Nizamabad among the nursing staff. A predesigned, pretested and validated questionnaire consisting of 15 questions and 8 statements on knowledge, attitude and practice aspects of Pharmacovigilance programme in India. All the nursing staffs were explained about the purpose of the study and the questionnaire was distributed. Adequate time was given to fill them. Data spread on the excel sheet and the results were analysed using Microsoft office 2007 version.
Results: Out of 65 students, 74.1% were aware of the term pharmacovigilance, 44.4% of the pharmacovigilance programme in India and 70.4% of the pharmacovigilance cell in their institute. 22.2%stated that known reactions, 14.8% unknown and 63% that all ADRs are to be reported.63% stated herbal drugs are safe, 44.4% that over the counter drugs are safe. Reporting system stated was by making call/by e-mail (25.9), written form (29.6%). Underreporting was due to lack of awareness (51.9%), lack of time (22.2%), feeling of creating negative impression on heath personnel (11.1%), or due to the feeling of waste of time (14.8%).
Conclusions: Lack of facilities and clinical knowledge about ADR discourages them from reporting. Educational interventions and improvement of facilities were also suggested to enhance reporting rate in the hospital.
Keywords: Pharmacovigilance, ADR reporting, Nursing staff, Knowledge, Attitude and practice
DOI: http://dx.doi.org/10.18203/2319-2003.ijbcp20162451
1Department of Pharmacology,
Government Medical College, Nizamabad, Telangana, India
2Department of Pharmacology,
ESIC Medical College, Sanathnagar, Hyderabad, India
Received: 14 May 2016 Accepted: 09 June 2016
*Correspondence to: Dr. Karunasree Nagarur, Email: raja_narasimharao@ yahoo.com
a high degree of underreporting.4,5 We know the nursing staff are the important stakeholders of Pharmacovigilance programme, as they monitor the patient more closely. Hence the present study was planned to assess the knowledge, attitude and perception of nursing graduate students.
METHODS
The study was conducted at a government medical college and teaching hospital, Nizamabad of Telangana State during the year 2015. Institutional ethics committee permission was sought before initiation of study.
The design of this study was a cross-sectional, anonymous, questionnaire based study.
Subjects under this study were 65 students of 2nd year general nursing graduates who were willing to participate in the study were included.
Tool of this study questionnaire which was predesigned, pretested and validated was used for data collection as a research tool. The questionnaire consists of 15 questions and eight statements on the knowledge, attitude and practice aspects of pharmacovigilance programme in India.
Procedure of this study was all the study participants were explained about the purpose of study and the questionnaires were distributed. Adequate time was given to fill them. The data obtained was spread in excel sheet and results were analysed using Microsoft Office 2007 version.
RESULTS
A total of 65 students participated in the survey out of 80 students of 2nd year general nursing graduates. Out of them 11 students have not answered all the questions, the remaining 54 questionnaires were considered for statistics. Mean±SD of the age of students was
18.63±0.56 years. All the students were females. The responses of the students were calculated in percentages.
Knowledge about the Pharmacovigilance programme
Only 25.9% students were not aware of the term Pharmacovigilance, whereas 74.1% were aware of it. About 44.4% were aware of the national Pharmacovigilance programme of India and remaining (56.6%) were not. Regarding the awareness of pharmacovigilance cell in their institute, 70.4% of students were aware of it and the remaining (29.6%) were not. Only 14.8% had given the correct response about the location of national centre for pharmacovigilance, as Ghaziabad. Nearly 37% stated correctly about the national monitoring centre of ADRs as Indian pharmacopoeia commission-national coordinating centre for pharmacovigilance. Regarding the knowledge on how to report the ADR, only 18.5% stated it can be reported by any of the means i.e., making a call/by email/through written forms, but 25.9% each stated ADR to be reported only by making a call/by email. And 29.6% stated that it can be done through written forms.
Attitude about the pharmacovigilance and safety of drugs
With regard to the safety of the drug, about 63% were of the opinion that herbal drugs were safe and 44.4% opined that over the counter drugs were safe. Most of the students (51.9%) mentioned lack of awareness as the common cause of underreporting of ADRs, followed by lack of time by 22.2%, feeling that if reported may create negative impression on health care personnel by 11.1%. About 14.8% felt that it’s of no use/waste of time.
Most of the students (48.1%) stated that it’s the nurse’s responsibility to report ADRs, whereas 22.2% stated it as doctor’s responsibility and 14.8% each stated it as patient, pharmacist responsibility respectively.
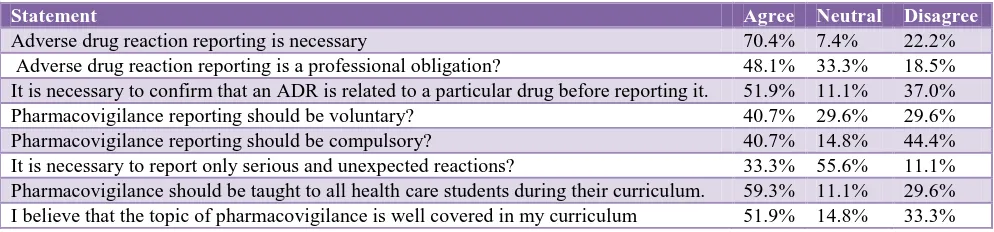
[image:2.595.51.548.612.728.2]The opinion of the students regarding the statements was given in below Table 1.
Table 1: Attitude of students on pharmacovigilance programme.
Statement Agree Neutral Disagree
Table 2: Frequencies.
Notes
Output created 21-Mar-2016 11:22:11
Comments
Input
Active data set Data Set 0
Filter <none>
Weight <none>
Split file <none> N of rows in
working data file 27
Missing value handling
Definition of missing
User-defined missing values are treated as missing.
Cases used
Statistics are based on all cases with valid data.
Syntax
Frequencies variables = Q1 Q2 Q3 Q4 Q5 Q6 Q7 Q8 Q9 Q10 Q11 Q12 Q13 Q14 Q15 S1 S2 S3 S4 S5 S6 S7 S8
[image:3.595.309.548.141.754.2]age/statistics=mean /order=analysis. Resources Processor time 00 00:00:00.046 Elapsed time 00 00:00:00.140
Table 3: Statistics.
Q1 Q2 Q3 Q4 Q5 Q6 Q7
N Valid 27 27 27 27 27 27 27
Missing 0 0 0 0 0 0 0
Mean 2.4074 2.5926
Q8 Q9 Q10 Q11 Q12 Q13 Q14
N Valid 27 27 27 27 27 27 27
Missing 0 0 0 0 0 0 0
Mean 2. 07 41 1.4 074 1.8 889 2.2 963 2.4
074 2.2222
Q15 S1 S2 S3 S4 S5 S6
N Valid 27 27 27 27 27 27 27
Missing 0 0 0 0 0 0 0
Mean 2.2222
S7 S8 Age
N Valid 27 27 27
Missing 0 0 0
Mean 18.6296
Practice about the pharmacovigilance
Nearly 63% stated that all the known and unknown adverse drug reactions (ADRs) are to be reported, where as 22.2% stated as only known reactions and 14.8% as only unknown reactions to be reported. About 70.4% stated that ADRs of both the old and new drugs have to be
reported, where as 11.1% stated only ADRs of old drugs have to be reported and 18.5% stated as ADRs of new drugs to be reported. Only 51.9% stated that they know how to report the ADR.
Table 4: Questionnaires.
Q1
Frequency Percent Valid percent
Cumulative percent
Valid
N 7 25.9 25.9 25.9
Y 20 74.1 74.1 100.0
Total 27 100.0 100.0
Q2
Frequency Percent Valid percent
Cumulative percent Valid
N 15 55.6 55.6 55.6
Y 12 44.4 44.4 100.0
Total 27 100.0 100.0
Q3
Frequency Percent Valid percent
Cumulative percent
Valid
1 3.7 3.7 3.7
N 8 29.6 29.6 33.3
Y 18 66.7 66.7 100.0
Total 27 100.0 100.0
Q4
Frequency Percent Valid Percent
Cumulative Percent
Valid
1.00 6 22.2 22.2 22.2
2.00 4 14.8 14.8 37.0
3.00 17 63.0 63.0 100.0
Total 27 100.0 100.0
Q5
Frequency Percent Valid percent
Cumulative percent
Valid
1.00 3 11.1 11.1 11.1 2.00 5 18.5 18.5 29.6 3.00 19 70.4 70.4 100.0 Total 27 100.0 100.0
Q6
Frequency Percent Valid percent
Cumulative percent Valid
N 10 37.0 37.0 37.0
Y 17 63.0 63.0 100.0
Total 27 100.0 100.0
Q7
Frequency Percent Valid percent
Cumulative percent Valid
N 15 55.6 55.6 55.6
Y 12 44.4 44.4 100.0
[image:3.595.50.287.399.657.2]Q8
Frequency Percent Valid percent
Cumulative percent Valid
N 13 48.1 48.1 48.1
Y 14 51.9 51.9 100.0
Total 27 100.0 100.0
Q9
Frequency Percent Valid percent
Cumulative percent
Valid
1.00 13 48.1 48.1 48.1
2.00 3 11.1 11.1 59.3
3.00 7 25.9 25.9 85.2
4.00 4 14.8 14.8 100.0
Total 27 100.0 100.0
Q10
Frequency Percent Valid percent
Cumulative percent
Valid
1.00 20 74.1 74.1 74.1
2.00 3 11.1 11.1 85.2
3.00 4 14.8 14.8 100.0
Total 27 100.0 100.0
Q11
Frequency Percent Valid percent
Cumulative percent
Valid
1.00 14 51.9 51.9 51.9
2.00 6 22.2 22.2 74.1
3.00 3 11.1 11.1 85.2
4.00 4 14.8 14.8 100.0
Total 27 100.0 100.0
Q12
Frequency Percent Valid percent
Cumulative percent
Valid
1.00 5 18.5 18.5 18.5
2.00 10 37.0 37.0 55.6
3.00 11 40.7 40.7 96.3
4.00 1 3.7 3.7 100.0
Total 27 100.0 100.0
Q13
Frequency Percent Valid percent
Cumulative percent
Valid
1.00 7 25.9 25.9 25.9
2.00 7 25.9 25.9 51.9
3.00 8 29.6 29.6 81.5
4.00 5 18.5 18.5 100.0
Total 27 100.0 100.0
Q14
Frequency Percent Valid percent
Cumulative percent
Valid
1.00 10 37.0 37.0 37.0
2.00 1 3.7 3.7 40.7
3.00 16 59.3 59.3 100.0
Total 27 100.0 100.0
Q15
Frequency Percent Valid percent
Cumulative percent
Valid
1.00 6 22.2 22.2 22.2
2.00 13 48.1 48.1 70.4
3.00 4 14.8 14.8 85.2
4.00 4 14.8 14.8 100.0
[image:4.595.54.313.63.739.2]Total 27 100.0 100.0
Table 5: Statements.
S1
Frequency Percent Valid percent
Cumulative percent
Valid
A 19 70.4 70.4 70.4
D 2 7.4 7.4 77.8
N 6 22.2 22.2 100.0
Total 27 100.0 100.0
S2
Frequency Percent Valid percent
Cumulative percent
Valid
A 13 48.1 48.1 48.1
D 9 33.3 33.3 81.5
N 5 18.5 18.5 100.0
Total 27 100.0 100.0
S3
Frequency Percent Valid percent
Cumulative percent
Valid
A 14 51.9 51.9 51.9
D 3 11.1 11.1 63.0
N 10 37.0 37.0 100.0
Total 27 100.0 100.0
S4
Frequency Percent Valid percent
Cumulative percent
Valid
A 11 40.7 40.7 40.7
D 8 29.6 29.6 70.4
N 8 29.6 29.6 100.0
Total 27 100.0 100.0
S5
Frequency Percent Valid percent
Cumulative percent
Valid
A 11 40.7 40.7 40.7
D 4 14.8 14.8 55.6
N 12 44.4 44.4 100.0
Total 27 100.0 100.0
S6
Frequency Percent Valid percent
Cumulative percent
Valid
A 9 33.3 33.3 33.3
D 15 55.6 55.6 88.9
N 3 11.1 11.1 100.0
S7
Frequency Percent Valid percent
Cumulative percent
Valid
A 16 59.3 59.3 59.3
D 3 11.1 11.1 70.4
N 8 29.6 29.6 100.0
Total 27 100.0 100.0
S8
Frequency Percent Valid percent
Cumulative percent
Valid
A 14 51.9 51.9 51.9
D 4 14.8 14.8 66.7
N 9 33.3 33.3 100.0
Total 27 100.0 100.0
DISCUSSION
Pharmacovigilance is defined as the science and activities relating to the detection, assessment, understanding and prevention of adverse effects or any other drug-related problems.7
Adverse drug reaction reporting is an important tool in the Pharmacovigilance programme of India. In this programme, spontaneous reporting of ADR forms the major contribution which leads to signal detection of ADRs. Pharmacovigilance is still in the infant stage in India, likely to expand in the near future which requires more awareness among health care professionals. As the nurses are the ones who closely monitor the patients, the present study was designed to assess the perspective of nursing student’s on Pharmacovigilance programme of India.
In the present study when the knowledge of nursing students regarding the Pharmacovigilance was assessed, only 25.9% students were not aware of the term Pharmacovigilance, whereas 56.6% were not aware of the Pharmacovigilance Programme of India. In Sushma et al study 55% were unaware of the term. In Sandeep et al study 62.4% gave correct response regarding the definition of pharmacovigilance Only 14.8% responded correctly about the location of national centre for pharmacovigilance, as Ghaziabad and 37% stated correctly about the national monitoring centre of ADRs as Indian pharmacopoeia commission as national coordinating centre for pharmacovigilance.9 About 70.4% of students were aware of the pharmacovigilance cell in their institute. In Sushma et al study 26% were aware of pharmacovigilance centre in their institute.in Sandeep et al study 71.3% were aware of the pharmacovigilance committee in their institute.9 This indicates that most of the people (74.1%) were aware of reporting the adverse drug reactions but they do not know about the national programme and real sense of collecting the adverse drug reactions.
Regarding the knowledge on how to report the ADR, there was a variety of responses either by making a call,
by email, through written forms or by all the these methods which clearly tells us about the poor knowledge on how to report the ADR. Hence some training is needed for the students on how to report the ADRs.
With regard to the safety of the drugs, about 63% opined that herbal drugs were safe and 44.4% opined that over the counter drugs were safe. This is mainly because of misconception that drugs which are available outside without any prescription are safe.
The attitude of nursing students about reporting of ADRs by whom, 48.1% stated it as nurses responsibility, 22.2% stated it as doctors responsibility, 14.8% stated it as pharmacists and remaining 14.8% as patients responsibility. It indicates that they are not totally aware who has to report the ADR.
Majority of the nursing students (70.4%) stated that adverse drug reaction reporting is necessary. in Sushma et al study 72% felt that only significant ADRs need to be reported.8 in Sandeep et al study 97% health professionals agreed that reporting of ADRs is necessary.9 40.7% stated that training of pharmacovigilance should be voluntary.
About half of them (48.1%) stated it as a professional obligation. 51.9% agreed that reaction is to be related to the drug before reporting it. More than half agreed that Pharmacovigilance to be taught to all the health care students as a part of their curriculum. About 51.9% agreed that it was well covered in their curriculum, whereas 33.3% disagreed and 14.8% were neutral.
The determinants of underreporting, from our study include lack of awareness (51.9%), lack of time (22.2%), waste of time/no use (14.8%) and attitude of health care personnel that reporting of ADRs might create negative impact on them (11.1%). The results of present study were similar to the study conducted by Chatterjee et al where they mentioned lack of time as the main reason for under-reporting.10
Regarding the Pharmacovigilance practices among the nursing students, Nearly 63% stated that all the known and unknown Adverse Drug Reactions(ADRs) are to be reported, where as 22.2% stated as only known reactions and 14.8% as only unknown reactions to be reported. About 70.4% stated that reactions of both old and new drugs to be reported, 11.1% stated only ADRs of old (marketed) drugs to be reported and 18.5% stated as ADRs of only new drugs to be reported. But, none of them had reported any ADR till now, the reason may be their higher officials might be taking care of it or it may any of the reasons of under reporting.
CONCLUSION
In conclusion, the present study conducted in a government hospital, shows that majority of the health care professionals have good knowledge about ADR reporting and understand the need for reporting. Lack of facilities and clinical knowledge about ADR discourages them from reporting. Educational interventions and improvement of facilities were also suggested to enhance reporting rate in the hospital.
ACKNOWLEDGEMENTS
The authors would like to express sincere gratitude to nursing students of Govt General Hospital, Nizamabad for their cooperation and consent.
Funding: No funding sources Conflict of interest: None declared
Ethical approval: The study was approved by the Institutional Ethics Committee
REFERENCES
1. Wysowski DK, Swartz L. Adverse drug event surveillance and drug withdrawals in the United States, 1969-2002: the importance of reporting suspected reactions. Arch Intern Med. 2005;165:1363-9.
2. Hazell L, Shakir SA. Under-reporting of adverse drug reactions: a systematic review. Drug Saf. 2006;29:385-96.
3. Moride Y, Haramburu F, Requejo AA, Begaud B. Under-reporting of adverse drug reactions in general practice. Br J Clin Pharmacol. 1997;43:177-81. 4. Heeley E, Riley J, Layton D, Wilton LV, Shakir
SAW. Prescription-event monitoring and reporting of adverse drug reactions. Lancet. 2001;358:1872-3. 5. Williams D, Feely J. Underreporting of adverse drug
reactions: attitudes of Irish doctors. Ir J Med Sci. 1999;168:257-61.
6. Hasford J, Goettler M, Munter KH, Muller-Oerlinghausen B. Physicians’ knowledge and attitudes regarding the spontaneous reporting system for adverse drug reactions. J Clin Epidemiol. 2002;55:945-50.
7. World Health Organization. Safety of medicines: A guide to detecting and reporting adverse drug reactions. Geneva: 2002. WHO/EDM/QSM/2002.2. 8. Muraraiah S, Rajarathna K, Sreedhar D, Basavalingu
D, Jayanthi CR. A questionnaire study to assess the knowledge, attitude and practice of Pharmacovigilance in a paediatric tertiary care centre. J Chem Pharm Res. 2011;3:416-22.
9. Gupta SK, Nayak RP, Shivaranjani R, Vidyarthi SK. Aquestionare study on knowledge, attitude, and the practice of pharmacovigilance among the health care professionals in a teaching hospital in South India. Perspect Clin Res. 2015;6:45-52.
10. Chatterjee S, Lyle N, Ghosh S. A survey of the knowledge, attitude and practice of adverse drug reaction reporting by clinicians in eastern India. Drug Saf. 2006;29:641-2.
QUESTIONAIRE
1. Have you heard the term pharmacovigilance?
Yes / No
2. Are you aware of the existence of national Pharmacovigilanceprogramme in India?
Yes / No
3. Are you aware of the ADR monitoring centre in your institute?
Yes / No
4. Which ADRs should be reported?
i. Known reactions
ii. Only Unknown/new reactions iii. All the reactions
5. Adverse Reactions of which drugs have to be reported?
i. Only for old drugs in the market
ii. Only for newly approved drugs in market iii. All the drugs
6. All the herbal drugs are safe?
Yes / No
7. All the over the counter drugs are safe?
Yes / No
8. Do you know how to report the ADR?
Yes / No
9. The national centre for adverse drug reaction monitoring is located in
i. New delhi ii. Kolkata iii. Mumbai iv. Chennai
10. Which of the following scales is most commonly used to establish the causality of an ADR?
i. WHO Scale ii. Naranjo scale iii. Kramers scale
11. Which factor will be the cause of ADR under-reporting?
i. Lack of awareness of Pharmacovigilance ii. Lack of time to report
iii. If reported, it may result in negative impression on doctor/nurse
iv. Thinking it’s of no use / waste of time
12. Which of the following regulatory body in India regulates ADR reporting?
i. Ministry of health
ii. Indian Pharmacopoeia commission – NCC iii. ICMR
13. Which of the following ADR reporting system is used in India?
i. Make a call
ii. Through written forms iii. By mail
iv. All
14. A serious adverse event is
i. Treatment on OP basis
ii. Withdraw the drug & no treatment iii. Patient admitted in ICU for treatment iv. Patient admitted in ward for treatment
15. The most important healthcare professional(s) responsible for reporting ADR in a hospital is/are (Can choose more than one option)
i. Physician ii. Nurse
STATEMENTS
Please write agree, neutral, disagree.
1. Do you think adverse drug reaction reporting is necessary?
2. Do you think reporting adverse drug reaction is a professional obligation?
3. Do you think it is necessary to confirm that an ADR is related to a particular drug before reporting it?
4. Do you think pharmacovigilance reporting should be voluntary?
5. Do you think pharmacovigilance reporting should be compulsory?
6. Do you think that it is necessary to report only serious and unexpected reactions?
7. Pharmacovigilance should be taught to all health care students during their curriculum.