Progress in Biological Sciences
Vol. 5, Number 2, Summer / Autumn 2015/287-301Optimization of alkaline protease production
from a locally isolated Bacillus sp. ZR-5:
Potential application as a detergent additive
Received: March 10, 2015; Accepted: June 20, 2015
Hossein Mohammadian1, Mohammad Rabbani1*, Ali Hafizi2, Hamid MirMohammad Sadeghi1, Amin Davary1,
1, Ziaedin Samsam Shariat3, Zahra Etemadifar4
1. Department of Pharmaceutical Biotechnology, Isfahan Pharmaceutical Sciences Research Center, School of Pharmacy and Pharmaceutical Sciences, Isfahan University of Medical Sciences, Isfahan, Iran
2. Chemical Engineering Department, School of Chemical and Petroleum Engineering, Shiraz University, Shiraz 71345, Iran
3. Department of Biochemistry, Isfahan Pharmaceutical Sciences Research Center, School of Pharmacy and Pharmaceutical Sciences, Isfahan University of Medical Sciences, Isfahan, Iran
4. Department of Biology, School of Basic Sciences, University of Isfahan, Isfahan, Iran
The aim of this study was to optimize protease production using a novel Bacillus sp. ZR-5 strain isolated from the soil, and evaluate its application in detergent industry. The proteolytic activity of the strain was demonstrated using gelatin hydrolysis screening test. Protease production optimization was carried out using a two-step approach: a conventional method in order to identify the best carbon and nitrogen sources followed by the application of response surface methodology (RSM) to optimize the factors, which include temperature, pH and incubation time. Glucose or fructose (5 g/L), wheat bran (5 g/L), temperatures of 25 and 55°C, pH 10.0 and an approximate incubation time of 44 h, were determined as the optimal conditions according to optimization processes. Validation tests were carried out under these conditions and the results were in good agreement with RSM predicted data. The in-gel activity (zymogram) test showed two hydrolytic zones with 66.2 and 36.5 kDa molecular weight on the casein containing polyacrylamide gel. The high compatibility in the presence of detergent powder and washing performance test suggested that the crude enzyme could be an appropriate choice as a detergent additive in detergent industries.
Keywords: alkaline proteases, Bacillus sp. ZR-5, detergent compatibility, media optimization, response surface methodology.
Introduction
Proteases are physiologically and commercially important classes of hydrolytic enzymes. They constitute approximately 60% of the total worldwide enzyme sales for various industrial applications such as food, pharmaceutical, leather, diagnostics, waste management, recovery of silver films and more importantly in detergent industries (1-3). These enzymes are produced by animals, plants and various microorganisms. Many microbial species produce proteases, however, only those microorganisms producing significant quantity of enzyme are applicable for industrial use. Bacteria are excellent sources of the enzymes, due to their broad biochemical diversity and susceptibility to genetic manipulation (4). Currently, a large share of the commercially available alkaline proteases have been extracted from Bacillus
species (5, 6). Among these proteases, those that are active at room temperature and also stable in the alkaline pH range have remarkable applications (7). Considering the industrial importance of proteases, many attempts have been performed to maximize the production and economization. The enzyme production yield could be optimized based on various physicochemical parameters of media using several approaches. Conventional "one-variable-at-a-time” method is a commonly used operation in biotechnology in determining the most important parameters influencing enzyme production (8). This method, however, is time-consuming, expensive, more importantly does not consider the interactions between various treatment parameters, and is only utilized for single variable factors (9). In order to resolve these problems, statistical approaches, such as response surface methodology (RSM), has been used in several recent studies for the improvement of
protease production (10-15). RSM is a collection of statistical techniques for designing and building the most appropriate model in order to achieve the optimizing conditions with a minimal number of experiments (16, 17).
In this study, a novel strain of Bacillus
proven to have extracellular lipase producing ability, as well as thermostable, alkalophilic and caseinolytic properties (18), was isolated. The aim of this present study was to optimize the culture conditions using conventional and statistical strategies in order to increase the production of alkaline proteases as a potential candidate for industrial applications.
Materials and Methods
Microorganism
The bacterial strain was isolated from indigenous soil sample during our previous study. This new indigenous strain was identified as Bacillus sp. using 16S rDNA method and was named Bacillus sp. ZR-5. Further experiments based on partial sequence of 16S rDNA homology showed that it was closely related to Bacillus pumilus
species (18). The isolated strain was subculture, and then transferred into a 20% (v/v) glycerol and stored at -70
°
C for further use.Inoculum
preparation
and
screening test
Inoculum preparation. The inoculum medium was prepared by transferring a loop full of fresh bacterial culture into 50 ml nutrient broth medium and incubated at 37ºC for 16 h at 180 rpm.
on nutrient agar was inoculated to the gelatin medium. The medium was maintained at 37ºC for 24 h. Afterwards, the medium was transferred to 4ºC for 1 h in order to investigate protease production.
Protease assay
Alkaline protease activity was determined using a modified form of the method introduced by Joo et al. (5). The reaction mixture containing 0.5 ml of casein (5 g/L) was dissolved in 20 mM Glycin-NaOH buffer (pH 10.0). The reaction started as soon as the 0.1 ml enzyme solution from the crude extract was added and incubated at 25°C for 30 min. Then, the enzyme reaction was stopped by the addition of 0.75 ml Trichloroacetic acid (100 g/L) and retained in 4°C for 1 h. Finally, the mixture was centrifuged at 12,000 rpm for 10 min and the optical density of the supernatant was measured at 280 nm. The same reaction mixture free of crude enzyme was used as blank. One unit of protease activity was defined as the amount of enzyme releasing soluble fragments equivalent to 0.001 absorbance at 280 nm after 30 min reaction under the conditions described above. The results were achieved from the mean of at least three repeats and the differences between them did not exceed 5%.
Selection of the best carbon and
nitrogen sources
To obtain the most suitable nitrogen and carbon sources, a basal liquid medium that composed of (g/L) glucose, 5; yeast extract, 5; NaCl, 5; KH2PO4, 1; K2HPO4, 0.3;
MgSO4.7H2O, 0.2 and CaCl2, 2 was utilized.
Several carbon sources (5 g/L), such as fructose, maltose and sucrose, were used in place of glucose in basal medium. Different
complex nitrogen sources (5 g/L), namely gelatin, wheat bran, gluten, dried corn powder, dried fish powder, nutritious soybean and livestock soybean were added to the basal medium. The pH of the media was adjusted to 7.0 using 200 g/L Na2CO3 solution. The
media were inoculated with 2% (v/v) 16 h aged culture (inoculum medium) and incubated at temperature of 37°C at 180 rpm for 48 h. The cell-free supernatants (crude extract) from the centrifuged cultures were used for the determination of proteolytic activity during protease assay test.
Experimental design and protease
production
An experimental design was developed for the maximization of protease production by optimizing the medium variables, that is, incubation temperature, initial pH and incubation time using response surface methodology. The central composite design (CCD) was used for the response surface methodology in the experimental design. The CCD was well suited to fit the complicated surfaces and usually works well during the optimization process, also it is an effective design that is perfect for chronological experimentation (19).
In CCD, the total number of experiments is calculated using 2k+ 2k + n0, where, k is the
number of independent variables and n0 is the
number of repetitions of the experiments at the center point. The CCD of this study includes studying the effects of 3 factors in 2 levels (high, +1 and low, −1 levels) with 3 central points (coded level 0), and the axial points were based on α=2 in a single block with n0=3, which produces 17 sets of test
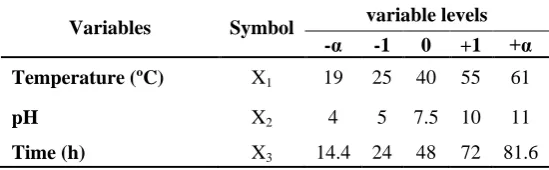
Table 1. Experimental levels of independent variables
Variables Symbol variable levels
-α -1 0 +1 +α
Temperature (ºC) X1 19 25 40 55 61
pH X2 4 5 7.5 10 11
Time (h) X3 14.4 24 48 72 81.6
As indicated in Table 1, the three independent variables were coded as X1, X2
and X3 for temperature, initial pH and time,
respectively as shown in Equation 1:
(1) 0
i i
i
X X
x
ΔX
where xi is the coded value of the ith
independent variable, Xi independent
variable, X0 the real value of independent
variable on the central point and ΔXi is the
step change value.
The experimental result obtained from the CCD model can be explained by the following equation:
(2)
2 0
1 1
k i i
k ii i
ij i j i i i j
Y β β x β x β x x ε
where β0 is the offset or constant term, βi is
the linear coefficient, βii is the quadratic
effect, βij represents the cross product
coefficient and ε is the statistical error.
In this study, the design of the experiment and response surface analysis was carried out using Design Expert software version 8.0.0. The experimental plan is shown in Table 2, and the protease activity is the responses of this study's design.
Table 2. Design arrangement and experimental results
Run Input variables Response variables
Temperature (ºC) pH Time (h) Protease activity (U/ml)
1 55 5 72 16660
2 25 5 24 17620
3 25 10 72 25800
4 40 7.5 48 16000
5 40 4 48 18220
6 40 7.5 81.6 15360
7 40 7.5 14.4 14000
8 61 7.5 48 22550
9 25 10 24 27200
10 55 10 72 24900
11 19 7.5 48 25100
12 40 11 48 22800
13 55 5 24 17900
14 40 7.5 48 18260
15 55 10 24 27000
16 25 5 72 15800
Zymogram analysis
A casein based proteolytic activity zymogram was performed according to the method of Garcia-Carreno et al. (20). Briefly, a suspension of soluble casein (1 g/L) was added into the separating gel before polymerization. Following electrophoresis at 4C, the gel was incubated in renaturing buffer (2.5% v/v Triton X-100) at room temperature. The renaturing buffer was replaced with developing buffer (Tris 20 mM, NaCl 0.2 mM and CaCl2 5 mM) and was
incubated at 25°C for at least 4 h. The gel was stained with coomassie brilliant blue R-250 (5 g/L) and finally destained. The zymogram profile was analyzed using Gel Doc XR molecular imager (Bio Rad Co).
Detergent stability
The compatibility of crude protease was tested with a commercial detergent (barf powder from paksan Co, Iran). Two final concentrations of detergent powder (5 and 10 g/L) were incorporated with enzyme-substrate mixture under assay test conditions. Residual activity was determined in the presence of a detergent-free sample as a positive control (100%).
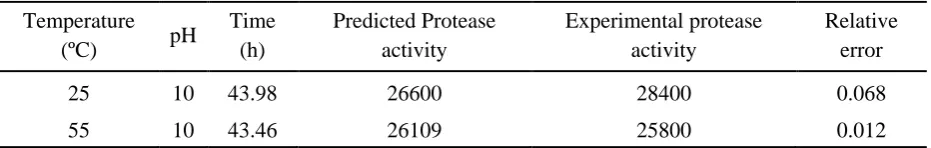
Functional detergent test
Washing performance test for analysis of crude enzyme was carried out using a simple method described by Arulmani et al. (21). The efficiency of the crude protease (25×103 U/ml) was studied by mixing the enzyme with the commercial enzyme free detergent (Barf), and then the mixture was used on white cotton cloth pieces (2×2 cm) that were stained with blood. The washing test was carried on these blood stained cotton cloths with different solutions as follows: (a) sole
water, (b) water containing detergent (5 g/L) and (c) water containing detergent (5 g/L) and enzyme. After incubation at 25°C for 30 min, the samples were rinsed with distilled water, and then dried for visual analysis test.
Results
Screening test
The gelatin in the broth medium was digested and the medium was in liquid form even at 4˚C after 1 h incubation time (data not show). This result indicated that the bacterium produced a desirable amount of protease.
Selection of the best carbon and nitrogen sources using the one-variable-at-a-time approach
Regarding the first step of the optimization process, among the different sources, fructose and glucose (5 g/L) were the best carbon sources, and wheat bran (5 g/L) was the best nitrogen source for protease production, respectively (Fig. 1), hence, they were chosen for further optimization studies.
Optimization
of
significant
variables using RSM
Figure 1. Effect of different carbon and nitrogen sources at constant concentrations on protease production. (A) The results for four different carbon sources: glucose (Glc), fructose (Fru), maltose (Mal) and sucrose (Suc). The activity in the presence of glucose is assumed to be 100% in comparison with other sources. (B) The results of seven nitrogen sources: wheat bran (W.B), corn powder (C.P), fish powder (F.P), nutritious soybean (N.S), gluten (Glu), gelatin (Gel), livestock soybean (L.S).
The fit summary output of the Design Expert software revealed that the quadratic model is statistically significant for the protease activity (Y). Therefore, quadratic model was used to represent the response for further analysis.
Analysis of variance (ANOVA) was used to investigate the validity of the obtained model in experimental design. Table 3 shows the ANOVA results for the reduced quadratic model of protease activity (Y). The values of Prob>F less than 0.05 indicate that the terms
of the model were significant, whereas values greater than 0.1 were not significant. Among several variables, temperature (X1), pH (X2),
time (X3) and second order effect of all
variables: 𝑋12,𝑋22 and 𝑋32 are were significant terms of the model. The linear interaction of these three variables including 𝑋1𝑋2, 𝑋1𝑋3 and 𝑋2𝑋3 terms were not significant and as such, were removed from the quadratic model in order to improve its accuracy.
Table 3. ANOVA table for response surface reduced quadratic model for 1-decene conversion
Source Sum of squares df Mean squares F-value P-value
Prob > F
Model 0.37 6 0.061 14.6 <0.0002 significant
X1-Temperature 9.384×10
-4
1 9.384×10⁻⁴ 0.23 0.6454
X2-pH 0.19 1 0.19 44.54 < 0.0001
X3-Time 1.818×10
-3
1 1.818×10⁻³ 0.44 0.5240
𝑋12 0.13 1 0.13 30.46 0.0003
𝑋22 0.040 1 0.04 9.65 0.0111
𝑋32 0.010 1 0.01 2.42 0.1507
Residual 0.042 10 4.169×10⁻³
Lack of Fit 0.037 8 4.578×10⁻³ 1.81 0.4045 not significant Pure Error 5.068×10⁻³ 2 2.534×10⁻³
Cor Total 0.41 16
R=0.9474, R(adjusted)=0.9143, R (predicted)= 0.785, adequate precision= 9.91
A
According to the F-values shown in Table 3, among the different significant parameters, pH has the greatest effect on protease activity, while temperature was found to be the least important. By considering their importance, the effective parameters can be ranked as:
𝑋2>𝑋12>𝑋22>𝑋32>𝑋3>𝑋1
The model's F-value of 14.6 implies that the model was significant. The other parameters were removed from the model due to their high P-values. The hierarchical terms (X1 and X3) were added after backward
elimination of regression in consequence of
𝑋12
and 𝑋32 parameters, which have P-values of 0.0003 and 0.1507, respectively.
The regression coefficient values were evaluated and the subsequent refined equation, including only the significant parameters, in terms of actual factors, is expressed as follows:
√𝑃𝑟𝑜𝑡𝑒𝑎𝑠𝑒 𝑎𝑐𝑡𝑖𝑣𝑖𝑡𝑦 = 2.42209 − 0.047529 X1− 0.12842𝑋2+
0.0056891𝑋3+ 0.0005867𝑋12+
0.01189𝑋22− 0.0000646𝑋32
(3)
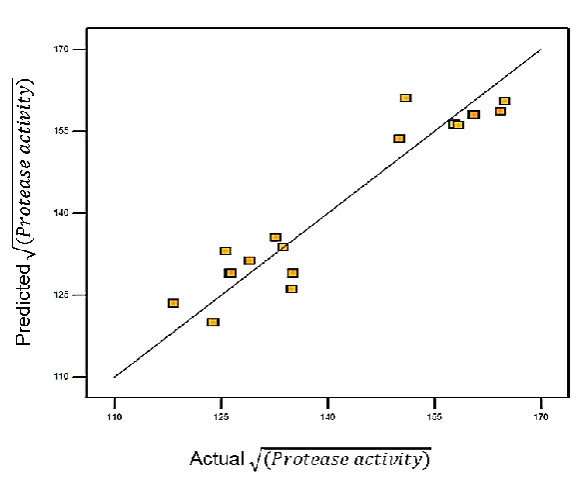
The determination coefficient shows the agreement of the model predicted values with experimental ones. The closer the R value is to 1,, results in the better predictability and accuracy of the model. As indicated in Table 3, the determination coefficient of 0.9474 for protease production indicates that the obtained statistical model can properly explain the response. The adjusted R value of 0.9143 is in reasonable agreement with the R value of 0.9474, thus indicating the suitability of the model. The actual versus predicted protease activity is shown in Figure 2. In the figure, the R value of 0.9474 shows a close proximity of the model's prediction with the experimental data signifying the validity of the regression models.
In addition, the adequate precision, the other important parameter for model evaluation, which is a measure of the signal to noise ratio, is evaluated for the model. The adequate precision ratio greater than 4 is desirable for a model to be a good fit. The quadratic model of protease activity has an “adequate precision value” of 9.91, indicating the applicability of the model for the navigation of the design space. The value of the removed insignificant parameter “Lack of Fit” is 0.4045, indicating that the eliminated terms are unimportant but prefered for the model.
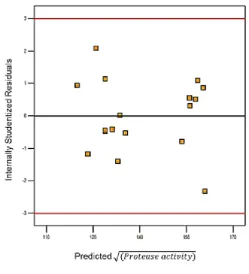
Studentized residuals versus predicted was
applied for the investigation of random experiments and unusual structure. Figure 3 shows the studentized residuals versus predicted for protease activity. This figure shows that there is no need for any suppose violation of the independence, and the plot should be a random scatter. This figure illustrates that there is no obvious pattern and unusual structure. The equal scatters above and below the x-axis in these figures imply that the proposed model is sufficient and there is no reason to suspect any infringement of the independence or constant variance assumption
Figure 3. Internally studentized residual versus predicted plot of protease activity
3D and contour plots were also generated to evaluate the effects of different process variables on predicted protease activity response over a range in the design surface. In 3D and contour plots, the protease activity was studied by considering two factors at a
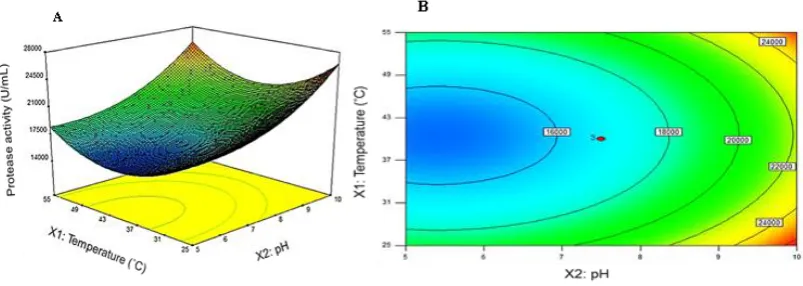
Figure 4. Temperature versus pH on protease activity at constant time of 48 h. (A) 3D Surface (B) contour plot
Figure 5. Temperature versus time on protease activity at constant pH of 1. (A) 3D Surface (B) contour plot
Figure 6. Time versus pH on protease activity at constant temperature of 40 ºC. (A) 3D Surface (B) contour plot
Figures 4A and B show the interactive effect of temperature and pH and their mutual interaction on protease activity at constant time of 48 h. Figure 4A shows that increase
activity initially decreases to a minimum at central temperature and then increases to maximum. Consequently, the optimum response can occur at 25ºC or 55ºC.
The prominent effect of temperature and time at pH 10 on protease activity is shown in Figures 5A and B. It is obvious from this figure, from the F-values shown in Table 3 and the coefficients of Equation 3, that temperature and time do not pose any considerable effect on the response, in comparison with pH and second power of all three variables. In fact, this surface and contour plot indicate that there is not any important interaction between temperature and time on protease activity at all levels.
The effects of time and pH on protease activity are shown in Figures 6A and B as at when temperature was at the middle point. pH parameter had a positive effect on protease activity, for example, by increasing the pH from 5 to 10, the protease activity increased from 15500 to 22000 (U/ml) at a temperature of 40C. The curvature of 3D surface in Figure 6A is due to the additional effectiveness of pH on the response than the time.
Optimization and validation of the
model
It is obvious that response surface methodology is a powerful technique for the investigation and optimization of multi-variable processes. So, this method was
applied in order to maximize protease activity according to the optimization of independent variables.
The optimization was performed using design expert software and the optimum variables for the maximization of protease production were achieved as shown in Table 4. As indicated in this table, the optimum conditions were obtained and thereafter, the experiments were performed under these conditions. Two optimum conditions were determined using the design expert optimization. Validation tests were carried out under these conditions in order to evaluate the exactness of the obtained optimums. The first optimum operating conditions were 25˚C, pH 10.0 and incubation time of 43.98 h. As Table 4 shows, the first obtained protease activity of the validation test at optimum operating conditions (28,400 U/ml) was in good agreement with the RSM predicted value (26,600) under the same conditions. The relative error was 0.068, which is acceptable and proves the accuracy and predictability of the considered model. Furthermore, as shown in the table and the contour plots of another maximum activity can occur at high temperatures. The second optimal operating variables were 55˚C, pH 10.0 and 43.46 h, predicting a protease activity of 26,109. The accuracy evaluation test was performed at these optimum, and the results showed a good agreement with the predicted value.
Table 4. RSM considered optimal conditions and comparison of predicted protease activity with validation test result Temperature
(ºC) pH
Time (h)
Predicted Protease activity
Experimental protease activity
Relative error
25 10 43.98 26600 28400 0.068
Zymogram analysis
The zymogram analysis of crude extract is shown in Figure 7. The existence of two clear bonds in gel might be attributed to the presence of two kinds of proteases in crude extract. This result could be related to the observation of two optimal temperatures in Table 4. Based on the migration distance of
the clear hydrolytic zone of the proteolytic activity in the dark background and the pre-stained protein molecular weight marker, the molecular weight of the proteases was evaluated. The molecular weights of the proteases were determined to be between 66.2 and 36.5 kDa using Gel Doc XR molecular imager (Bio RAD. Co).
Figure 7. Casein zymogram profile of the crude supernatant. Two clear zones indicated that the proteases, which were produced in optimal conditions, were perfectly active in gel. Lane 1: molecular size marker; lane 2: crude supernatant
Compatibility with detergent
The results showed that the protease had a desirable stability in the presence of detergent. In detergent powder concentrations
Functional detergent test
As it depicted in Figure 8, in order to check the functionality of the crude enzyme, washing performance test was performed on the basis of cleaning blood stain ability. When the sole water was used, the blood mass was washed, but a light brown stain remained on the cloth. While enzyme free
detergent was utilized, a big part of the stain was washed. However, when detergent supplemented with crude enzyme was used, the stain was removed completely, which implies a significant improvement in the efficiency of cleaning blood stain test (Fig. 8D). This functional test indicates that the crude enzyme would be a good candidate for detergent application.
Figure 8. Washing performance test.(A) Unwashed blood stained cloth, (B) blood stained cloth immersed in water, (C) blood stained cloth in 5 g/L enzyme free detergent solution, (D) blood stained cloth in detergent solution containing crude enzyme
Discussion
In general, enzyme production in microorganisms is maximized at their own special conditions. Researchers have attempted to induce protease production using complex inexpensive carbon and nitrogen sources as compared to simple ones (1, 17, 22). Since wheat bran is an abundant and cheap material, its utilization as substrate leads to reduction in the cost of media for large-scale production.
There is a growing tendency for using
response, while time and temperature showed low effects on protease production. The best optimized answers were 25˚C, pH 10.0, and approximately 44 h of incubation time and also, 55˚C, pH 10.0, and approximate 44 h for obtaining protease activities of 26,600 and 26,109, respectively. In order to investigate the accuracy of the proposed model and optimization, a validation test was performed under optimized conditions. The results indicated that the protease activity predicted by the model under optimal conditions was in a good agreement with the experimental data and thus confirmed the model's validity. As shown in previous studies, the activities of proteases at low-temperatures are more preferable for some industries like detergent production (23), while the activities of proteases at high temperatures are more desirable for some other applications such as leather processing (1, 6, 24). Considering these facts, the obtained crude supernatant can be used for both industries. In addition, zymogram test showed two distinct hydrolytic zones corresponding to the crude enzyme and proved protease production under the optimal operating condition. This result is in correlation with previous studies such as Fakhfakh-Zouari et al. (2010) in
which five proteolytic enzymes of Bacillus pumilus A1 (16) were reported, as well as several other studies that reported the proteolytic enzymes of B. pumilus strains (25-27). Also, in this study, it was shown that the residual activities in the presence of 5 and 10 g/l concentrations of detergent powders were 92-87% in detergent free solution (100%), respectively. In comparison with other studies, the compatibility of the proteases in the presence of detergent powder is remarkable, for example Arulmani et al. (2007) reported a protease from
B.laterosporus-AK1 with maximum of 75% residual activity in 8 g/L concentration of commercial detergent powders. Anwar and Mohammed (2000) isolated a protease from
Spilosoma oblique with maximum of 70% residual activity in the presence of commercial detergents. Finally, washing performance test suggested that the crude enzyme could be an appropriate choice as a detergent additive in detergent industries.
Acknowledgement
1.
2.
3.
4.
5.
6.
7.
8.
9.
10.
11.
12.
13.
14.
Gupta, R., Beg, Q.K. and Lorenz, P. (2002). Bacterial alkaline proteases: molecular approaches and industrial applications. Appl. Microbiol. Biot 59, 15-32.
Masui, A., Yasuda, M., Fujiwara, N. and Ishikawa, H. (2008). Enzymatic hydrolysis of gelatin layers on used lith film using thermostable alkaline protease for recovery of silver and PET film.
Biotechnol. Progr, 20, 1267-1269.
Demain, A.L. and Adrio, J.L. (2008). In Natural Compounds as Drugs Volume I Springer, in press., pp. 251-289.
Rao, M.B., Tanksale, A.M., Ghatge, M.S. and Deshpande, V.V. (1998). Molecular and biotechnological aspects of microbial proteases. Microbiol. Mol. Biol. R 62, 597-635.
Joo, H.S., Kumar, C.G., Park, G.C., Kim, K.T., Paik, S.R. and Chang, C.S. (2002). Optimization of the production of an extracellular alkaline protease from Bacillus horikoshii. Process. Biochem, 38, 155-159.
Kumar, C.G. and Takagi, H. (1999). Microbial alkaline proteases: from a bioindustrial viewpoint.
Biotechnol. Adv, 17, 561-594.
Wang, Q., Hou, Y., Xu, Z., Miao, J. and Li, G. (2008). Optimization of cold-active protease production by the psychrophilic bacterium Colwellia sp. NJ341 with response surface methodology. Bioresource. Technol, 99, 1926-1931.
Armstrong, N.A. (2006). Pharmaceutical experimental design and interpretation. CRC Press, London.
Singh, S.K., Singh, S.K., Tripathi, V.R., Khare, S.K. and Garg, S.K. (2011). Comparative one-factor-at-a-time, response surface (statistical) and bench-scale bioreactor level optimization of thermoalkaline protease production from a psychrotrophic Pseudomonas putida SKG-1 isolate.
Microb. Cell. Fact, 10, 114.
Liu, S., Fang, Y., Lv, M., Wang, S. and Chen, L. (2010). Optimization of the production of organic solvent-stable protease by Bacillus sphaericus DS11 with response surface methodology.
Bioresource. Technol, 101, 7924-7929.
Oskouie, S.F.G., Tabandeh, F., Yakhchali, B. and Eftekhar, F. (2008). Response surface optimization of medium composition for alkaline protease production by Bacillus clausii.
Biochem. Eng. J, 39, 37-42.
Pillai, P., Mandge, S. and Archana, G. (2011). Statistical optimization of production and tannery applications of a keratinolytic serine protease from Bacillus subtilis P13. Process. Biochem, 46, 1110-1117.
Rao, Y.K., Lu, S.-C., Liu, B.-L. and Tzeng, Y.-M. (2006). Enhanced production of an extracellular protease from Beauveria bassiana by optimization of cultivation processes.
Biochem. Eng. J 28, 57-66.
Reddy, L., Wee, Y.-J., Yun, J.-S. and Ryu, H.-W. (2008). Optimization of alkaline protease production by batch culture of Bacillus sp. RKY3 through Plackett–Burman and response surface methodological approaches. Bioresource. Technol, 99, 2242-2249.
.,
.,
.,
Thys, R., Guzzon, S.O., Cladera-Olivera, F. and Brandelli, A. (2006). Optimization of protease production by Microbacterium sp. in feather meal using response surface methodology. Process. Biochem, 41, 67-73.
Fakhfakh-Zouari, N., Haddar, A., Hmidet, N., Frikha, F. and Nasri, M. (2010). Application of statistical experimental design for optimization of keratinases production by Bacillus pumilus A1 grown on chicken feather and some biochemical properties. Process. Biochem, 45, 617-626. Haddar, A., Fakhfakh-Zouari, N., Hmidet, N., Frikha, F., Nasri, M. and Kamoun, A.S. (2010). Low-cost fermentation medium for alkaline protease production by Bacillus mojavensis A21 using hulled grain of wheat and sardinella peptone. J. Biosci. Bioeng 110, 288-294.
Rabbani, M., Bagherinejad, M.R., Sadeghi, H.M., Shariat, Z.S., Etemadifar, Z., Moazen, F., Rahbari, M., Mafakher, L. and Zaghian, S. (2013). Isolation and characterization of novel thermophilic lipase-secreting bacteria. Braz. J. Microbiol 44, 1113-1119.
Mukherjee. A. K and K., R.S. (2011). A statistical approach for the enhanced production of alkaline protease showing fibrinolytic activity from a newly isolated Gram-negative Bacillus sp. strain AS-S20-I. New. Biotechnol, 28, 182-189.
Garciacarreno, F., Dimes, L. and Haard, N. (1993). Substrate-gel electrophoresis for composition and molecular weight of proteinases or proteinaceous proteinase inhibitors. Anal. Biochem, 214, 65-69.
Arulmani, M., Aparanjini, K., Vasanthi, K., Arumugam, P., Arivuchelvi, M. and Kalaichelvan, P.T. (2007). Purification and partial characterization of serine protease from thermostable alkalophilic Bacillus laterosporus-AK1. World. J. Microb. Biot 23, 475-481.
Hübner, U., Bock, U. and Schügerl, K. (1993). Production of alkaline serine protease subtilisin Carlsberg by Bacillus licheniformis on complex medium in a stirred tank reactor. Appl. Microbiol. Biotechnol., 40, 182-188.
Maurer, K.-H. (2004). Detergent proteases. Curr. Opin. Biotech 15, 330-334.
Rai, S.K. and Mukherjee, A.K. (2011). Optimization of production of an oxidant and detergent-stable alkaline β-keratinase from Brevibacillus sp. strain AS-S10-II: Application of enzyme in laundry detergent formulations and in leather industry. Biochem. Eng. J 54, 47-56.
Kumar, C. (2002). Purification and characterization of a thermostable alkaline protease from alkalophilic Bacillus pumilus. Lett. Appl. Microbiol 34, 13-17.
Huang, Q., Peng, Y., Li, X., Wang, H. and Zhang, Y. (2003). Purification and characterization of an extracellular alkaline serine protease with dehairing function from Bacillus pumilus. Curr. Microbiol, 46, 0169-0173.
Miyaji, T., Otta, Y., Nakagawa, T., Watanabe, T., Niimura, Y. and Tomizuka, N. (2006). Purification and molecular characterization of subtilisin‐like alkaline protease BPP‐A from
Bacillus pumilus strain MS‐1. Lett. Appl. Microbiol, 42, 242-247. 15.
16.
17.
18.
19.
20.
21.
22.
23.
24.
25.
26.
27.
.,
.,
.,
.,
.,