www.geosci-instrum-method-data-syst.net/5/219/2016/ doi:10.5194/gi-5-219-2016
© Author(s) 2016. CC Attribution 3.0 License.
A 7-year dataset for driving and evaluating snow models at an
Arctic site (Sodankylä, Finland)
Richard Essery1, Anna Kontu2, Juha Lemmetyinen3, Marie Dumont4, and Cécile B. Ménard5 1School of GeoSciences, University of Edinburgh, Edinburgh EH9 3FE, UK
2Arctic Research Unit, Finnish Meteorological Institute, 99600 Sodankylä, Finland 3Finnish Meteorological Institute, 00101 Helsinki, Finland
4Météo-France-CNRS, CNRM-GAME UMR3589, CEN, Grenoble 38000, France 5CORES Science and Engineering Ltd, Edinburgh, UK
Correspondence to:Richard Essery ([email protected])
Received: 7 December 2015 – Published in Geosci. Instrum. Method. Data Syst. Discuss.: 19 January 2016 Revised: 12 April 2016 – Accepted: 31 May 2016 – Published: 16 June 2016
Abstract. Datasets derived from measurements at So-dankylä, Finland, for driving and evaluating snow models are presented. This is the first time that such complete datasets have been made available for a site in the Arctic. The con-tinuous October 2007–September 2014 driving data com-prise all of the meteorological variables required as inputs for physically based snow models at hourly intervals: incom-ing solar and longwave radiation, snowfall and rainfall rates, air temperature, humidity, wind speed and atmospheric pres-sure. Two versions of the driving data are provided: one us-ing radiation and wind speed measurements made above the height of the trees around the clearing where the evaluation data were measured and one with adjustments for the influ-ence of the trees on conditions close to the ground. The avail-able evaluation data include automatic and manual measure-ments of bulk snow depth and snow water equivalent, and profiles of snow temperature, snow density and soil tempera-ture. A physically based snow model is driven and evaluated with the datasets to illustrate their utility. Shading by trees is found to extend the duration of both modelled and observed snow cover on the ground by several days a year.
1 Introduction
Many studies have used meteorological data to drive snow models and meteorological or hydrological data to evaluate model performance at instrumented sites. These studies have often only used limited periods of driving data (e.g. two
win-ters for several sites in Essery et al. (2009)) or limited eval-uation data (e.g. infrequent manual measurements of snow mass in Slater et al. (2001)). Recently, valuable datasets have been published with multiple years of driving data and mul-tiple sources of evaluation data for several snow research sites: Reynolds Mountain East in the Owyhee Mountains of Idaho (Reba et al., 2011), Col de Porte in the Chartreuse Mountains of France (Morin et al., 2012), the Senator Beck Basin in the San Juan Mountains of Colorado (Landry et al., 2014), Snoqualmie Pass in the Cascade Range of Washing-ton (Wayand et al., 2015) and Weissflujoch in the Plessur Alps of Switzerland (WSL, 2015). All of these are high-elevation, mid-latitude sites; there has been a lack of compa-rable datasets that could be used for evaluating snow models at high latitudes.
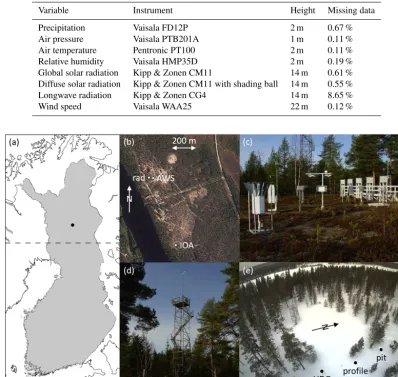
Table 1.Instruments and missing data for meteorological driving variables between 1 October 2007 and 30 September 2014.
Variable Instrument Height Missing data
Precipitation Vaisala FD12P 2 m 0.67 %
Air pressure Vaisala PTB201A 1 m 0.11 %
Air temperature Pentronic PT100 2 m 0.11 %
Relative humidity Vaisala HMP35D 2 m 0.19 %
Global solar radiation Kipp & Zonen CM11 14 m 0.61 %
Diffuse solar radiation Kipp & Zonen CM11 with shading ball 14 m 0.55 %
Longwave radiation Kipp & Zonen CG4 14 m 8.65 %
Wind speed Vaisala WAA25 22 m 0.12 %
Figure 1. (a)The location of FMI-ARC (dot), 90 km north of the Arctic Cirle (dashed line) in Finland.(b)Orthophotograph of the FMI-ARC site, showing the locations of the automatic weather station (AWS), the radiometer tower (rad) and the intensive observation area (IOA).(c)The automatic weather station, with the radiometer tower in the background.(d)The radiometer tower.(e)The IOA, showing the locations of the ultrasonic depth gauge (UDG), the snow temperature profile and the snow pit for manual measurements.
have to be somewhat shorter than a day (often 30 min or 1 h) if situations in which snow melts during the day and refreezes at night are to be explicitly represented.
This paper presents model-driving and evaluation datasets collated from measurements made at the Finnish Meteoro-logical Institute’s Arctic Research Centre (FMI-ARC) over the 7-year period starting on 1 October 2007. Descriptions are given of the site, instrumentation, gap filling used to con-struct a continuous driving dataset and adjustments of above-canopy measurements to allow for influences of shading by trees in below-canopy conditions. Comparisons of model simulations with evaluation data are presented as an illus-tration of data use and as a quality-control check on the data.
2 Site
2008 2009 2010 2011 2012 2013 2014 0 200 400 600 800 SW ra dia tio n (W m − 2)
2008 2009 2010 2011 2012 2013 2014
0 100 200 300 400 LW ra dia tio n (W m − 2)
2008 2009 2010 2011 2012 2013 2014
40 20 0 20 40 Te m pe ra tu re ( ◦C)
2008 2009 2010 2011 2012 2013 2014
0 20 40 60 80 100
Relative humidity (%)
2008 2009 2010 2011 2012 2013 2014
0 2 4 6 8 10 W ind sp ee d (m s − 1)
2008 2009 2010 2011 2012 2013 2014
940 960 980 1000 1020 1040 Pressure (hPa)
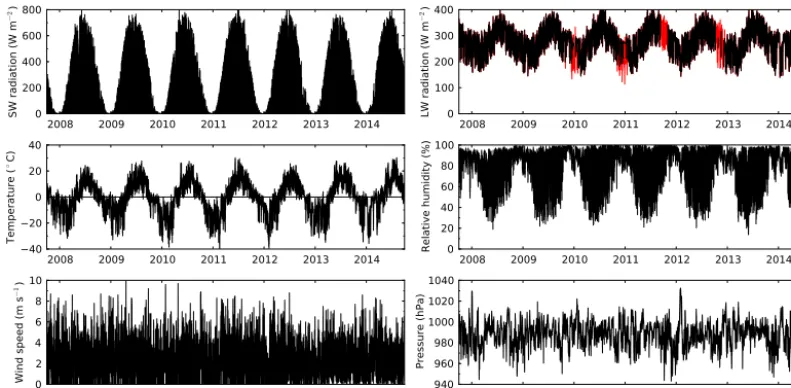
Figure 2.Hourly time series of shortwave radiation, longwave radiation, air temperature, relative humidity, wind speed and pressure. Long-wave radiation data points in red are from reanalyses.
Current instrumentation includes an automatic weather sta-tion (AWS) and an upper-air sounding stasta-tion (World Mete-orological Organization index number 02836) which trans-mit data on the Global Telecommunication System for use by numerical weather prediction centres. In addition to reg-ular measurement programmes, the Sodankylä area has been used in many remote-sensing missions and field campaigns, including the Nordic Snow Radar Experiment (NoSREx), the Snow Reflectance Transition Experiment (SnoRTEx) and the Solid Precipitation Intercomparison Experiment (SPICE).
Figure 1b is an aerial orthophotograph of the site. The area around FMI-ARC is level and forested, predominantly with pine trees about 15 m tall, but many measurements are made in clearings or in a large wetland area to the east of the site. Driving data for this paper are taken from an au-tomatic weather station (Fig. 1c) and a radiometer tower (Fig. 1d) 30 m apart, with instruments that are calibrated an-nually. Evaluation data are taken from an intensive obser-vation area (IOA) (Fig. 1e) that was established 590 m to the south of the weather station for NoSREx (Lemmetyi-nen et al., 2016). A list of many other observations not dis-cussed in this paper and contact information can be found at http://litdb.fmi.fi/index.php.
3 Driving data and gap filling
All of the meteorological variables necessary for model driv-ing are measured by the AWS and the radiometer tower at FMI-ARC with the instruments and at the heights listed in Table 1; note that radiation and wind measurements are made at heights above the forest canopy. The radiometers are ven-tilated, the anemometer is heated to reduce problems with freezing or snow accumulation and instruments are cleaned
after every snowfall or at least three times a week. Temper-ature and humidity sensors are naturally ventilated inside a Stevenson screen. Precipitation is measured using an opti-cal sensor and two weighing gauges which give similar total amounts; data from the optical sensor are used here. There is no nearby wind speed measurement that could be used for gauge correction, but wind speeds are generally low, and measured snowfall has been adjusted to match snow accumu-lation on the ground as described below. FMI-ARC is staffed 5 days a week, and automatic error checking can identify in-strument problems immediately. For the 7-year period col-lated here, fewer than 1 % of hourly data (visible as red points in Fig. 2) are missing for any variable with the exception of longwave radiation; the longest period of missing data is a 52-day gap in the longwave radiation measurements from 10 September to 31 October 2011 because of a faulty power sup-ply. The archived driving data files include a flag that records which data were missing and had to be filled for each hour.
Table 2. Scaling factors required to match measured snowfall to measured snow accumulation
Winter Factor
2007–2008 1.373
2008–2009 1.165
2009–2010 1.131
2010–2011 0.922
2011–2012 1.093
2012–2013 0.971
2013–2014 1.092
in situ measurements; the longwave radiation measurements and forecasts have a correlation coefficient of 0.88 and a root mean square difference of 26.2 W m−2 after removal of a 5.1 W m−2bias for periods when both are available (a scatter plot is included as the Supplement). Direct measurements of longwave radiation are rarely available for cold regions, and snow models are known to be sensitive to longwave driving data (Raleigh et al., 2016); having near-continuous longwave measurements is therefore a distinct advantage of the FMI-ARC site.
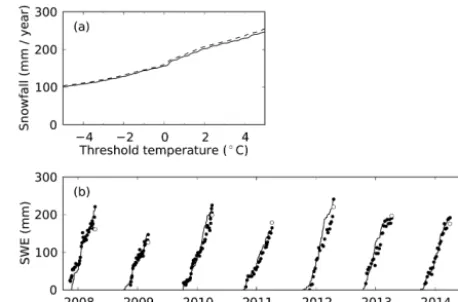
Seven-year series of gap-filled hourly data are shown in Fig. 2 for all of the driving variables apart from precipita-tion. Measuring solid precipitation is particularly challeng-ing, and uncertainties in snowfall inputs are a major source of uncertainty in snow model outputs (Raleigh et al., 2015). Total precipitation is usually measured but has to be parti-tioned into snow and rain for mass balance calculations, ei-ther in the driving data or by the model. This is usually done by selecting a threshold or function of air temperature or wet-bulb temperature discriminating between rain and snow (Auer, 1974; Sims and Liu, 2015). Figure 3a shows the an-nual average snowfall partitioned from total precipitation for Sodankylä with varying temperature or wet-bulb temperature thresholds; the snowfall is not very sensitive to the choice of temperature or wet-bulb temperature as a predictor because humidity is usually high during precipitation, but it is sensi-tive to the choice of threshold because a significant amount of precipitation falls at temperatures close to 0◦C. With precip-itation classified as snow for temperatures lower than 2◦C, Fig. 3b shows that the cumulated amount of snowfall is less than the maximum observed snow water equivalent (SWE) on the ground in most winters but slightly greater in 2010– 2011 and 2012–2013. Because the site is cold and little melt-ing of snow occurs in autumn or winter, the cumulated snow-fall should be close to the amount of snow on the ground at points that are not affected by canopy interception or wind re-distribution. Snowfall data are therefore scaled by the factors required to match the maximum measured SWE each winter (Table 2); cumulated snowfall then also matches the rate of accumulation on the ground quite well, as shown in Fig. 3b.
The snow measurement points in the IOA (Fig. 2e) are not directly beneath trees, so snow accumulation there will
Figure 3. (a)Average annual snowfall derived from total precipita-tion with varying temperature (solid line) or wet-bulb temperature (dashed line) thresholds.(b)SWE on the ground from manual ob-servations up to the maximum each winter (black dots), cumulated snowfall up to the date of maximum SWE (white dots) and snowfall scaled to the annual maxima (black lines).
not be greatly affected by canopy interception, but they are shaded from direct solar radiation by nearby trees. The pres-ence of the trees will also increase the incoming longwave radiation and decrease the wind speed near the ground rela-tive to more open locations. Measurements above the forest canopy height do not take these influences into account. To allow the use of snow models without representations of for-est canopies, radiation fluxes and wind speed are adjusted in a modified driving dataset. From the hemispherical image of the canopy at the IOA in Fig. 4a, the sky view fraction is es-timated asfv= 0.8 and a transmissivityτ for direct solar
ra-diation is calculated by determining the fraction of each hour for which the sun would be blocked by the canopy. Modified solar radiation is given by
SW0=fvSWdif+τ (SW−SWdif), (1) where SW and SWdifare the measured incoming global and diffuse solar radiation (Reid et al., 2014). Longwave radia-tion is modified by assuming that the canopy temperature can be approximated by the air temperature (Essery et al., 2008; Pomeroy et al., 2009) so that
LW0=fvLW+(1−fv)σ T4, (2)
where LW is the measured incoming longwave radiation, σ=5.67×10⁻⁸W m−2K−4 is the Stefan–Boltzmann con-stant andT is the air temperature in kelvin. The resulting decreases in solar radiation and increases in longwave radia-tion are shown in Fig. 4b. Solar and longwave radiaradia-tion will both be underestimated by these modifications close to tree trunks at the sun-lit northern edge of the IOA clearing where the snow is observed to melt first.
(a)
0 10 20 30 40
Measured radiation (MJ m−2 day−1)
0 10 20 30 40
Mo
dif
ied
ra
dia
tio
n
(M
J m
−
2 d
ay
−
1)
(b)
Figure 4.(a) A hemispherical photograph taken close to the IOA snow depth sensor in August 2011, showing the track of the sun (grey lines) on the first days of February, March, April and May. (b) Measured above-canopy and modified below-canopy daily solar (blue points) and longwave (red points) radiation.
recorded an average wind speed that was 35 % of the wind speed at 22 m height (equal to the ratio given by a logarith-mic wind profile with a roughness length of 0.55 m). This ratio is used to scale the wind speed in the modified driving dataset. There is no permanently installed anemometer be-low the canopy height at the IOA, so the wind adjustment is highly uncertain. Because the wind is rarely strong enough to move snow in the IOA and snowmelt is dominated by ra-diation in spring, however, it is expected that models will not be highly sensitive to the wind adjustment.
4 Evaluation data
Physically based snow models may include snow tempera-ture, mass, density, liquid water content and grain size in layers as state variables. Predicted fluxes will include re-flected shortwave radiation, emitted longwave radiation, sen-sible and latent heat exchanges with the atmosphere, and conducted heat flux and drainage of water at the base of the snowpack. Snow properties that have to be predicted include albedo and thermal conductivity. Measurements of any state variable, flux or property may be used as evaluation data for models, and the measurements need not be continuous; mea-sured and modelled variables can be compared at whatever times for which measurements are available.
FMI-ARC data that will be used in the model evaluation below are listed in Table 3. Again, many more measurements are made in the IOA in addition to those discussed here, including snow grain size, hardness, wetness, microwave brightness temperatures and soil moisture. The microstruc-ture of snow samples taken during special experiments has been measured in great detail by X-ray-computed tomogra-phy (Proksch et al., 2015). Outgoing radiative and turbulent flux measurements are made above the canopy height at FMI-ARC, so they would be most useful for evaluating models that include vegetation canopies.
2008 2009 2010 2011 2012 2013 2014
0 20 40 60 80 100
Snow depth (cm)
2008 2009 2010 2011 2012 2013 2014
0 100 200 300
SWE (mm)
Figure 5.Measured snow depth and SWE from manual measure-ments (dots) and automatic instrumeasure-ments (lines). Daily averages of the automatic SWE measurements are used to reduce noise.
O N D J F M A M J
0 20
4060
80 100
Snow depth (cm)
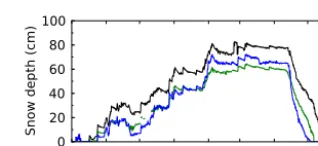
Figure 6.Snow depths measured in the IOA (black line), in the forest (green line) and on the wetland (blue line) for the winter of 2012–2013.
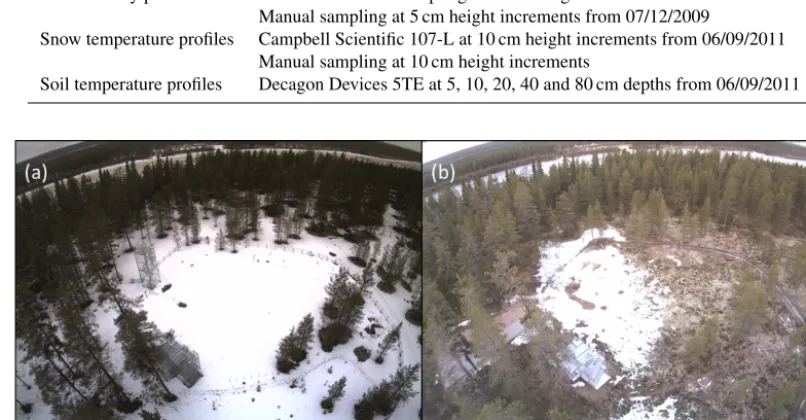
Snow depth and SWE are measured in the IOA both manu-ally about once a week and many times daily with automatic instruments. These measurements are compared in Fig. 5. The output of the experimental SWE sensor, which works by measuring the attenuation of gamma radiation from a source beneath the snow, is noisy but tracks the manual measure-ments well after calibration and averaging. Snow accumu-lation varies spatially. Figure 6 compares the snow depth in the IOA for the winter of 2012–2013 with snow depths mea-sured in the forest beside the IOA and 900 m to the northeast on the wetland. The snow was deepest throughout the winter and melted latest in the IOA. Some snow is intercepted by the forest canopy as it falls and can sublimate, reducing the depth of snow on the forest floor. Wind can remove and com-pact snow in the open wetland area, again reducing the snow depth. Differences in snow accumulation and melt rates lead to differences in the persistence of snow cover at different sites; the measured snow depth fell to zero on 3 May 2013 on the wetland, 6 May in the forest and 13 May in the IOA. Photographs of the IOA in Fig. 7 show small-scale variations in cover as the snow melts. Bare patches first appear around the bases of trees, and the snow lies longest at the shady side of the clearing.
inter-Table 3.Evaluation data from the IOA.
Variable Instrument
Snow depth Campbell Scientific SR50
Manual sampling
Snow water equivalent Astrock Gamma Water Instrument Manual sampling
Snow density profiles Toikka Snow Fork sampling at 10 cm height increments from 09/10/2009 Manual sampling at 5 cm height increments from 07/12/2009
Snow temperature profiles Campbell Scientific 107-L at 10 cm height increments from 06/09/2011 Manual sampling at 10 cm height increments
Soil temperature profiles Decagon Devices 5TE at 5, 10, 20, 40 and 80 cm depths from 06/09/2011
Figure 7.Snow melting in the IOA at noon on(a)1 May and(b)13 May 2013.
mittently by inserting a stem thermometer into the snow face when pits are dug. Both methods are subject to biases; it has been observed that the thermistor stick interferes with the ac-cumulation of snow and can form a depression up to 30 cm deep in the snow surface, and digging a snow pit brings air into contact with snow beneath the surface. Density is mea-sured by weighing 250 or 500 cm3snow samples cut from snow pits (Leppänen et al., 2016) and also by a dielectric method that relates density and wetness to the measured per-mittivity of snow (Sihvola and Tiuri, 1986). The dielectric method generally gives lower densities than gravimetric sam-pling of snow at Sodankylä.
5 Model results
Preliminary versions of the driving and evaluation datasets were used in a study with the Joint UK Land Environment Simulator (JULES) land surface model by Ménard et al. (2015). The above-canopy and modified driving datasets are used here to drive Crocus (Vionnet et al., 2012), which is a detailed multi-layer snowpack model originally developed for avalanche forecasting in the French mountains. Although physically based, some of the processes in Crocus have been parametrized using experimental results from the mid-latitude site at Col de Porte (45.3◦N, 5.8◦E, 1325 m a.s.l.),
which is much warmer than Sodankylä in winter and has heavier snowfall.
2008 2009 2010 2011 2012 2013 2014 0
20 40 60 80 100
Snow depth (cm)
2008 2009 2010 2011 2012 2013 2014
0 100 200 300
SWE (mm)
2008 2009 2010 2011 2012 2013 2014
42
0 2 4
So
il t
em
pe
ra
tu
re
(
◦C)
Figure 8.Crocus simulations with the above-canopy (red lines) and below-canopy (blue lines) driving datasets, compared with mea-surements (black dots and lines) of snow depth, SWE and soil tem-perature at 10 cm depth. For clarity, only manual measurements of snow depth and SWE are shown.
close to 0◦C once the snowpack has become established. Measured soil temperatures also show a strong influence of insulation by snow but can fall a couple of degrees lower than the simulations in late winter.
The frequent snow pit measurements in the IOA and the multi-layer outputs of Crocus give a large amount of data for comparison. Profiles of temperature and density for 140 snow pits dug between 7 December 2009 and 14 May 2014 are plotted in the Supplement, but the evolution of the snow-pack over the winter of 2012–2013 alone is shown in Fig. 9. Snow pits were dug once a week, usually on Tuesday but sometimes on Wednesday or Thursday, for the 28 weeks between 31 October 2012 and 7 May 2013. Simulations and measurements both show temperatures remaining close to 0◦C at the base of the snowpack with periods of much colder temperatures in snow layers close to the surface. The snow then rapidly warms and becomes wet and isothermal at 0◦C when melt begins in spring. Density generally increases with depth in the snowpack and with time, again increasing rapidly once the snow becomes wet.
Quantitative comparisons between simulated and mea-sured profiles of snow properties are complicated by differ-ences in simulated and measured snow depths. Simply mak-ing scatter plots (Fig. 10) of variables at the same heights above the ground and at the same times shows strong corre-lations of 0.80 between simulated and measured snow tem-peratures and 0.74 for densities. The simulated temtem-peratures tend to be higher than observed for the warmer temperatures found near the base of the snowpack.
Figure 9. Profiles of snow temperature and density from Cro-cus simulations (background colours) and snow pit measurements (coloured dots) for the winter of 2012–2013. Dotted lines show the measured snow depth.
30
20
10
0
Measured temperature (
◦C)
30
20
10
0
Mo
de
l t
em
pe
ra
tu
re
(
◦
C)
0 100 200 300 400 500
Measured density (kg m
−3)
0
100
200
300
400
500
Mo
de
l d
en
sit
y (
kg
m
−
3
)
6 Conclusions
Data from the FMI Arctic Research Centre at Sodankylä have been used to construct datasets that will allow driv-ing of snow models for multiple years and evaluation of model outputs against multiple types of observations. There are some gaps in the data, but the availability of addi-tional instruments and high-quality atmospheric reanaly-ses give confidence in the filling of gaps to provide con-tinuous driving data. The utility of the datasets has been demonstrated by driving the Crocus snow model and eval-uating its outputs against snow depth, SWE, snow den-sity, snow temperature and soil temperature measurements. The physical basis of the model allows it to perform well in an Arctic environment very different to the mid-latitude mountain environments for which it was first developed. It is intended that Sodankylä will be used as a reference site in an upcoming evaluation of snow simulations in Earth System models (http://www.climate-cryosphere.org/ activities/targeted/esm-snowmip). Under the open-data pol-icy of the Finnish Ministry of Transport and Communica-tions, FMI is committed to the long-term upkeep and public distribution of its data; the datasets used in this paper can be downloaded from the FMI litdb archive at http://litdb.fmi.fi/ ESMSnowMIP.php.
The Supplement related to this article is available online at doi:10.5194/gi-5-219-2016-supplement.
Acknowledgements. The staff at FMI-ARC are thanked for data collection and maintenance of instruments. Collection of eval-uation data in the IOA was supported by ESA ESTEC contract 22671/09/NL/JA/ef. Visits to FMI-ARC by the first author were supported by NERC grant NE/H008187/1 and ESA ESTEC contract 23103/09/NL/JC. Samuel Morin and Matthieu Lafaysse assisted with the Crocus simulations. The orthophotograph in Fig. 1b was supplied by the Finnish Geospatial Research Institute. We are grateful to Charles Fierz and Mark Raleigh for their helpful comments in reviewing this paper.
Edited by: J. Pulliainen
References
Auer, A. H.: The rain versus snow threshold temperatures, Weath-erwise, 27, 6p. 7, 1974.
Dee, D. P.,Uppala, S. M., Simmons, A. J., Berrisford, P., Poli, P., Kobayashi, S., Andrae, U., Balmaseda, M. A., Balsamo, G., Bauer, P., Bechtold, P., Beljaars, A. C. M., van de Berg, L., Bid-lot, J., Bormann, N., Delsol, C., Dragani, R., Fuentes, M., Geer, A. J. Haimberger„ L., Healy, S. B., Hersbach, H., Hólm, E. V., Isaksen, L., Kallberg, P., Köhler, M., Matricardi, M., McNally,
A. P., Monge-Sanz, B. M., Morcrette, J.-J., Park, B.-K., Peubey, C., de Rosnay, P., Tavolato, C., Thépaut, J.-N., and Vitart, F.: The ERA-Interim reanalysis: configuration and performance of the data assimilation system, Q. J. R. Meteorol. Soc., 137, 553–597, doi:10.1002/qj.828, 2011.
Essery, R. L. H., Pomeroy, J., Ellis, C., and Link, T.: Modelling longwave radiation to snow beneath forest canopies using hemi-spherical photography or linear regression, Hydrol. Process., 22, 2788–2800, 2008.
Essery, R., Rutter, N., Pomeroy, J., Baxter, R., Stähli, M., Gustafs-son, D., Barr, A., Bartlett, P., and Elder, K.: SnowMIP2: An eval-uation of forest snow process simulations, B. Am. Meteor. Soc., 90, 1120–1135, doi:10.1175/2009BAMS2629.1, 2009.
Kangas, M., Rontu, L., Fortelius, C., Aurela, M., and Poikonen, A.: Weather model verification using Sodankylä mast measurements, Geosci. Instrum. Method. Data Syst., 5, 75–84, doi:10.5194/gi-5-75-2016, 2016.
Kivi, R., Kyrö, E., Turunen, T., Ulich, T., and Turunen, E.: Atmo-spheric trends above Finland. Part II. Troposphere and strato-sphere, Geophysica, 35, 71–85, 1999.
Landry, C. C., Buck, K. A., Raleigh, M. S., and Clark, M. P.: tain system monitoring at Senator Beck Basin, San Juan Moun-tains, Colorado: A new integrative data source to develop and evaluate models of snow and hydrologic processes, Water Re-sour. Res., 50, 1773–1788, doi:10.1002/2013WR013711, 2014. Lemmetyinen, J., Kontu, A., Pulliainen, J., Vehviläinen, J.,
Rauti-ainen, K., Wiesmann, A., Mätzler, C., Werner, C., Rott, H., Na-gler, T., Schneebeli, M., Proksch, M., Schüttemeyer, D., Kern, M., and Davidson, M.: Nordic Snow Radar Experiment, Geosci. Instrum. Method. Data Syst. Discuss., doi:10.5194/gi-2015-29, in review, 2016.
Leppänen, L., Kontu, A., Hannula, H.-R., Sjöblom, H., and Pulli-ainen, J.: Sodankylä manual snow survey program, Geosci. In-strum. Method. Data Syst., 5, 163–179, doi:10.5194/gi-5-163-2016, 2016.
Ménard, C. B., Ikonen, J., Rautiainen, K., Aurela, M., A. N. Ar-slan and J. Pulliainen: Effects of meteorological and ancillary data, temporal averaging, and evaluation methods on model per-formance and uncertainty in a land surface model, J. Hydrome-teorol., 16, 2559–2576, doi:10.1175/JHM-D-15-0013.1, 2015. Morin, S., Lejeune, Y., Lesaffre, B., Panel, J.-M., Poncet, D., David,
P., and Sudul, M.: An 18-yr long (1993–2011) snow and meteo-rological dataset from a mid-altitude mountain site (Col de Porte, France, 1325 m alt.) for driving and evaluating snowpack mod-els, Earth Syst. Sci. Data, 4, 13–21, doi:10.5194/essd-4-13-2012, 2012.
Pomeroy, J. W., Marks, D., Link, T., Ellis, C., Hardy, J., Rowlands, A., and Granger, R.: The impact of coniferous forest temperature on incoming longwave radiation to melting snow Hydrol. Pro-cess., 23, 2513–2525, doi:10.1002/hyp.7325, 2009.
Proksch, M., Löwe, H., and Schneebeli, M.: Density, specific sur-face area, and correlation length of snow measured by high-resolution penetrometry, J. Geophys. Res. Earth Surf., 120, 346– 362, doi:10.1002/2014JF003266, 2015.
Raleigh, M. S., Livneh, B., Lapo, K., and Lundquist, J. D.: How does availability of meteorological forcing data impact physically-based snowpack simulations?, J. Hydrometeorol., 17, 99–120, doi:10.1175/JHM-D-14-0235.1, 2016.
Rautiainen, K., Lemmetyinen, J., Schwank, M., Kontu, A., Ménard, C. B., Mätzler, C., Drusch, M., Wiesmann, A., Ikonen, J., and Pulliainen, J.: Detection of soil freezing from L-band passive microwave observations, Remote Sens. Environ., 147, 206–218, doi:10.1016/j.rse.2014.03.007, 2014.
Reba, M. L., Marks, D., Seyfried, M., Winstral, A., Kumar, M., and Flerchinger, G.: A long-term data set for hydrologic modeling in a snow-dominated mountain catchment, Water Resour. Res., 47, W07702, doi:10.1029/2010WR010030, 2011.
Reid, T. D., Essery, R. L. H., Rutter, N., and King, M.: Data-driven modelling of shortwave radiation transfer to snow through bo-real birch and conifer canopies, Hydrol. Process., 28, 2987–3007, doi:10.1002/hyp.9849, 2014.
Sihvola, A. and Tiuri, M.: Snow Fork for field determination of the density and wetness profiles of a snow pack, IEEE Trans. Geosci. Remote Sens., 5, 717–721, 1986.
Sims, E. M. and Liu, G.: A Parameterization of the probabil-ity of snow-rain transition, J. Hydrometeorol., 16, 1466–1477, doi:10.1175/JHM-D-14-0211.1, 2015.
Slater, A. G. and 32 others: The representation of snow in land sur-face schemes: results from PILPS 2(d), J. Hydrometeorol., 2, 7– 25, 2001.
Vionnet, V., Brun, E., Morin, S., Boone, A., Faroux, S., Le Moigne, P., Martin, E., and Willemet, J.-M.: The detailed snowpack scheme Crocus and its implementation in SURFEX v7.2, Geosci. Model Dev., 5, 773–791, doi:10.5194/gmd-5-773-2012, 2012. Wayand, N. E., Massmann, A., Butler, C., Keenan, E.,
Stim-beris, J., and Lundquist, J. D.: A meteorological and snow observational data set from Snoqualmie Pass (921 m), Wash-ington Cascades, USA, Water Resour. Res., 51, 10092–10103, doi:10.1002/2015WR017773, 2015.