I
I
M
M
P
P
R
R
O
O
V
V
E
E
D
D
B
B
A
A
Y
Y
E
E
S
S
I
I
A
A
N
N
F
F
E
E
A
A
T
T
U
U
R
R
E
E
S
S
E
E
L
L
E
E
C
C
T
T
I
I
O
O
N
N
A
A
N
N
D
D
C
C
L
L
A
A
S
S
S
S
I
I
F
F
I
I
C
C
A
A
T
T
I
I
O
O
N
N
M
M
E
E
T
T
H
H
O
O
D
D
S
S
U
U
S
S
I
I
N
N
G
G
B
B
O
O
O
O
T
T
S
S
T
T
R
R
A
A
P
P
P
P
R
R
I
I
O
O
R
R
T
T
E
E
C
C
H
H
N
N
I
I
Q
Q
U
U
E
E
S
S
O
O
.
.
R
R
.
.
O
O
l
l
a
a
n
n
i
i
r
r
a
a
n
n
11,
,
S
S
.
.
F
F
.
.
O
O
l
l
a
a
n
n
i
i
r
r
a
a
n
n
22,
,
W
W
.
.
B
B
.
.
Y
Y
a
a
h
h
y
y
a
a
11,
,
A
A
.
.
W
W
.
.
B
B
a
a
n
n
j
j
o
o
k
k
o
o
11,
,
M
M
.
.
K
K
.
.
G
G
a
a
r
r
b
b
a
a
11,
,
L
L
.
.
B
B
.
.
A
A
m
m
u
u
s
s
a
a
11,
,
N
N
.
.
F
F
.
.
G
G
a
a
t
t
t
t
a
a
111
Department of Statistics, University of Ilorin, PMB 1515, Ilorin, Nigeria
2
Department of Statistics and Mathematical Sciences, Kwara State University, Malete, P.M.B 1530, Ilorin, Nigeria
Corresponding author: O. R. Olaniran, [email protected]; [email protected]
ABSTRACT: In this paper, the behavior of feature
selection algorithms using the traditional t-test, Bayesian t-test using MCMC and Bayesian two-sample test using proposed bootstrap prior technique were determined. In addition, we considered some frequentist classification methods like k- Nearest Neighbor (k-NN), Logistic Discriminant (LD), Linear discriminant analysis (LDA), Quadratic discriminant analysis (QDA) and Naïve Bayes when conditional independence assumption is violated. Two new Bayesian classifiers (B-LDA and B-QDA) were developed within the frame work of LDA and QDA using the bootstrap prior technique. The model parameters were estimated using Bayesian approach via the posterior distribution that involves normalizing the prior for the attributes and the likelihood from the sample in a Monte-Carlo experiment. The bootstrap prior technique was incorporated into the Normal-Inverse-Wishart natural conjugate prior for the parameters of the multivariate normal distribution where the scale and location parameters were required. All the classifiers were implemented on the simulated data at 90:10 training-test data ratio. The efficiencies of these classifiers were assessed using the misclassification error rate, sensitivity, specificity, positive predictive value, negative predictive value and area under the ROC curve. Results from various analyses established the supremacy of the proposed Bayes classifiers (B-LDA and B-QDA) over the existing frequentists and Naïve Bayes classification methods considered. All these methods including the proposed one were implemented on a published binary response microarray data set to validate the results from the simulation study.
KEYWORDS: k-Nearest Neighbour, Bayesian Linear
Discriminant Analysis, Bayesian Quadratic Discriminant Analysis, Naïve Bayes, Bootstrap prior.
1. INTRODUCTION
Simultaneous feature selection and classification are two main problems in data mining. The two problems are related in the sense that, when good features are identified the classification scheme or method often yields high accuracy. This implies the performance of a feature selection algorithm can be assessed using the accuracy of resulting
classification method that utilizes the identified subset features. Several studies have considered various feature selection algorithm or classifiers (classification method) that simultaneously select and classify clinical or non-clinical classification problems. In the recent time, Yahya ([Yah12]) considered feature selection algorithm using AUC (Area under the ROC Curve).
In this paper, we proposed a novel feature selection algorithm and two classification methods under the frame work of Bayesian discriminant analysis. 2. FEATURE SELECTION
Feature selection process is the removal of features that are irrelevant with respect to the output variable from the data set. Feature selection can be extremely useful in reducing the dimensionality of the data to be processed by the classifier, reducing execution time and improving predictive accuracy (inclusion of irrelevant features can introduce noise into the data, thus obscuring relevant features). Many feature selection methods have been proposed from the Bayesian and frequentist perspectives. Within the frequentist; p-value method (Golub [G+99]), Wilcoxon-Mann-Whitney rank sum test (Thomas [T+01]), the student-t test or its equivalent; the welch test (Nguyen & Rocke [NR02], Yahya et al. [Y+11]). Similarly within Bayesian; Cyber-T a Bayesian version of t statistic by (Baldi and Long [BL01]), among other methods based on t or ANOVA are ([WS03]), ([N+01]), ([Smy04]).
3. CLASSIFICATION
from the Bayesian and frequentist perspective with distinction only in the incorporation of prior information to the information observed from the data. Some frequentist classification methods are Logistic Discriminant (LD), k-Nearest Neighbour (k-NN), Support Vector Machine (SVM) and Artificial Neural Network (ANN) ([D+02]; [SS05]; [Vap98]). Bayesian classifiers are, Linear and Quadratic Discriminant Analysis (LDA & QDA), Bayesian Network ([H+13]; [Bar12]).
4. METHODOLOGY
4.1. The proposed feature selection algorithm
We considered two class problem with
where each feature can be partition into two namely and . Often, within two samples testing paradigm assumption of independency and normality are required, that is,
The quantity really of interest is the posterior distribution of
.
The hypothesis of interest under this scenario might be of the form
against (1) Testing the above hypotheses in (1) using the Bayesian method requires computing define as the posterior distribution of given data D ([Lee12]). To achieve this, we can estimate the posterior distribution of the parameters and separately using conjugate prior technique. The conjugate Bayes estimation procedure for estimating parameters and of a normal random sample requires estimation of the posterior distribution of and given The posterior density following Bayes theorem is;
(2) Bolstad ([Bol04]), Murphy ([Mur07[) and Lesaffre & Lawson ([LL13]) among others used the Normal-Gamma; natural conjugate prior for and given as;
(3) The posterior distribution is of the form
. Where, ;
; and
Thus the Bayes estimate of is;
(4) Similarly, the Bayes estimate of is determined by;
(5) The empirical Bayes version of the above estimate involves estimating the prior parameters
from the data. Thus the empirical Bayes estimate of and are;
(6) and,
(7) The proposed bootstrap Bayesian version of the estimate of and involves the following steps; 1. Generation of bootstrap samples from the
original data desired times,
2. Estimating the hyperparameters (prior
parameters) each time the samples are generated using Maximum Likelihood (ML) method, 3. Updating the posterior estimates using the
hyperparameters in step (2) above using (8 & 9) and
4. Then obtaining the proposed bootstrap empirical Bayesian estimates and using;
(9)
Now fixing and , where is
the jth ML estimate based on jth bootstrap sample drawn. That is,
Then,
However, it can be show that the limiting form of as is 0, this justifies the efficiency of the estimator over ML estimator. The Bootstrap samples of represent the posterior distribution of Now moving to the two sample
problem, , where
and is the posterior distribution of from class and respectively using the proposed bootstrap prior technique. Following central limit, the posterior distribution of approaches normal distribution with mean and variance .Thus, the posterior probability of the null hypothesis can then be estimated using
(10) If the probability is less than chosen significance level α, we reject the null hypothesis and can conclude that holds. The best subsets are those features with smallest when compared with a threshold value α. Furthermore, to correct for family wise error rate which often arise in multiple testing, the sidak (Abdi [Abd07]) method was adopted. The sidak method redefine the threshold α
as .
4.2. The proposed classification methods
Classification involves classifying an observation into one of C classes, where C ≥ 2. Let represent the overall or prior probability that a randomly chosen observation comes from the Cth class; also
let denote the
density function of X for an observation that comes
from the Cth class. In other words, is relatively large if there is a high probability that an observation in the Cth class has , and is small if it is very unlikely that an observation in the Cth class has . Then Bayes’ theorem states that;
(11) One can simply plug in estimates of and into (11). In general, estimating is easy if we have a random sample of Ys from the population: we simply compute the fraction of the training observations that belong to the cth class. However, estimating tends to be more challenging, unless we assume some simple forms for these densities. We refer to as the posterior probability that an observation posterior belongs to the cth class. That is, it is the probability that the observation belongs to the cth class, given the predictor value for that observation. As earlier defined, the Bayes classifier, classifies an observation to the class for which is largest, has the lowest possible error rate out of all classifiers. (This is of course only true if the terms in (11) are all correctly specified.) Therefore, if we can find a way to estimate , then we can develop a classifier that approximates the Bayes classifier. Such an approach is the Linear Discriminant Analysis (LDA) and Quadratic Discriminant Analysis (QDA). Hastie et al. [H+13] derived the LDA and QDA based on the assumption that follows the multivariate normal density function with density function given below as;
(12) In the case of predictors, the LDA classifier assumes that the observations in the cth class are drawn from a multivariate Gaussian distribution N( , Σ), where is a class-specific mean vector, and Σ is a covariance matrix that is common to all C classes. Plugging the density function for the cth class, , into (11) and performing a little bit of algebra reveals that the Bayes classifier assigns an observation to the class for which
(13) is largest.
on Maximum likelihood a frequentist approach are given below.
Where is the pooled variance covariance matrix of all the class and is the variance covariance matrix of each class. LDA plugs these estimates into (13) and classifies to the class for which is largest. Note that in (13) is a linear function of x; that is, the LDA decision rule depends on x only through a linear combination of its elements. This is the reason for the word linear in LDA (Hastie et al. [H+13]). In the same manner, if the equality of variance assumption is not satisfied then individual variance covariance matrix will be used instead of the pooled variance covariance matrix. Then (13) above can be modified to yield;
(14) The decision rule based on (14) is referred to as Quadratic Discriminant analysis (QDA).
The bootstrap Bayes LDA Classifier proposed here make use of the estimates derived in (8) and (9) above with their respective formulas given below; Substituting the bootstrap bayes estimates leads to;
(15) Again, the bootstrap bayes assign to the class for which is the largest. The above formulation is the proposed bootstrap bayes denoted as B-LDA. Modifying for unequal class variance with c leads to;
(16) Which we refer to as our proposed bootstrap bayes denoted as B-QDA.
5. SIMULATION STUDY AND ANALYSIS
To implement our newly proposed feature selection procedure and classifiers (LDA and B-QDA), we intend to simulate typical microarray data set with i.e (the number of genes are strictly greater than the sample sizes) on which the procedure would be tested to ascertain its suitability and results’ efficiencies. The performance of our method relative to some of the existing feature selection and classification methods shall be equally assessed using such simulated data. We consider two other methods under feature selection (Bayesian MCMC and Welch t - statistic). Similarly under classification, we consider Naïve bayes, LDA, QDA, K-NN and LD. The procedure we employed for simulating microarray data set here follows the method of Yahya ([Yah12]) with little modifications. We simulated observations representing the number of patients samples with two distinct biological groups (normal patients) and (diseased/tumour patients). On each
observation, 1000 covariates,
, representing the observed gene expression profiles were simulated. The datasets were simulated from multivariate normal distribution with mean and variance-covariance matrix Σ. Of 1000 genes simulated on group 1 subjects, 5 of them were simulated from the mixture of two multivariate normal densities with the same covariance matrix Σ, and means and . The pdf of the dataset used can be written as;
, where
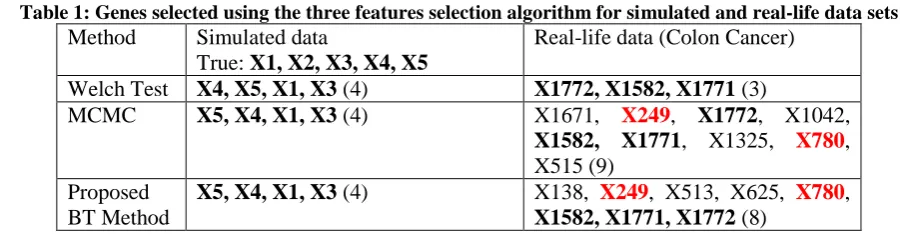
Table 1: Genes selected using the three features selection algorithm for simulated and real-life data sets Method Simulated data
True: X1, X2, X3, X4, X5
Real-life data (Colon Cancer) Welch Test X4, X5, X1, X3 (4) X1772, X1582, X1771 (3)
MCMC X5, X4, X1, X3 (4) X1671, X249, X1772, X1042,
X1582, X1771, X1325, X780, X515 (9)
Proposed BT Method
X5, X4, X1, X3 (4) X138, X249, X513, X625, X780, X1582, X1771, X1772 (8)
Table 2: Classification Performance (%) of the feature selection methods and classifiers for simulated data set with proportion of test set fixed at 0.1
Performance using Welch t-test for feature selection with (4) genes selected ASSESMENT
CRITERIA
CLASSIFIERS
NAIVE LDA B-LDA QDA B-QDA LD K-NN
MER 4.12 0.00 0.00 0.00 0.00 0.00 0.00
CCR 95.88 100.00 100.00 100.00 100.00 100.00 100.00
SENS 89.66 100.00 100.00 100.00 100.00 100.00 100.00
SPECS 100.00 100.00 100.00 100.00 100.00 100.00 100.00
PPV 100.00 100.00 100.00 100.00 100.00 100.00 100.00
NPV 94.94 100.00 100.00 100.00 100.00 100.00 100.00
Table 3: Classification Performance (%) of the feature selection methods and classifiers for colon cancer data set with proportion of test set fixed at 0.1
Performance using Welch t-test for feature selection with (3) genes selected ASSESMENT
CRITERIA
CLASSIFIERS
NAIVE LDA B-LDA QDA B-QDA LD K-NN
MER 20.25 28.12 26.98 49.65 48.73 26.52 22.40
CCR 79.75 71.88 73.03 50.35 51.27 73.47 77.60
SENS 68.78 78.42 79.07 68.83 98.05 77.92 82.92
SPECS 90.71 65.38 66.98 90.61 4.50 69.08 72.28
PPV 91.17 73.79 74.78 50.20 50.88 76.35 79.56
NPV 78.46 79.65 80.44 59.40 70.25 80.01 85.07
Performance using proposed BT method for feature selection with (8) genes selected CLASSIFIERS
ASSESMENT CRITERIA
NAIVE LDA B-LDA QDA B-QDA LD K-NN
MER 22.12 17.48 16.27 28.30 33.17 19.05 19.93
CCR 77.88 82.53 83.72 71.70 66.83 80.95 80.08
SENS 65.18 93.36 93.31 65.23 96.25 88.91 90.86
SPECS 90.51 71.68 74.13 90.56 37.36 72.98 69.28
PPV 90.39 81.35 82.80 68.68 63.67 81.44 79.44
NPV 76.90 93.85 93.91 92.73 93.31 89.99 91.80
Performance using MCMC method for feature selection with (9) genes selected CLASSIFIERS
ASSESMENT CRITERIA
NAIVE LDA B-LDA QDA B-QDA LD K-NN
MER 17.35 17.02 16.52 29.48 37.58 20.27 16.50
CCR 82.65 82.97 83.47 70.53 62.42 79.72 83.50
SENS 74.98 93.36 92.56 74.98 95.30 85.56 85.61
SPECS 90.31 72.58 74.38 90.36 29.52 73.88 81.37
PPV 91.61 81.58 82.85 66.62 59.88 80.86 85.95
6. DISCUSSION OF RESULTS AND CONCLUSION
In this paper, the performance of the Bayes classifier using linear and quadratic discriminant analyses were updated with the application of bootstrap prior technique in the area of preliminary feature selection and estimation of parameters needed for adequate classification. Starting with simulated data results, the true significant genes are X1, X2, X3, X4, X5, with gene X2 having the least effect on the outcome variable. All the features selection algorithms adequately identified the most significant genes (X1, X3, X4, X5). These selected genes within the biological realm are often terms as relevant biomarkers. The genes identified were then used for classification which resulted to the classification performance (%) presented in table 2. Since the genes were perfectly identified, the 100% accuracy achieved by most of the frequentist and Bayesian method shouldn’t be questioned. In addition, the failure of the Naïve Bayes classification method was as a result of the simulation scheme used, in which we incorporated some level of correlations between adjacent features. Moving to the real-life data set used, the data were on clinical results on colon cancer. The data contain 2,000 gene expression profiles of 62 tissue samples with two distinct clinical groups of tumorous (40 tissue samples) and normal (22 tissue samples) subjects. These data are freely available and can be downloaded at http://microarray.princeton.edu/oncology/affydata/in dex.html. The feature selection algorithms disagree on the subset of features selected. The algorithm based on the welch-t can be regarded as been conservative, with fewer genes selected, precisely (3) genes. Although the 3 genes selected were equally selected by the other methods. These selected genes (X1772, X1582, X1771) can be regarded as those with high biological relevance to the outcome of interest (colon cancer). The features identified by the algorithm were also used by the classification methods. The highest accuracy from most of the classifiers was observed when we used features identified by the proposed BT method. On a general note, the proposed feature selection method improved the accuracy of the classifiers. Also, the proposed classification method (B-LDA) improved classification accuracy for both simulated and real life data sets used.
REFERENCES
[Abd07] H. Abdi - Encyclopedia of Measurement and Statistics, chapter Kendall rank correlation, 2007.
[Bar12] D. Barber - Bayesian Reasoning and Machine Learning. Cambridge University Press, United Kingdom, 2012.
[Bol04] W. M. Bolstad - Introduction to Bayesian Statistics, John Wiley & Sons, Ltd, New Jersey, 2004.
[BL01] P. Baldi, A. Long - A Bayesian framework for the analysis of microarray expression data: regularized t-test and statistical inferences of gene changes. Bioinformatics, 17(6), 509-519, 2001. [D+02] S. Dudoit, Y. H. Yang, M. J. Callow,
T. P. Speed - Statistical methods for identifying differentially expressed genes in replicated cDNA microarray experiments. Statistica Sinica, 12, 111-139, 2002.
[G+99] T. R. Golub, D. K. Slonim, P. Tamayo, C. Huard, M. Gaasenbeek, J. P. Mesirov, H. Coller, M. L. Loh, J. R. Downing, M. A. Caligiuri, C. D. Bloomfield, E. S. Lander - Molecular Classification of Cancer: Class Discovery and Class Prediction by Gene Expression Monitoring. Science, 286.5439: 531-537, 1999.
[H+13] T. Hastie, G. James, D. Witten, R. Tibshirani - An introduction to statistical learning (Vol. 112). New York: Springer, 2013.
[Lee12] P. M. Lee - Bayesian statistics: an introduction. John Wiley & Sons, 2012.
[LL13] E. Lesaffre, A. B. Lawson - Bayesian Biostatistics. John Wiley & Sons, Ltd, New Jersey, 2013.
[Mur07] K. P. Murphy - Conjugate Bayesian
analysis of the Gaussian distribution. Technical report, UBC, 2007.
[NR02] D. V. Nguyen, D. M. Rocke - Tumour classification by partial least squares using gene expression data. Bioinformatics,18, 39–50, 2002.
Tsui - On differential variability of expression ratios: improving statistical inference about gene expression changes from microarray data. Journal of Computational Biology, 8, 37-52, 2001.
[Smy04] G. K. Smyth - Linear models and empirical Bayes methods for assessing differential expression in microarray experiments. Statistical Applications in Genetics and Molecular Biology, 3, No. 1, Article 3, 2004.
[SS05] C. Shang, Q. Shen - Aiding classification of gene expression data with feature selection: A comparative study. Int’l. Jour. Comput’l. Intelligence Research, 1.1, 68-76, 2005. [T+01] J. G. Thomas et all. - An efficient and robust statistical modelling approach to discover differentially expressed genes using genomic expression profiles. Genome Research, 11, 1227-1236, 2001.
[Vap98] V. N. Vapnik - Statistical Learning Theory. John Wiley and Sons, New York, 1998.
[WS03] G. W. Wright, R. M. Simon - A random variance model for detection of differential gene expression in small microarray experiments. Bioinformatics, 19, 2448-2455, 2003. [Yah12] W. B. Yahya - Genes Selection and
Tumour Classifications in Cancer Research: A New Approach. Saarbrücken, Germany. Lambert Academic Publishing, 2012.
[Y+11] W. B. Yahya, K. Ulm, L. Fahrmeir, A. Hapfelmeier - k-SS: a sequential feature selection and prediction method in Microarray Study. Int’l. Jour. of Artificial Intelligence 6(S11), 19-47. Published by Faculty of Automation and Computers, Department of Automation and Applied Informatics, "Politehnica" University of
Timisoara, Romania.