Assessing the Effect of Blockage of Dirt on Engine Radiator
in the Engine Cooling System
S. D. Oduro1
1
Lecturer , Design and Technology Department, University of Education Winneba, Kumasi Campus, Ghana
Abstract
This thesis looked at the effect of clay and silt soil blocking the heat transfer area of the radiator and its effect on the engine coolant through the conduct of experiments and a mathematical model developed. The results indicated that the percentage area covered resulted in a proportional increase of the inlet and outlet temperatures of the coolant in the radiator. The mathematically model developed also predicted the experimental data very well. Regression analysis pointed out that every 10% increase area of the radiator covered with silt soil resulted in an increase of about 17 oC of the outlet temperature of the radiator coolant. Similarly, using clay as a cover material, 10% of the area covered of the radiator resulted in an increase of about 20 oC of the outlet temperature of the radiator coolant. Statistical analysis pointed to the fact that the result obtained for clay, silt and the mathematical model were not significantly different. Thus, irrespective of the type of material that blocks the radiator surface area, the coolant rises with proportion of the radiator covered.
Keywords: Radiator, Silt, Clay, Temperature, Coolant.
1. INTRODUCTION
The radiator plays a very important role in an automobile. It dissipates the waste heat generated after the combustion process and useful work has been done. The effectiveness with which waste heat is transferred from the engine walls to the surrounding is crucial in preserving the material integrity of the engine and enhancing the performance of the engine. Various studies have been carried out on engine radiators focusing primarily on optimizing their performance. The effect of pin fin on heat transfer enhancement in a radiator was conducted to find out the fin groove influence [1]. The study concluded that an optimum angle of grooves and number of threads per inch exist where the heat loss to the environment is maximum. The effect of mass flow, inlet temperature and coolant fluid thermal properties have been extensively investigated by Oliet et al [2]. The study also covered the effect of fin pitch, louver angle and the importance of coolant flow lay-out on the radiator. The paper concludes that the overall heat transfer coefficient is essentially dependent on the
coolant flow regime and not the air side inlet temperature.
The effect of electric field on the heat transfer performance of a radiator at low frontal air velocity has also been investigated by Vithayasai et al [3]. The paper concluded that an electric field can enhance heat transfer when the frontal velocity is below 1.6m/s. However, no significant effect on the radiator was noticed when the frontal velocity was above 1.6m/s. In addition, a correlation was observed between the degree of heat transfer and the voltage supplied. Other studies on the use of Computational Fluid Dynamics (CFD) and the Effectiveness-Number of Heat Transfer Units (e-NTU) to model and optimize the heat transfer process of the radiator has been carried out by Lin et al, [4]; Dittus and Boelter [5] and Colburn [6].
Over the years, vehicles that are used in the Ghana are imported from Europe, North America and other Asian countries. The vehicles are manufactured without taking into consideration the nature of the roads in Ghana. When these cars are brought into the country, they encounter numerous problems such as engine breakdown, cylinder head gasket burnt and
overheating. As the cars move on the untarred roads, dust and mud get in contact with the radiator fins. This dust and mud block the fins and impede the flow of air through the radiator which eventually settle on the engine and the radiator. As a result the temperature of the coolant in the engine rises and significantly affects the engine performance.
In Ghana, vehicles in cities, towns and villages encounter these problems since most of the roads these vehicles ply on are untarred roads. For example, only 23% of roads in Kumasi city are tarred [7]. These dust and mud accumulate on the fins of radiator and other component of the cooling system affect the radiator performance. The accumulation narrows the heat dissipation air passage area. The greater soils on the road are mainly clay and silt which predominately are found on Ghanaian roads.
There has been little or no research conducted on the effects of soil blocking radiator fins and its effect on the cooling system in Ghana. Little is known on the quantification of dirt on the radiator fins and its effect on the engine performance. These studies take a critical looks at the effect of dirt blocking the radiator fins and its effect on the coolant temperature
.
2. Material and Methods
2.1 Experimental Setup
This paper which formed part of a whole project work has the experimental setup comprised of a four cylinder petrol engine as shown in Fig. 1. The engine is a water-cooled with a radiator tank capacity of 5.5 liters and the compression ratio is 9.8 to 1. The radiator consists of fins, tubes, upper and lower hose and the outer frontal surface area which was covered using clay and silt soil during the experiment. The radiator outer surface area was divided into 10 equal parts each representing 10% of the surface area covered. It was then covered with clay or silt from each ends at 5% from the outer surface area of the radiator as shown in figure 1.
2.2 Description of Equipment and Engine
The engine was fitted with two Cola-Parma model 8110-10 thermocouple with an accuracy of ± 0.10 oC to read the inlet and outlet temperature of the water into and out of the radiator. Details of the specification of the engine and radiator used for the experiment are given in Table 1.
K-type Thermocouple Radiator surface area covered with Clay or Silt
Fig1.The K-type of thermocouple fitted to both the outlet and inlet radiator hose
2.3 Experimental procedure
The radiator of the engine was 65 mm in length by 35 mm in breath as showed in Fig. 1, and had a total number of 66 tubes. All the 66 tubes were in a single
row and each tube was 2 mm thick. The fins were made of copper with a thickness of 0.5 mm, height of 16 mm and spaced 3 mm apart as shown in figure 1. The radiator was thoroughly cleaned of all dust and debris before the experiments were carried.
Table 1: Shows the specifications of Engine and Radiator Used
for the Experiment
Year 1996
Manufacturer Nissan
Model range Primera
Engine Capacity 1597cc
Engine Type GA 16
Number of cylinders 4/DOHC
Engine Firing Order 1-3-4-2
Compression Ratio 9.8:1
Cooling System capacity 5.5 litres of water
Thermostat opening 76.5c
Radiator Pressure 0.78-0.98 bar
Ignition timing basic BTDC Engine/rpm 10+2/625
Idling Speed 750+50 rpm
The radiator effective heat transfer surface area as showed in Fig. 1 was divided into ten (10) equal parts, each representing 10% of the effective heat transfer area. The outer part of the radiator heat transfer area was covered whiles the engine cooling fan mounted in the inner surface area was used to draw air through the radiator as each percentage of outer surface area covered. The fan speed was held constant throughout the experiment. Part of the outer
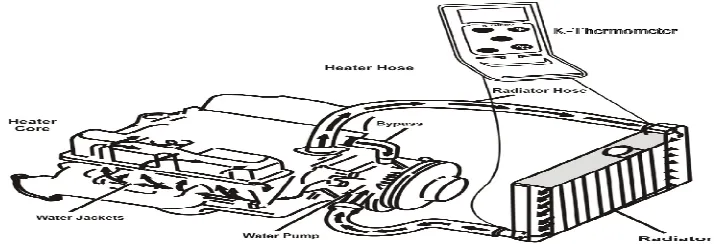
effective heat transfer area was then covered with either clay or silt soil to the required percentage before running the engine. The engine was run for about fifteen (15) minutes to attain stable conditions before readings were taken. For each set-up, three readings were taken at intervals of two minutes. The rotational speeds of the engine and the fan speed were held constant throughout the experiment. Also, the load on the engine was not increased, throughout the experiment, the engine was idling. At the end of each experiment, the radiator is thoroughly cleaned; it is then covered with silt or clay soil which is the major soil on our roads and selected for the experiment to the required percentage. The K-thermometer used was to connect both the lower and upper radiator hose where readings were taken simultaneously from the coolant entering in and out of the engine. The readings were taken at two minutes interval by the K - thermometer. When the engine was running, coolant flows into the block and through the water jacket surrounding the cylinder. It then flows through the upper radiator hose as shown in Fig.2. As the coolant flows through the radiator, the fan draws air through the heat transfer surface area of the radiator and pumps it into the engine by the water pump.
A mathematical model was develop based on the Effectiveness – Number of Heat Transfer Units
(ɛ-NTU) method was used to validate the experimental result. In modeling the radiator, the ɛ -NTU was used because, the focus of this paper was on the outlet and inlet temperature of the water after the effective heat transfer area was partially covered with either clay or silt soil to the required percentage before running the engine. When the inlet or outlet temperatures are to be estimated, the ɛ-NTU method comes in handy.
Fig2.Experimental set-up showing K-type thermocouple and radiator outer surface area covered
3. Mathematical Equation Used
The model was developed to predict the outlet temperature of the coolant from the radiator given the dimensions of the radiator, the flow rates of the fluids and the cooling load. In order to solve the analytical model, the following assumptions were made;
1.Constant coolant flow rate and fluid temperatures at both the inlet and outlet temperatures, that the system operated at steady state
2.There were no phase changes in the coolant 3.Heat conduction through the walls of the coolant tube was negligible
4.Heat loss by coolant was only transferred to the cooling air, thus no other heat transfer mode such as radiation was considered
5.Coolant fluid flow was in a fully developed
condition in each tube
6.All dimensions were uniform throughout the radiator and the heat transfer of surface area was consistent and distributed uniformly
7.Pure water was used as the coolant
8.The thermal conductivity of the radiator material was considered to be constant
9.There were no heat sources and sinks within the radiator
10.There was no fluid stratification, losses and flow misdistribution.
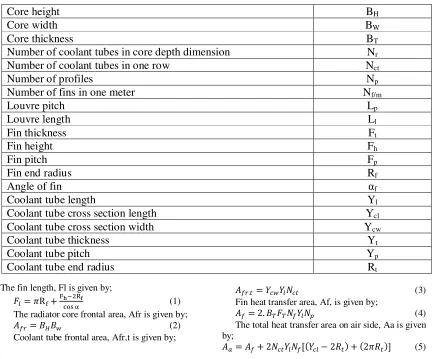
The heat transfer process in the radiator was modelled as a forced convective heat transfer operation. The equations for the model were taken from Lin et al [4]. The parameters for calculating the heat transfer area are given in Table 2 below. The relevant equations are given from equation 1 to 25
Table 1.Parameters for the radiator heat transfer area
Core height
B
HCore width
B
WCore thickness
B
TNumber of coolant tubes in core depth dimension
N
rNumber of coolant tubes in one row
N
ctNumber of profiles
N
pNumber of fins in one meter
N
f/mLouvre pitch
L
pLouvre length
L
lFin thickness
F
tFin height
F
hFin pitch
F
pFin end radius
R
fAngle of fin
α
fCoolant tube length
Y
lCoolant tube cross section length
Y
clCoolant tube cross section width
Y
cwCoolant tube thickness
Y
tCoolant tube pitch
Y
pCoolant tube end radius
R
tThe fin length, Fl is given by;
ܨ= ߨR+ୡ୭ୱ ିଶୖ (1)
The radiator core frontal area, Afr is given by;
ܣ= ܤுܤ௪ (2)
Coolant tube frontal area, Afr,t is given by;
ܣ.௧= ܻ௪ܻܰ௧ (3)
Fin heat transfer area, Af, is given by;
ܣ= 2. ܤ்ܨ்ܻܰܰ (4)
The total heat transfer area on air side, Aa is given by;
ܣ= ܣ+ 2ܰ௧ܻܰ[ሺܻ− 2ܴ௧ሻ + ሺ2ߨܴ௧ሻ] (5)
The total heat transfer area on coolant side, Ac is given by;
The total coolant pass area, Ap,c is given by;
ܣ,= [ߨሺܴ௧− ܻ௧ሻଶ+ ሺܻ௪− 2ܻ௧ሻሺܻ−
2ܴ௧ሻ]ܰ௧ܰ (7)
The following dimensionless groups for convective heat transfer were used;
Reynolds number – which may be defined as ratio of flow momentum rate (inertia force) to viscous force for a particular geometry. It is given by;
ܴ݁ =ఘఓ (8) Nusselt number – which is defined as the ratio of the convective heat transfer coefficient (h) to the pure molecular thermal conductance (k/L), thus,
ܰݑ = (9)
Prandtl number – defined as the ratio of momentum heat diffusivity to thermal diffusivity of the fluid. It is solely a fluid property modulus
ܲݎ =௩ఈ=ఓ
. (10)
Where ρ = density of the fluid, kg/m3 V = velocity of the fluid, m/s L = length of tube, m
k = thermal conductivity of the fluid, W/m.k Cp = Specific heat capacity of the fluid, kJ/kg.K
h = heat transfer coefficient, J/m2.K
α = thermal diffusivity of the fluid, m2/s
µ = viscosity of the fluid, centipoise
υ = kinematic viscosity of the fluid, m2/s
3.1OVERALLHEATTRANSFER COEFFICIENT
The overall heat transfer resistance for radiators can be considered to be due to;
Wall conductance Fouling on the air side Air side convection Fouling on the coolant side Coolant-side convection
Mathematically, it can be defined as;
ଵ
=
ଵ
ሺ୬୦ሻ+ Rୟ+
∆୶
ሺ୩ሻ౭+
ଵ
ሺ୬୦ሻౙ (11)
Where U = the overall heat transfer coefficient
h = heat transfer coefficient
no = total surface efficiency of an extended
fin surface
Rf = fouling factor
Subscript a, c and w refer to air side, coolant side and coolant wall respectively.
For purposes of simplicity, the fouling factor on both the air side and the coolant side was assumed to be negligible. Also, the thermal resistance due to the coolant wall was assumed to be negligible as compared with the other terms because the coolant tube is most often made with either copper or aluminium both of which have large thermal conductivities whilst the thickness of the tube is usually small. The total surface efficiency of the fin was also assumed to be unity for purpose of simplicity.
When all these assumption are taken into effect the corrected equation becomes;
ଵ
౨,౨=
ଵ
୦+
ଵ
୦ౙౙ (12)
Where Afr,r = radiator core frontal area
Aa = total heat transfer area on air side
Ac = total heat transfer area on coolant side
ha = heat transfer coefficient on air side
hc = heat transfer coefficient on coolant side
The air side heat transfer coefficient was taken from Davenport [8] and is given by;
hୟ= 0.249Re୪ି.ସଶL୭.ଷଷ୦ ቀቁ ଵ.ଵ
F୦.ଶ൨େ౦, ౨మ యൗ
(13)
Where Lh = louver height
Ll = louver length
Fh = Fin height
Other parameters retain their meaning as already defined above.
The coolant side Nusselt number was taken from Holman [9] is given by;
Nuୡ= 3.66 +
.଼൬ీ,ౙౕభ൰ୖୣ୰
ଵା.ସ൬ీ,ౙౕభ൰ୖୣ୰൨మ యൗ
(14)
This equation was employed because of the laminar nature of the fluid flow in our radiator. Other correlations may be applicable depending on the nature of fluid flow – transition or turbulent.
Where Dh = hydraulic diameter
Yl = coolant tube length
3.2 THE Ɛ-NTU METHOD
The heat transfer rate in the radiator is given by;
Q = εC୫୧୬ሺTୡ୧− Tୟ୧ሻ (15)
ܣ= [2ߨሺܴ௧− ܻ௧ሻ + 2ሺܻ− 2ܴ௧ሻ]ܻܰ௧ܰ ሺ6ሻ
Where Cmin = minimum heat capacity rate
The radiator thermal efficiency (ɛ) is defined as the ratio of the actual transfer rate from the hot fluid (coolant) to the cold fluid (air) in a given radiator to the maximum possible heat transfer rate. It is expressed as;
The actual heat transfer balance equation at steady state which is defined in terms of energy lost on coolant side and energy gained on the air side is given by;
Where Ca = heat capacity of air
Cc = heat capacity of coolant
Tci = Coolant inlet temperature
Tco = Coolant outlet temperature
Tao = Air outlet temperature
Tai = Air inlet temperature
The heat capacity ratio is defined as the product of the mass flow rate and the specific heat of the fluid;
For air: ܥ = ݉ݔܥ,= ܣߩܸܥ, (18) For coolant:
ܥ= ݉ݔܥ,= ܣߩܸܥ, (19)
The heat capacity ratio is defined as the ratio of the smaller to the larger capacity rate for the two fluid streams and is expressed as;
Where Cmin is the smaller of Ca and Cc. According
to SAE JI393 [10], the minimum capacity rate Cmin is
always on the air side. Hence
Cmin = Ca and Cmax = Cc. (21)
It follows therefore that the heat transfer rate is given by;
The number of heat transfer units (NTU) is the ratio of overall conductance UA to the smaller capacity rate Cmin;
The radiator effectiveness is defined as a function of both the NTU and the Cr by Kays and London [11]
and is given by;
The model equations were developed to predict the outlet temperature (T1) of the coolant from the radiator given the dimensions of the radiator, the flow rates of the fluids and the cooling load. The following equations were generated and based on the equation outlined below, the model was developed using
MATLAB and run with an algorithm.
The final result obtained was used to validate the experimental results.
4. Results and Discussions
As shown in Fig.3 when the result of the mathematical model was compared to the results obtained from experiment the experiment using clay and silt soil, it was observed that the mathematical model predicted the heat transfer phenomenon quite well. In spite of the many assumptions, it was observed that the temperature of the coolant from the radiator was comparable to results obtained for the experiments. The model predicted closely, the results obtained when clay was the covering material better than silt. This is perhaps due to the fact that clay was a better coverage material than silt that clay stuck better on the radiator surface than silt. This is also in line with literature because Davenport [8] performed visualization studies on radiator and concluded that as the effective heat transfer area of a radiator deceases the total heat transfer through the radiator also decrease and vice versa. It was generally observed that as the area of the radiator covered was increased, the temperature of the coolant from the radiator also increased considerably. This can be explained by the fact that the effective heat transfer area was reduced, thereby limiting the quantity of air admitted through the radiator for purposes of cooling the coolant. In all cases this trend of increasing outlet temperature of the coolant from the radiator was observed. As shown in the fig. 3, the temperature of the ambient air was found to be relatively constant. This therefore did not significantly affect the rate of heat transfer because the air mass was almost constant just as the thermal properties of the air.
Comparing the temperature of the coolant into the radiator for three scenarios – the model, clay and silt covering, it can be observed in Fig.4, that the results obtained were similar. The model was able to predict the heat transfer process quite well. In all the three cases the temperature of the coolant into the radiator increased as the area of the radiator covered also
ߝ =ொொ
ೌೣ (16)
ܳ = ܥሺܶ− ܶሻ = ܥሺܶ− ܶሻ (17)
ܥ =ೌೣ (20)
ܳ = ߝܥሺܶ− ܶሻ
(22)
ܷܰܶ =ೝ,ೝ
=
ଵ
ܷ. ݀ܣ , (23)
ߝ = 1 − ݁ݔ ቄே்ೝబ.మమ[݁ݔሺ−ܥ. ܷܰܶ.଼ሻ − 1]ቅ (24)
T1=T2-Qc/ሺe*Ca_wሻ ሺ25ሻ
Increased. This is due to the fact that when the surface area of the radiator is reduced by covering, less heat is taken out of the coolant, thus increasing the outlet temperature of the coolant from the radiator as observed above. Since the coolant is not well cooled, it picks up heat from the engine which increases its temperature higher than expected before entering the radiator. During the experiment it was also noticed that the engine stopped running after a short time when the radiator was completely covered. This was as a result of the inability of the coolant from taking away enough heat from the walls of the engine thereby causing poor idling and rough running
and subsequently forcing the engine to stop running in order to prevent substantial damage to the engine.
As given in the table 2, the regression relationships between the radiator coolant outlet temperatures and the proportion of the radiator surface area covered with clay, silt and Matlab simulation respectively. As expected it can be seen that as the percentage of the radiator surface covered increases the outlet temperature of the radiator coolant increases. The regression models used to predict the outlet temperatures of radiator coolant from the percentage of area covered of the radiator.
Fig3.Comparison of model results of temperature of water out of the radiator with results obtained with silt and clay
Fig4.Comparison of results of inlet temperature of water into the radiator for the model with that of silt and clay
The Matlab model was a simulated model to evaluate the validity of the silt and clay models. All the three models predicted well and were statistically significant at a 1% probability level. The coefficient of determination (R2) of the three models ranged from 0.98 to 0.99. At least 99% of the variation in the outlet coolant temperatures was explained by the percentage of the area covered of the radiator. For the silt model, for every 10% increase or decrease of the area covered of the radiator resulted in an average increase or decrease of about 17 degree Celsius of the outlet temperature of the radiator coolant. In the case of the clay model, a 10% increase or decrease of the area covered of the radiator resulted in about 21 degree Celsius of the outlet temperature of the
radiator coolant (Table 3). In the Matlab model, a change in 10% of the area covered of the radiator resulted in a change of about 20 degree Celsius of the outlet temperature of the radiator coolant.
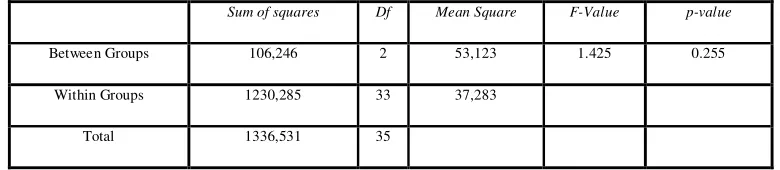
The Analysis of Variance (ANOVA) which was conducted to find out if there were statistically significant differences among the three models namely clay, silt and the Matlab (Table 4). The Table 3 given clearly showed that, there were no statistically significant differences among the three models. This indicates that the Matlab model predicted the experimental result quit well. It can also be said when the same amount of clay or silt covers the same area of a radiator the same temperature rise of the radiator coolant will obtained.
Table 3: Models to predict outlet temperature (°C) of coolant from the Area covered of the radiator (%).
Model Regression equation R2
T – Test (Two-tailed) P-value
Silt T=0.1652A+40.29 0.9858 78.558 <0.0001
Clay T=0.2072A+41.699 0.9792 70.039 <0.0001
Mat lab T=0.20A+42.323 0.999 905.980 <0.0001
Table 4: Analysis Of Variance (ANOVA) for comparison outlet temperatures based on the silt, clay and Matlab models
Sum of squares Df Mean Square F-Value p-value
Between Groups 106,246 2 53,123 1.425 0.255
Within Groups 1230,285 33 37,283
Total 1336,531 35
5. Conclusions
Experiments were successfully conducted on the radiator of four cylinder petrol engine at base load. Two different soil types, namely silt and clay, were used as covering material to cover the heat transfer area of the radiator to determine the heat transfer process during the running of the engine. It was observed that the inlet temperature of the coolant in the radiator increased as the percentage area of the radiator covered increased. It was also observed that The outlet temperature of the coolant from the
radiator increased monotonically with increases in the percentage area of the radiator covered. In both cases, at 80% coverage of the heat transfer area of the radiator the engine vibrated excessively and the idling was not stable. It can be concluded that dirt on the surface of a radiator decreased the performance of the radiator which could affect the engine in the long run. It is recommended that, future studies should consider a long real live engine testing for a longer period of time. This will give us a long term effect on the engine due to part of the radiator being covered with silt or clay as is the case in most African countries.
References
[1]. Nuntaphan, A., and Kiatsiriroat,T. (2004). “Performance of thermosyphon heat exchanger modified from automobile radiator” .In The 18th Conference of Mechanical Engineering Network of Thailand, Kon Kaen, Thailand. [2]. Oliet, C., Oliva, A., Castro, J., Perez-Segarra
(2007).“Parametric studies on automotive radiators”. Applied Thermal
Engineering 2033-2043.
[3]. Vithayasai, S., Kiatsiriroat, T., and Nuntaphan (2006). “Effect of electric field on heat transfer performance of automobile radiator at low frontal air velocity”. Applied Thermal Engineering 2073-2078.
[4]. Lin, J. Saunders, S. Watkins, (2000). “The effect of changes in ambient and coolant radiator inlet temperatures and coolant flow rate on specific dissipation”. SAE Technical Paper Series (2000-01-0579), pp.1–12.
[5]. Dittus, F. W. and Boelter, L. M. K., (1985) “Heat Transfer in Automobile Radiators of the Tubular Type, Univ. of California Pub. Eng”., Vol. 2, No. 13, pp. 443-461, Oct. 17, 1930; reprinted in Int. Comm., Heat Mass Transfer, Vol. 12, , pp. 3-22.
[6]. Colburn, A. P., (1993) “A Method of Correlating Forced Convection Heat Transfer Data and Comparison with Fluid Friction”, Trans. Am. Inst. Chem. Eng., Vol. 29 1993, pp. 174 -210; reprinted in Int. J. Heat Mass Transfer, Vol. 7, 1994, pp. 1359-1384.
[7]. Driver and Vehicle Licensing Authority. http:// www.dvlaghana.gov.gh/.Assessed on 02/02/2010
[8]. Davenport C. J (1983), Correlations for Heat Transfer and Flow Friction Characteristics of Louvered Fin, Heat Transfer Seattle 1983, AICHE Symposium Series, No. 225, Vol. 79, 1983, pp. 197.
[9]. . Holman, J.P. Heat Transfer (5th Edition). McGraw-Hill, New York, NY. 1981
[10].SAE J1393, Jun 84, "On-High way Truck Cooling Test Code", SAE Standard, SAE, Warrendale
[11].Kays W.M., London A.L.,(1984) “Compact heat exchanger”, 3rd edition, McGraw-Hill, New York.