Journal of Chemical and Petroleum Engineering, University of Tehran, Vol. 46, No.2, Dec.2012, PP. 111-121 111
* Corresponding author: Tel: +98-21-66976863 Fax: +98-21-66461024 Email: [email protected]
Segregation Behaviour of Particles in Gas Solid Fluidized
Beds at Elevated Pressure
Hamid Reza Norouzi, Navid Mostoufi *and Rahmat Sotudeh-Gharebagh Process Design and Simulation Research Center, College of Chemical Engineering,
University of Tehran, Iran
(Received 27 October 2012, Accepted 6 November 2012)
Abstract
A comprehensive mathematical model based on the discrete particle model and computational fluid dynamics was utilized to investigate mixing and segregation of particles in fluidized beds at high pressure. To quantify the extent of mixing in the bed, the Lacey mixing index was used. Simulations were carried out with different mass fractions of small particles at various pressures ranging from 1 to 64 bar and at various superficial gas velocities. The results showed that the bed transforms from a segregated state to a fully mixed condition when the operating pressure is increased. Vertical segregation of particles at low pressure was replaced by horizontal segregation of particles at high pressures in which small particles were collected mainly near the walls and large particles at the center of the bed. At the same pressure, the rate of segregation decreased with increasing the mass fraction of small particles.
Keywords
: Mixing, Segregation, Fluidized bed, Lacey index, Discrete particle modelIntroduction
Size segregation is a common phenomenon in gas-solid fluidized beds. Segregation of particles affects heat and mass transfer efficiency in fluidized beds. When a system containing small and large particles with the same density is fluidized, segregation may occur in which large particles are collected at the bottom and small particles at the top. The top layer is called flotsam and the bottom layer is called jetsam. In fluidized bed reactors in which an exothermic reaction takes place, a good mixing is essential to avoid hot spots and degradation in quality of products. On the other hand, segregation is essential for the processes that involve particle separation. In order to improve the efficiency of these processes, a detailed knowledge of mixing/segregation characteristics of these systems is essential [1, 2].
Many experimental efforts[3-10] have been made to obtain information about mixing/segregation properties of gas-solid fluidized beds. A clear observation of solid mixing/segregation is not accessible through these sophisticated experiments. Thus, numerical simulations were implemented to overcome the shortage and difficulties of experiments and to obtain detailed
information about these phenomena. Among the proposed models[11-13], a combined computational fluid dynamics and discrete particle model (DPM-CFD) was adopted in this study[13]. In this model, particles are treated as discrete phase and each particle is tracked by applying the Newton’s second law of motion while the gas phase is treated as a continuum phase for which Navier-Stokes equations are applied. This method is an effective tool to investigate gas-particle systems as reviewed by Deen et al.[14] and it also has been used to investigate mixing and segregation behaviour of gas solid fluidized beds. For example, Zhang et al.[15] investigated the particle motion and mixing in a flat-bottom spout bed. Chun-liang and Jie-min [16] used a hard-sphere DPM model to study the mixing of particles for two kinds of inlet configurations at various superficial gas velocities. Dahl and Hreyna[17] used a 2D DPM-CFD model to investigate segregation in systems with particle size distribution. Huillin et al.[18] investigated segregation of binary mixtures of particles with diameters of 499, 277 and 171 µm.
112 Journal of Chemical and Petroleum Engineering, University of Tehran, Vol. 46, No.2, Dec.2012 hydrodynamic behaviour of fluidized bed is
different from that in the ambient pressure. Mansourpour et al. [19] investigated the bubble characteristics and hydrodynamics of bed at high pressure and showed that at elevated pressures the diameter and rise velocity of bubbles are reduced and the bubble path through the bed changes from direct line into the wavy shape and the gas hold up of emulsion phase increases. Since the mixing/segregation behaviour of particles is greatly affected by the bubble hydrodynamics [20], it is expected that this behaviour changes at elevated pressure.
In the present work, a soft sphere DPM-CFD model was used to investigate segregation phenomena in the fluidized beds. The influence of bubble hydrodynamics on the mixing/segregation properties of particles was determined. Effects of operating pressure and volume fraction of small particle on the mixing and segregation rate of particles were discussed.
2. Model development
In the soft sphere Eulerian-Lagrangian model, the gas is considered as a continuum phase and the solid particles as discrete elements. Inter-particle collisions are considered inelastic in this approach. Each particle is tracked by applying the Newton’s second law of motion [21]:
gik j ij d ij c i f i
i f f f f
dt V d m i ,
1 , ,
,
(1)
where ki is the total number of binary contacts on particle i, ff,iis the force exerted on particle i as a result of inter-phase momentum transfer and fg,i is external body forces such as gravitational force, fc,ij and fd,ij are contact and damping forces on a particle, respectively. The rotational motion of particle which is the results of inter-particle collisions is described as:
ki i i i i T dt d I 1 (2)
Where Ti,j is the torque vector exerted on a particle and i is the rotational velocity of particle. The binary inter-particle contact forces were calculated based on the soft sphere model in which the normal and tangential forces are evaluated by the linear spring-dashpot model [13]. Detailed equations to calculate contact forces are described in Table 1.
The spatially averaged Navier-Stokes equations were utilized to describe the gas phase flow field[11]:
0. u t (3)
uu P F
gt u f B fp f
f
. . (4)
whereFBfp is the average momentum
exchange term between gas phase and solid phase in each computational cell and is described by the following equation:
i kc i
c i f B
fp f V
F 1
, (5)
The porosity was calculated based on the area occupied by the particles in each fluid (computational) cell. Since the drag force correlation is actually for a 3D system, this calculated 2D porosity is in direct contradiction to the drag force correlation. To solve this problem, the equation suggested by Hoomans et al.[22] was used for transforming the 2D porosity into the 3D one:
2/32 3 1 3 2 1 D D
(6)
The time step for integrating particle motion equations over time was chosen according to the following condition[23]:
Segregation Behaviour of Particles in….. 113
Table 1: Expressions used for calculating contact and drag forces acting on particle i
Forces or torque Symbol Equation Normal forces Contact fcn,ij
i c n k ,
Damping fdn,ij
i n iV ,
Tangential forces Contact fct,ij
ij t ij t ij t t ij cn k f , , , , , min Damping fdt,ij
i t iV,
Torque Interparticle Tij
i ct f
R ,
Gravity fg,i mg
i
Fluid drag force ff,i
V U
, 0.8
1 4 3 8 . 0 , 1 75 . 1 1 150 65 . 2 2 2 2 pi f D pi f pi f d U V C d U V d
1000 Re , 44 . 0 1000 Re , Re Re 15 . 0 1 24 , , , 687 . 0 , i p i p i p i p D Cwhere: , R, ,
i j R i j j i j j i i
R x x n V V V R R Re ,
f pi f
d V U
p i
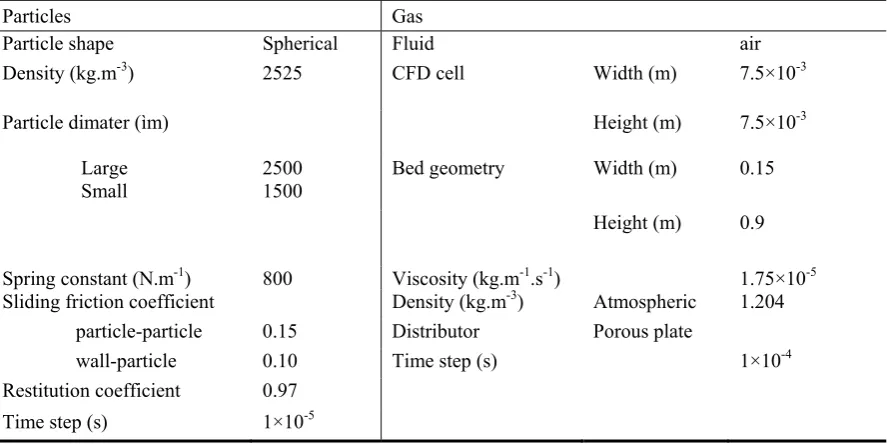
Table 2: Details of parameters used in the simulations
Particles Gas
Particle shape Spherical Fluid air
Density (kg.m-3) 2525 CFD cell Width (m) 7.5×10⁻³
Particle dimater (ìm) Height (m) 7.5×10⁻³
Large
Small 2500 1500 Bed geometry Width (m) 0.15
Height (m) 0.9
Spring constant (N.m-1) 800 Viscosity (kg.m-1.s-1) 1.75×10⁻⁵ Sliding friction coefficient Density (kg.m-3) Atmospheric 1.204 particle-particle 0.15 Distributor Porous plate
wall-particle 0.10 Time step (s) 1×10⁻⁴
114 Journal of Chemical and Petroleum Engineering, University of Tehran, Vol. 46, No.2, Dec.2012 This is a criterion to avoid instability in
calculations and to ensure that the particle motion equation is integrated several times during a contact between two particles. A typical time step is usually between 10-6 and 10-4 seconds. Moreover, to calculate contact forces between particles, all existing contacts between particles must be determined. Considering these two factors, it can be concluded that handling the discrete phase (particles) is a rigorous procedure which needs enormous computational and memory resources, especially when there are large number of particles in the simulation. Therefore, implementing efficient algorithms to handle solid phase as discrete elements and continuum gas phase is essential for the success of the simulation.
The algorithms utilized in this work must satisfy high accuracy of solutions as well as high computational speed. Contact detection between particles is a bottleneck for solution of the DPM. Thus, a comfortable contact detection algorithm must be used in this part. Available algorithms are divided into two categories called tree-based and cell-based schemes[24]. Cell-based schemes are direct and easy to implement, needs insignificant memory and requires less computational resources compared to the tree-based scheme, especially for large scale problems. In the present study, no binary search (NBS) algorithm, a cell-based scheme first proposed by Munjiza and Andrews[25], was used.
The gas phase continuity and Navier-Stokes equations were solved by SIMPLE (semi-implicit method for pressure-linked equations) algorithm, introduced by Patankar [26] with upwind scheme used for the convection terms. No-slip condition was applied at walls and fully developed condition at the gas outlet. The domain was divided into the fluid cells of 7.5 mm 7.5 mm (3 times greater than the larger particle diameter). In each case, certain number of large and small particles was used (see Table 3). Initially, well mixed packed bed of particles was fluidized at different
superficial gas velocities. The porous plate distributer was used in the simulations. Each run was continued up to 60 seconds real time. The frequency of data saving was 100 Hz. All simulations were performed by an entirely home-developed code [19, 20].
3. Simulations and method of
analysis
Simulations were carried out in a 2D fluidized bed with 15 cm inner diameter. In each simulation, a certain number of small and large particles were randomly packed in the bed to achieve an initial well-mixed condition. The diameters of small and large particles were 1.5 and 2.5 mm, respectively. All necessary information about particles and gas properties are listed in Table 2.
Well-mixed condition was achieved by randomly positioning particles in the bed and allowing them to settle by their gravitational force for 1 second. Air with different superficial gas velocities was blown into the bed. Each simulation run continued for 60 seconds real time. Positions and velocities of all particles, gas phase velocity and pressure fields and void fraction distribution within the bed were saved every 0.01 sec.
Effect of two parameters, including volume fraction of small particle and operating pressure of fluidized bed, on the segregation behaviour of the bed was investigated. Mass fraction of small particle was chosen equal to 0.25, 0.5 and 0.75. Operating pressure of the fluidized bed was varied between 1 and 64 bar. The minimum fluidization velocity was calculated based on the correlation proposed by Wen and Yu [1] and the results are presented in Table 3. The actual gas velocity of each simulation run was U0/Umf = 1.25.
Among all mixing indices proposed to measure the extent of mixing/segregation, Lacey mixing index was chosen for quantifying the extent of mixing/segregation [27]. The Lacey mixing index is defined as:
2 2 0
2 2 0
R
S S
S S M
Segregation Behaviour of Particles in….. 115 where S2 is the actual variance, 2
0
S and
2
R
S stand for the variances of the completely segregated and well mixed state, respectively.
This equation is proposed for mono-sized system. For the present study, in which there are particles with two different sizes, the method of equivalent particle number was employed. For example, in the case of particle sizes of 1.5 and 2.5 mm, a large particle is equivalent to 4.63 small particles.
According to this method, the following equations were defined.
q p
S02 . (9)
t R
N q p
S2 . (10)
whereNt is the total number of equivalent particle in the whole bed. For determining the Lacey index, the whole bed was divided into several cells (55 mm2) and the volume fraction of small particle and equivalent number of particles were calculated in each cell. Then, the actual variance was calculated by [28]:
22
1
1
nwf i i
tot
S
k
X
X
k
(11)There are other mixing indices like that proposed by Marzocchella et al. [29]. In their proposed mixing index, M is a measure of the deviation between the actual solids composition profile and that associated with the completely segregated state and then it is normalized with respect to the condition of completely mixed state. They used a continues summation of concentration along the bed height while in the Lacey index the discrete summation is done on the all direction by dividing the whole bed into square cells (2D case) and calculating the variance of concentration of particle concentration. According to the mixing index proposed by Marzocchella et al. [29], the summation is done over the static bed height. This means that it is necessary to terminate the gas flow in the simulation and allowing the particle to settle
in order to calculate M while in the case of Lacey index this is not necessary.
Table 3: Details of simulation runs in this study.
wsmall Nsmall Nlarge Ubar/ 64 bar) [m/s] mf (1 bar/8 bar /32
0.25 3945 2555 1.10 / 0.45 / 0.23 / 0.17
0.50 6610 1440 0.98 / 0.41 / 0.22 / 0.15
0.75 8955 645 0.87 / 0.38 / 0.20 / 0.14
4. Results and Discussion
Fig. 1 shows the initial position of small and large particles in the bed. Small and large particles are in light and dark gray, respectively. As can be seen in this figure, the initial height of particles in the bed is 15 cm and they are randomly positioned. The enlarged part shows a better view of arrangement of particles in the packed condition.
Figure 1. Initial position of small and large particles before injection of air into the bed
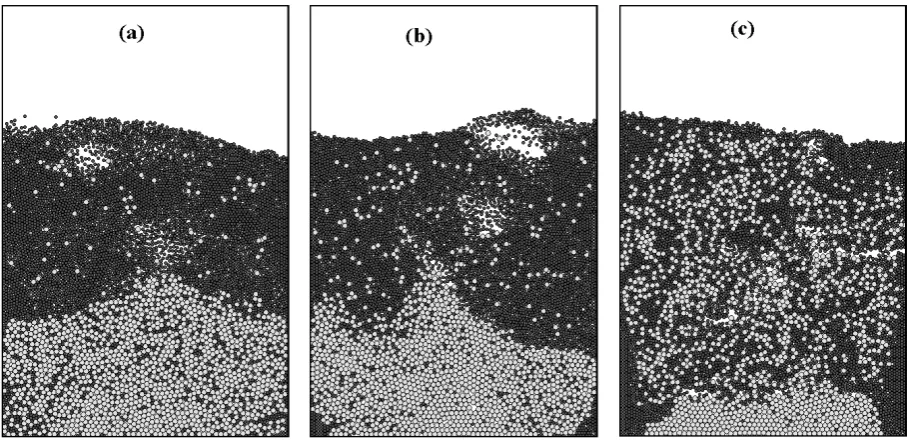
116 Journal of Chemical and Petroleum Engineering, University of Tehran, Vol. 46, No.2, Dec.2012 particles are suspended and the excess gas
forms bubbles in the bed. Bubbles formed near the gas distributor plate gradually grow along the bed height and burst at the surface. Bubble induces a wake of particles underneath and pulls up particles toward the bed surface [16]. As there are particles with different sizes, the drag force exerted on the particles is different and the particles can have different velocities in the loose regions and thus, segregation of particles advances [28]. After elapsing enough time, the final state of bed is attained. In this state, small and large particles are mainly collected at top and bottom of the bed, respectively. It can be seen in Fig. 2a that segregation occurs when the operating pressure is 1 bar. Large particles (light gray) are collected at the bottom while the concentration of small particles (dark gray) is high near the bed surface. This arrangement of particles is almost vertical. However, as the operating pressure increases to 16 bar, the bottom layer becomes thinner, the concentration of small particles is reduced greatly near the bed surface and small particles are pushed toward the wall rather than top of the bed. This arrangement of particles is horizontal (Fig. 2e). The vertical movement of bubbles through the bed changes into a wavy shaped path by increasing the operating pressure [19]. The movement of bubbles is followed by the movement of particles in the bed. Thus, particles move in the lateral direction as a result of the wavy shaped movement of bubbles and segregation of particles occurs in the horizontal direction.
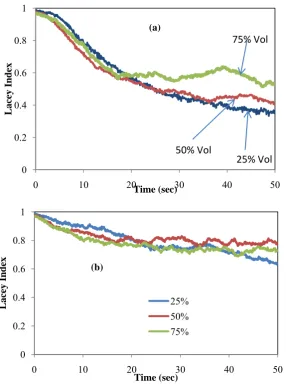
Lacey mixing index was calculated dynamically during fluidization. Fig. 3 shows the mixing index of the bed during 50 seconds of fluidization for beds with different volume fraction of small particle. As can be seen in this figure, the initial value of the mixing index indicates the fully mixed condition of the bed. As time proceeds during the fluidization, the mixing index decreases that shows the segregation of particles is occurring. After elapsing enough time, the mixing index does not change noticeably indicating that the
segregation of particles does not advance any more. It is illustrated in Fig. 3a that final value of the mixing index (after 50 seconds) increases with increasing the volume fraction of small particle at operating pressure of 1 bar and U0/Umf = 1.25. However, the difference between these curves at 16 bar is not very noticeable. This trend may occur due to the fact that the bed is more homogeneous at an elevated pressure that prevents the segregation of particles from spatial rearrangement. The void fraction of emulsion phase increases and the size of bubbles decrease with increasing the operating pressure [19]. Thus, loose regions of bed (bubbles) decreases. According to Feng et al., the segregation of particles occurs more likely in the regions (loose regions) where the particles are not surrounded by other particles and they can move independently in space [28]. When the portion of loose regions in the bed decreases, the segregation of particles is obviously decreased.
5. Conclusions
Segregation Behaviour of Particles in….. 117
Figure 2: Final state of bed (after 50 seconds). Small particles (dark gray) and large particles (light gray). The volume fraction of small particle is 0.5 and operating pressure is a) 1 bar, b) 8 bar, c) 16 bar, d) 32
118 Journal of Chemical and Petroleum Engineering, University of Tehran, Vol. 46, No.2, Dec.2012
Figure 3:Lacey mixing index evolution during fluidization for various volume fractions of small particle, a) 1 bar and b) 16 bar.
Nomenclature
CD fluid drag coefficient dp particle diameter, μm e restitution coefficient
fc,ij contact force between particle i and j, N fd,ij damping force, N
ff,i particle-fluid interaction force, N
FfpB volumetric fluid-particle interaction force, N m-3
fg,i gravitational force, N
g gravitational acceleration, m s-2 Ii moment of inertia, kg m2
kc number of particle in a computational cell ki number of contacting particles
kn normal spring coefficient, N m-1 kt tangential spring coefficient, N m-1 ktot Sum of all weighting factors
kwf weighting factor of particle in sampling cell mi mass of particle, kg
M Lacey Mixing Index n unit vector
Nt total number of equivalent
p mass fraction of small particle P fluid pressure, Pa q mass fraction of large particle
R radius vector (from particle center to contact point), m
S actual standard deviation of particle concentration in bed corresponding to time t S0 standard deviation of particle concentration
corresponding to segregated state
Sr standard deviation of particle concentration corresponding to fully mixed state.
Tij torque, N m t time, s
U0 superficial gas velocity, ms-1 Umf Minimum fluidization velocity, ms-1 u fluid velocity vector, ms-1
Vi particle velocity, ms-1 Vc cell volume, m3
Xi Mass fraction of small particle in sampling cell i
X Mean mass fraction of small particle in all
sampling cells 0
0.2 0.4 0.6 0.8 1
0 10 20 30 40 50
Lacey Index
Time (sec)
25% Vol 50% Vol
75% Vol
(a)
0 0.2 0.4 0.6 0.8 1
0 10 20 30 40 50
Lacey Index
Time (sec)
25% 50% 75%
Segregation Behaviour of Particles in….. 119
Greek symbols
inter-phase momentum transfer coefficient, kg m-3s-1
δ deformation coefficient, m Porosity
η damping coefficient
µ friction coefficient µf fluid viscosity, kg m-1s-1 ρf fluid density, kg m-3 ρp particle density, kg m-3
fluid viscose stress tensor, N m-3 ωi angular velocity of particle, s-1
References
:
1- Kunii, D. and Levenspiel, O. (1991). Fluidization engineering, Butterworth- Heinemann, Boston.
2- Fan, L.S. and Zhu, C. (1998). Principles of gas–solid flows, Cambridge University Press, New York.
3- Rowe, R.N. and Nienow, A.W. (1976). Particle mixing and segregation in gas fluidized beds, Powder Technol., Vol. 15, pp. 141-147.
4- Formisani, B., De Cristofaro, G. and Girimonte, R. (2001). A fundamental approach to the phenomenology of fuidization of size segregating binary mixtures of solids, Chem. Eng. Sci., Vol. 56, pp. 109-119.
5- Wang, R.C. and Chou, C.C. (1995). Particle mixing/segregation in gas–solid fluidized bed of ternary mixtures, Can. J. Chem. Eng., Vol. 73, pp. 793–799.
6- Gilbertson, M.A. and Eames, I. (2001). Segregation patterns in gas-fluidized systems, J. Fluid Mech., Vol. 433, pp. 347-356.
7- Goldschmidt, M.J.V., Link, J.M., Mellema, S. and Kuipers, J.A.M. (2003). Digital image analysis measurements of bed expansion and segregation dynamics in dense gas-fluidised beds, Powder Technol., Vol. 138, pp. 135-159.
8- Jang, H.T., Park, T. S. and Cha, W. S. (2010). Mixing–segregation phenomena of binary system in a fluidized bed, Ind. . Eng. Chem. Res., Vol. 16, pp. 385-389.
9- Gao, J., Lan, X., Fan, Y., Chang, J., Wang, G., Lu, C. and Xu C. (2009). Hydrodynamics of gas–solid fluidized bed of disparately sized binary particles, Chem. Eng. Sci., Vol. 64, pp. 4302-4316.
10- Zhang, Y., Jin, B. and Zhong, W. (2009). Experimental investigation on mixing and segregation behavior of biomass particle in fluidized bed, Chem. Eng. and Processing, Vol. 48, pp. 745–754.
11- Anderson, T.B. and Jackson, R. (1967). A fluid mechanical description of fluidized beds: Equations of motion, Ind. Eng. Chem. and Fundamentals, Vol. 6, pp. 527-539.
120 Journal of Chemical and Petroleum Engineering, University of Tehran, Vol. 46, No.2, Dec.2012 13- Cundall, P.A. and Strack, O.D.L. (1079). A Discrete Numerical Model for Granular
Assemblies Geotechnique, Vol. 29, pp. 47–65.
14- Deen, N.G., SintAnnaland, M.V., Van der Hoef, M.A. and Kuipers, J.A.M. (2007). Review of discrete particle modeling of fluidized beds, Chem. Eng. Sci., Vol. 62, pp. 28-44.
15- Zhang, Y., Baosheng, J., Wenqi, Z., Bing, R., Rui, X. and Yu, A. B. (2010). DEM simulation of particle mixing in flat-bottom spout-fluid bed, Chem. Eng. Res. and Design, Vol. 88, pp. 757-771.
16- Chun-liang, W. and Jie-min, Zh. (2007). Numerical prediction of particle mixing behavior in a bubbling fluidized bed. J. Hydrodynamics, Vol. 19, pp. 335-34.
17- Dahl, S.R. and Hreyna, C. M. (2005). Size segregation in gas–solidfluidizedbeds with continuous size distributions, Chem. Eng. Sci., Vol. 60, pp. 6658–6673.
18- Huilin, L., Yunhua, Z., Ding, J., Gidaspow, D. and Wei, L. (2007). Investigation of mixing/segregation of mixture particles in gas–solid fluidized beds, Chem. Eng. Sci., Vol. 62, pp. 301–317.
19- Mansourpour, Z., Karimi, S., Zarghami, R., Mostoufi, N. and Sotudeh-Gharebagh, R. (2010). Insights in hydrodynamics of bubbling fluidized beds at elevated pressure by DEM–CFD approach. Particuology, Vol.8, pp. 407–414.
20- Norouzi, H.R., Mostoufi, N. and Sotudeh-Gharebagh, R., Analysis of solid particle segregation in bubbling fluidized beds using DPM-CFD model, 2nd International Fluid Dynamics Conference (FD2010), 26-28 Oct. Shiraz, Iran.
21- Xu, B.H. and Yu, A. B., (1997). Numerical simulation of the gas-solid flow in a fluidized bed by combining discrete particle method with computational fluid dynamics, Chem. Eng. Sci., Vol. 52, pp. 2785-2809.
22- Hoomans, B.P.B., Kuipers, J.A.M., Briels, W.J. and van Swaaij, W.P.M. (1996). Discrete particle simulation of bubble and slug formation in a two-dimensional gas- fluidized bed: a hard sphere approach, Chem. Eng. Sci., Vol. 51, pp. 99-118.
23- Dziugys, A. and Peters, BJ. (2001). An approach to simulate the motion of spherical and non- spherical fuel particles in combustion chambers, Granul Matter, Vol. 3, pp. 231. 24- Mio, H., Shimosaka, A., Shirakawa, Y. and Hidaka, J. (2005). Optimum cell size for
Segregation Behaviour of Particles in….. 121 25- Munjiza, A. and Andrews, K. R. F. (1998). NBS contact detection algorithm for bodies of
similar sizes, Int. J. Numer. Meth. Engng., Vol. 43, pp. 131-149.
26- Patanker, S.V. (1980). Numerical Methods in Heat Transfer and Fluid Flow, Hemisphere, New York.
27- Lacey, P. M. C. (1954). Developments in the Theory of Particle Mixing. J. Appl. Chem., Vol. 4, pp. 257.
28- Feng, Y. Q., Xu, B. H., Zhang, S. J., Yu, A. B. and Zulli, P. (2004). Discrete Particle Simulation of Gas Fluidization of Particle Mixtures. AIChE Journal, Vol. 50, pp. 1713-1728.