Tracing the science education graduates
Evangelista, Eden V.
Philippine Normal University, Philippines (evangelista.ev@pnu.edu.ph)
Morales, Marie Paz E.
Philippine Normal University, Philippines (morales.mpe@pnu.edu.ph)
Received: 6 July 2016 Revised: 1 August 2016 Accepted: 10 August 2016
Available Online: 18 August 2016 DOI: 10.5861/ijrse.2016.1566
ISSN: 2243-7703 Online ISSN: 2243-7711
OPEN ACCESS
Abstract
Retrospective analysis and evaluation through tracer studies is one of the most common ways
to self-initiated University’s self-evaluation scheme to determine adequacy, relevance and
alignment of its curricular offerings to the national and international standards for better
human resource of the country. The current tracer study determined the same domains through
descriptive survey design in order to evaluate the science education curricular program of the
graduate education offered by the country’s premier teacher education institution. With about
41% retrieval rate; data from the 15 outcomes or products of the aforecited program provided
the following:
satisfaction
(M=2.82) to
high satisfaction
(M=3.11, 3.38) with the University’s
facilities, services, and learning environment respectively; high extent of skill-use (
knowledge
and technical, research, problem-solving, human relations
) in their professional careers; and
strong agreement on adequacy (M=4.29) and relevance (M=4.17) of the curricular program.
Though the products of the program highly regard the program for its relevance and adequacy,
more improvement is seen to be done on the other aspects such as the number of graduates
produced each year to compensate and fill in the big gap produced by the curricular transition
in the national scene. Better mobility may also be achieved if the programs would consider
ASEAN and international touch.
Tracing the science education graduates
1. Introduction
Most countries aspire for a global competitive edge and international visibility dictated by the global competitive index in which the economic, efficiency and innovation competence of the countries are assessed against the standards and ranked among the countries. Countries like Switzerland, Singapore and the United States remain at the top posts with best results in all the pillars of the global competitive index (Schwab, 2015). The Philippines still ranked 59th – low rank compared to its Asian counterparts, although reported to have advanced by six positions with positive trends across most dimensions, especially in the institutions pillar. These results suggest that the country might need to revisit and further strengthen all global competitiveness pillars for better outcomes.
In the field of education, contributory factors to a better global competitive edge lies primarily in the first pillar – education and skill development. It is in this pillar that dimensions of countries such as access, equity and quality are assessed and ranked. Thus, most countries including the Philippines put premium to all these three dimensions, especially the aspect of quality. Researchers claimed that ‘quality’ is very hard to define. Several attempts to define this term led to some thoughts such as the degree of excellence and the high level of value or excellence (“Quality”, 2015). Several experts further described the term through other constructs such as quality assurance. Church (1988) described quality assurance as not about specifying the standards or specifications against which to measure or control quality. It is about ensuring that there are mechanisms, procedures and processes in place to ensure that the desired quality, however defined and measured, is delivered. In higher education, quality assurance, based on UNESCO Regional Report of Asia and the Pacific refers to systematic management and assessment procedures to monitor the performance of institutions. Thus, quality embodies a lot of aspects in the field of education alone, including infrastructure, facilities, service to the community, academic environment, staffing, research, scholarship, curricula, student mobility, curricular outcomes and employability of graduates, suggesting that tracing the institutions’ alumni may provide internal self-evaluation which is vital for enhancing the quality and global competitiveness of the country.
Accordingly, institutional self-evaluation can be provided by graduate tracer studies (Gines, 2014). In fact, Egesah, Wahome, Langat, and Wishitemi (2014) argued that such studies assess intra-university needs where intrinsic opportunities, challenges and training relevance are revealed and used. In effect, Egasah’s group claimed that this intra-university evaluation through tracer studies may significantly improve study conditions and programs to bring about better quality education and better graduate access to the local or global labor market. Thus, the current study seeks to collect information on how well the graduates of the graduate college are doing in the labor market; get feedback from the graduates to upgrade and enhance the graduate college of the Philippine’s premier teaching institution to meet the labor demands; to inform the labor market and policy planners.
2. Literature Review
2.1 Quality Science Education Educators
benchmarked among universities in the region. In 2012, further regional efforts to seek ‘quality’ emerged through the development of the ASEAN Qualifications Reference Framework (AQRF), which is envisioned to function as a device that will enable comparisons of qualifications across ASEAN member states which will be able to direct education and training sectors and provide wider objectives in promoting lifelong learning (AQRF, 2012). Purposely, AQRF enables comparison of qualifications across member countries who are tasked to: “1) support recognition of qualifications; 2) encourage the development of qualifications frameworks that can facilitate lifelong learning; 3) encourage the development of national approaches to validating learning gained outside formal education; 4) promote and encourage education, learner, and worker mobility; 5) direct to better understood qualifications systems; and 6) promote higher quality qualifications systems.”
In response to the ASEAN initiative on quality assurance, the country established the Philippine Qualification Framework (PQF, 2012) to attune all efforts to the regional and global contour. The framework intends to: “1) adopt national standards and level for outcomes of education; 2) support the development and maintenance of pathways and equivalencies which provide access to qualifications and assist people to move easily and readily between the different education and training sectors and between these sectors and the labour market; and 3) align the PQF with international qualifications framework to support the national and international mobility of workers through increased recognition of the value and comparability of Philippine qualification.” These PQF objectives set the tone for all education sectors to make detailed descriptors for each qualification level based on learning standards in basic education; competency standards of training regulations; and the policies and standards of higher education academic programs. Thus, PQF’s vision, mission and goals channeled the Philippine higher education system to contribute to nation building through quality human resource development, productivity and global competitiveness. Consequently, Philippine universities and colleges are mandated to produce quality graduates with high levels of academic, thinking, behavioural, and technical skills/competencies.
With this regional and national mandate, the Commission on Higher Education (CHED) instigated the CHED Memorandum Order (CMO) No. 46, series 2012, entitled, also called Policy-Standard to Enhance Quality Assurance (QA) in Philippine Higher Education through an Outcomes-Based and Typology-Based QA. This system discussed the role of the state in providing quality education to its citizens as a consequence of the internal capacity of institutions to translate policies into quality programs and results articulating the desired quality outcomes of education. As defined by the commission (CHED, 2012), the higher education institution’s fiat puts premium to the quality of learning environment, the institutions provide to develop the set attributes of ideal graduates who can bring heaps of improvement to the country and uplift the country’s global competitiveness index to a better post. Pursuant to these visions and goals for the higher education institutions as mandated by the outcomes-based and typology-based quality assurance, tracing the graduates of the institution provides a self-initiated evaluation and monitoring of the degree and excellence of graduates as outcomes of curricular programs of institutions. With the tracer system, institutions may view how they may still contribute to filling the gaps in the science education work force.
2.2 Tracer Study of Science Educators in the Philippines
A report of a local newspaper (“Science Education Realities”, 2014) retold that there is a very small fraction of teachers in the basic education that are assessed as qualified and are capable to teach science and mathematics courses. Although these numbers have already increased through the efforts of the government such as scholarships, there is still a need for programs to build a strong human resource for the country.
graduates which match or otherwise the job skills requirements. Similar investigations highlight the graduates’ perceptions on the different aspects of their curriculum such as subject sequencing (Canizarez, 2015); instruction, student service, community extension, linkages and research (Macatangay, 2013); and a transition from college to work place (Heidemann, 2011). All of which are viewed by many tracer studies as contributory to address one of the most prevalent issues – shortage of quality human resource (Pemba et al., 2012).
This lack of quality human resource is also seen as a major deterrent to the country’s success in education which makes the country lag behind others in global competitiveness. In a local newspaper, Malipot (2015) reported that more than 57 thousand teachers are needed to fill vacant teacher posts in the country due to curricular transition. More than half of this figure represent the needed math and science teachers to provide quality science and math education and motivate more citizens to choose science and math careers to ease up the country in the currently low rate (165 per million) of science and technology professionals for every one million citizens (Malipot, 2014). Still in the report, efforts of government include distribution of resources to schools, creations of job posts for teachers, scholarships, and more funds. In higher education, better curricular programs; attractive skill development offerings that reflect market-driven demands improved through tracer investigations may motivate more students in the field of science and mathematics education.
3. Framework of the Study
The country’s premier teacher education institution also known as the national center for teacher education has produced leaders, managers, educators, and empowered teachers of the country. The University, through the College of Graduate Studies and Tearcher Education Research (CGSTER) conducted a tracer study to determine its performance from SY 2003-2013. The study tracked the biographical data (personal data, educational background, employment characteristics, employment history, professional achievements); professional transition; and the retrospective evaluation of the program which includes the satisfaction with the services, learning environment/ climate, facilities, adequacy of skills learned, and the adequacy and relevance of the graduate curricular programs. These data are indispensable in providing information about the quality of graduates produced, which later on could be used as bases for the improvement of the graduate programs for science education. Curricular programs need to be evaluated to find out if they produce the quality of graduates that it intends to produce. Thus, the findings of this study could be used in the evaluation/revision of the programs. Below are the needed constructs and domains in evaluating the programs through from the graduates’ perspectives.
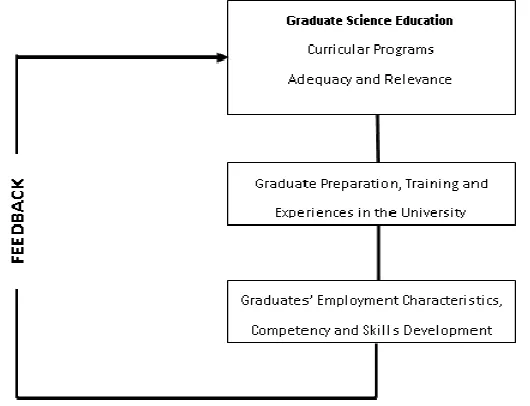
Figure 1. The conceptual model of the study
programs of the national center for teacher education provided in the preparation/training and experiences of the graduate students which will be manifested in the quality of graduates that the Univesity will produce. The results of this tracer study, which the study aims to achieve can then be used to gather necessary feedback that could be used in the improvement of the graduate science curricular programs, to be able to produce graduates who are globally competitive.
3.1 Purposes of the Research Study
This study traces the outcomes of the University’s curricular programs to determine how effective these science graduate curricular programs are. Specifically, the study sought answers to the following questions:
What is the profile of the graduates in terms of employment and transition to employment?
What are the graduates’ level of satisfaction with the University’s services, learning environment and facilities?
What is the extent to which the graduate curricular programs contributed to the development of the graduates’
communication skills; human relations skills; leadership skills; problem solving skills; and research skills?What is the degree of adequacy and relevance of the university’s curricular programs?
3.2 Methodology
This study used the descriptive survey design, specifically a retrospective survey research to investigate the graduates’ experiences in the national center for teacher education’s College of Graduate Studies and Teacher Education Research that occured in their past encounter with the University as post-graduate students. Participants in this study included 37 post –graduate (Master of education, science; Master of Arts in Science Education, and Doctor of Philosophy in Science Education) students in science education from March 2003 – March 2013. As aforementioned, a really small number of professionals go into the science and technology field much less the post-baccalaureate level.
The revised standard tracer study instrument designed by the University collected data from the participants on the following aspects: 1) students’ profile (personal data, educational background, employment characteristics, employment history, professional achievements, and school to work transition; and 2) retrospective evaluation of the program (the satisfaction with the services; learning environment/climate, facilities; adequacy of skills learned; adequacy and relevance of the curricular program).
Sending copies of the survey instruments to the 37 identified participants initiated the data collection process. Follow ups and retrieval of the instruments through mails, social media , sms and phone calls provided about 41% retrieval of data considering that these participants are already professionals (most of them are classroom teachers and others hold posts in the local education system) and may be experiencing several workloads too. Analysis of the data extracted included appropriate descriptive statistics to show trends in data and extract probable concerns, issues and inputs to the curricular programs being evaluated.
4. Results and Discussion
employment status, characteristics and transition; their perceived satisfaction with the services, learning environment and facilities; adequacy of skills learned; and adequacy and relevance of the curricular program.
4.1 Participants’ Profile
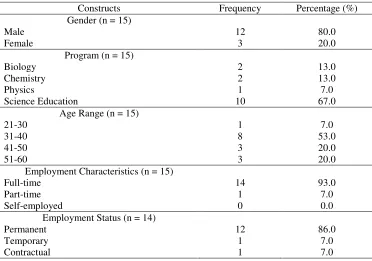
Table 1 presents valuable information about the participants that qualified them to be purposely chosen to do retrospective survey to evaluate the curricular programs which they took at the University as part of their professional growth and development.
Table 1
Participants’ profile
Constructs Frequency Percentage (%)
Gender (n = 15)
Male 12 80.0
Female 3 20.0
Program (n = 15)
Biology 2 13.0
Chemistry 2 13.0
Physics 1 7.0
Science Education 10 67.0
Age Range (n = 15)
21-30 1 7.0
31-40 8 53.0
41-50 3 20.0
51-60 3 20.0
Employment Characteristics (n = 15)
Full-time 14 93.0
Part-time 1 7.0
Self-employed 0 0.0
Employment Status (n = 14)
Permanent 12 86.0
Temporary 1 7.0
Contractual 1 7.0
Based on Table 1, 41% retrieval rate provided 12 male participants and three female participants. Most of these participants (53%) belong to the 21-40 age range. The majority of them took the Science Education track (67%) and the least number of participants belong to the field of Physics (7%). This result is not far from the Department of Science and Technology-Science Education Institute (DOST-SEI) reports as presented by Tan (2006): only 1.9% take Physics Education in the masters degree, 2.7% in Biology Education, 3% in Chemistry Education, 4.2% in General Science Education, and 9% in Mathematics Education compared to the big 78.6% who take post-baccalaureate non Science education courses. The majority of these professionals in post-baccalaureate programs are employed on full-time status (93%) and occupying permanent positions (86%) in their respective schools. Accordingly, these participants identified several reasons for choosing the University as their home of professional growth. Predominantly, 38% of them chose the University because of its prestige; affordable fees (31%) as a state-owned institution; and the prospect for career advancement (20%). Others find the location (8%) as an advantage to them. From these profiling data, it is particularly observed that stakeholders who chose the University for their Professional Advancement and who graduated from the University have good standing in terms of several personal and professional constructs which may provide valid and reliable retrospective evaluation of the programs they have grown with professionally.
Table 2
Employment and Transition of Participants
Constructs Frequency Percentage (%)
Eligibility (n = 15)
Licnsure Exam passer 15 100.0
Non-eligible 0 0
Transition and Promotion in Employment (n = 15)
Right after graduation (post-graduate) 6 40.0
Less than a year 3 20.0
More than a year 6 40.0
Process of Promotion (n = 15)
By application 8 53.0
Policy of the school 6 40.0
Political appointment 1 7.0
Problems Encountered after graduation (n = 13)
High expectation 3 30.0
Politics in the work place 2 13.3
Additional workload (appointment as head, research activities, speaking engagement)
7 46.7
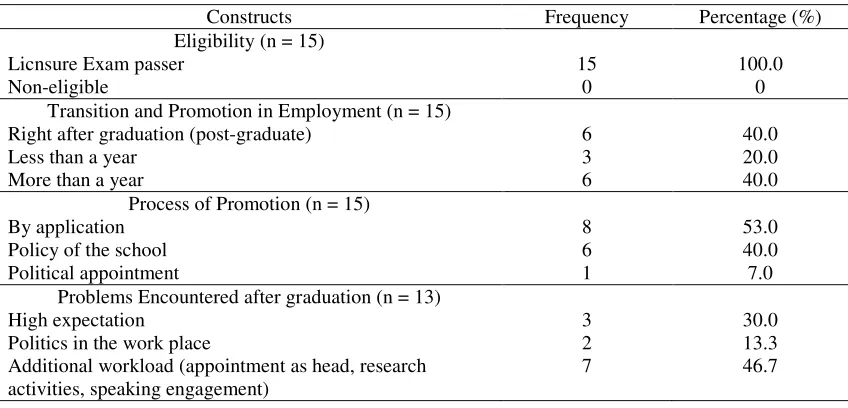
Table 2 shows that all participants are licensed teachers. About 60% of them were able to land on a teaching post either right after graduation or in less than a year from the time of their graduation. They also experienced transition through promotion in several means and paths. More than half (53%) applied for promotion, while 40% were promoted due to school policy. Higher degree obtained, however, by the participants brought about several problems after graduation. The majority (76.7%) encountered work-related problems such as living up to the higher expectations of superiors and stakeholders and additional workloads such as being appointed as head of a school department, research mentor and initiator of research and professional development projects and invitations to speaking engagement. This claim, however, by the teacher-participants contradicts earlier reports of Alontaga and Durban (2013) that there is no statistical significant differences in stress exist between those respondents who obtained only baccalaureate degree or Master’s degree or with a PhD. Thus, their report highlights that the stress experienced by teachers is not influenced or affected by the level of their education. Their result is similar to the report of Samad, Hashim, Moin, and Abdullah (2010) and Sabanci (2011) which revealed that there is no significant association between stress and educational level which contradicts most of the participants’ claim. This contradiction may be attributed to the variation in the years of experience of the participants. Most of them are within the 31-40 year-old range which may mean that they are within the 10 - 20 years range of teaching experience, which according to Sabanci’s (2011) reports these teachers have higher levels of stress as compared to those who worked for 21 years and more. Thus, explains the aforementioned contradiction on the level of education and stress, which are experienced by teachers after completing their post-graduate degrees of the University.
4.2 Retrospective Evaluation of the Curricular Program
Table 3
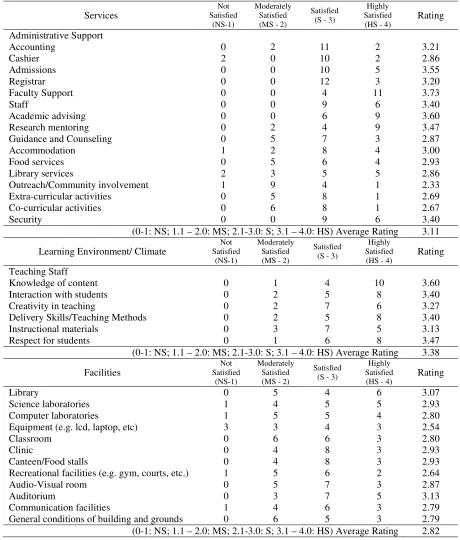
Participants’ Satisfaction with the Services, Learning Environment/ Climate, Facilities
Services Not Satisfied (NS-1) Moderately Satisfied (MS - 2)
Satisfied (S - 3)
Highly Satisfied (HS - 4)
Rating
Administrative Support
Accounting 0 2 11 2 3.21
Cashier 2 0 10 2 2.86
Admissions 0 0 10 5 3.55
Registrar 0 0 12 3 3.20
Faculty Support 0 0 4 11 3.73
Staff 0 0 9 6 3.40
Academic advising 0 0 6 9 3.60
Research mentoring 0 2 4 9 3.47
Guidance and Counseling 0 5 7 3 2.87
Accommodation 1 2 8 4 3.00
Food services 0 5 6 4 2.93
Library services 2 3 5 5 2.86
Outreach/Community involvement 1 9 4 1 2.33
Extra-curricular activities 0 5 8 1 2.69
Co-curricular activities 0 6 8 1 2.67
Security 0 0 9 6 3.40
(0-1: NS; 1.1 – 2.0: MS; 2.1-3.0: S; 3.1 – 4.0: HS) Average Rating 3.11
Learning Environment/ Climate
Not Satisfied
(NS-1)
Moderately Satisfied (MS - 2)
Satisfied (S - 3)
Highly Satisfied (HS - 4)
Rating
Teaching Staff
Knowledge of content 0 1 4 10 3.60
Interaction with students 0 2 5 8 3.40
Creativity in teaching 0 2 7 6 3.27
Delivery Skills/Teaching Methods 0 2 5 8 3.40
Instructional materials 0 3 7 5 3.13
Respect for students 0 1 6 8 3.47
(0-1: NS; 1.1 – 2.0: MS; 2.1-3.0: S; 3.1 – 4.0: HS) Average Rating 3.38
Facilities Not Satisfied (NS-1) Moderately Satisfied (MS - 2)
Satisfied (S - 3)
Highly Satisfied
(HS - 4) Rating
Library 0 5 4 6 3.07
Science laboratories 1 4 5 5 2.93
Computer laboratories 1 5 5 4 2.80
Equipment (e.g. lcd, laptop, etc) 3 3 4 3 2.54
Classroom 0 6 6 3 2.80
Clinic 0 4 8 3 2.93
Canteen/Food stalls 0 4 8 3 2.93
Recreational facilities (e.g. gym, courts, etc.) 1 5 6 2 2.64
Audio-Visual room 0 5 7 3 2.87
Auditorium 0 3 7 5 3.13
Communication facilities 1 4 6 3 2.79
General conditions of building and grounds 0 6 5 3 2.79
(0-1: NS; 1.1 – 2.0: MS; 2.1-3.0: S; 3.1 – 4.0: HS) Average Rating 2.82
items in University services that included cashier services, guidance and counseling services, accommodation, food services, library services, outreach/community involvement, and extra- or co- curricular activities. These relatively low rating, but within the satisfied level also transpired in most of the University facilities (laboratories, equipment, classrooms, clinic, canteen, recreational facilities, function rooms, communication facilities, and general conditions of buildings and grounds). These may have been the rating of these participants as the school has undergone several transition periods due to change of management and administration (school leaders) for the past decade which may be viewed in the light of the findings of Kotter (1990) that abrupt changes in management and composition of school leaders may bring about upheaval and the staggered development of the organization. In fact, Sande, Walela, and Wamukoya (2015) reiterated Burnes’ (2004) report that in a transition management, the appropriate process for proper transitioning includes unfreezing the present level, moving to the new level and re- freezing this new level. In connection, the current study features the participants’ perceptions while experiencing transition management and major changes in the University officials which may hinder abrupt changes and progress as often expected by the participants. Nevertheless, the satisfied and the highly satisfied evaluation of the participants with the University services, learning environment and facilities are suggestive that in terms of outcomes, the participants were able to acquire the expected skills which they may be using in their professional career as educators. Table 4 provides the extent of use of the participants’ acquired skills.
Table 4
Participants’ Extent of Skill Use
Skills NA VLE LE TSE TGE
f % f % f % f % f %
Knowledge and Technical Skills
0 0% 0 0% 0 0% 6 40% 9 60%
Communication skills 0 0% 0 0% 2 13% 6 40% 7 47%
Human Relations skills 0 0% 0 0% 3 20% 4 27% 8 53%
Leadership skills 0 0% 0 0% 1 7% 8 53% 6 40%
Research skills 0 0% 0 0% 1 7% 2 13% 12 80%
Problem-solving skills 0 0% 0 0% 0 0% 6 40% 9 60%
Information Technology skills 1 7% 1 7% 2 13% 6 40% 5 33%
Note. VLE: Very Low Extent LE: Low Extent, TSE: To Some Extent, TGE: To a Great Extent
Table 4 shows the participants’ acquired skills and the extent of use of these skills in their work or professional environment. Accordingly, their research skills are mostly utilized in their current profession. As aforementioned, teaching and conducting research are considered as an expected work of those who completed their post-graduate degrees. Most supervisors and superiors look up to these teachers as very much acquainted with the processes and concepts of research that they are assigned to teach Science Investigatory Projects (SIP) or conduct action researches. Knowledge and technical skills, problem solving skills, and human relations skills are also used to a great extent by the majority of the participants which may be related to the subject which they teach. All of these participants teach science courses thus, these aforecited skills are prevalent in the classroom to deliver good science lessons. These claims are supported by American science teaching standards (National Research Council, 1998) and the framework for Philippine science teacher education (SEI-DOST & UPNISMED, 2011). Low utilization of information and technology skills and leadership skills presented in Table 4, may suggest recommendatory policies and guideline on how these may be developed further by the curricular program and be integrated into science teaching for better utilization. This may enhance adequacy and relevance of the program (Table 5) as directed by the framework (SEI-DOST & UPNISMED, 2011).
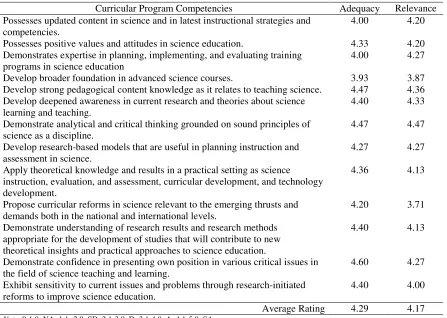
rated the following: updated content; instructional strategies;pedagogical knowledge; research knowledge and skills; attitudinal constructs to science as very high as they strongly agree to their adequacy and relevance as competencies in the curricular program. These are also evident as needed competencies in the American science teaching standards (National Research Council, 1998) and the framework for Philippine science teacher education (SEI-DOST & UPNISMED, 2011). It should also be noted that the participants provided lower rating on the following:
Developing broader foundation in advance science courses
Capability of the program to propose curricular reforms in science relevant to the emerging thrusts and demands both in the national and international levels.
These results may serve as inputs to enhance the curricular offering aligned to national and international standards. Revisions and improvements may provide better outcomes which will eleviate global and international competitive edge of the country in terms of education, institution and human resource.
Table 5
Adequacy and Relevance of Curricular Program (Science Education)
Curricular Program Competencies Adequacy Relevance
Possesses updated content in science and in latest instructional strategies and competencies.
4.00 4.20
Possesses positive values and attitudes in science education. 4.33 4.20 Demonstrates expertise in planning, implementing, and evaluating training
programs in science education
4.00 4.27
Develop broader foundation in advanced science courses. 3.93 3.87 Develop strong pedagogical content knowledge as it relates to teaching science. 4.47 4.36 Develop deepened awareness in current research and theories about science
learning and teaching.
4.40 4.33
Demonstrate analytical and critical thinking grounded on sound principles of science as a discipline.
4.47 4.47
Develop research-based models that are useful in planning instruction and assessment in science.
4.27 4.27
Apply theoretical knowledge and results in a practical setting as science instruction, evaluation, and assessment, curricular development, and technology development.
4.36 4.13
Propose curricular reforms in science relevant to the emerging thrusts and demands both in the national and international levels.
4.20 3.71
Demonstrate understanding of research results and research methods appropriate for the development of studies that will contribute to new theoretical insights and practical approaches to science education.
4.40 4.13
Demonstrate confidence in presenting own position in various critical issues in the field of science teaching and learning.
4.60 4.27
Exhibit sensitivity to current issues and problems through research-initiated reforms to improve science education.
4.40 4.00
Average Rating 4.29 4.17 Note. 0-1.0: NA; 1.1 -2.0: SD; 2.1-3.0: D; 3.1-4.0: A; 4.1-5.0: SA
Not Applicable (NA), Strongly Disagree (SD), Disagree (D), Agree (A), Strongly Agree (SA)
5. Conclusion and Recommendations
program.
Considering all these aspects of assessing a curriculum, the graduates of the University viewed the curricular offering as something that helped them in their professional careers. Most of these graduates transitioned to other teaching levels as their promotion after their graduation. Accordingly, they found all the skills they have acquired as useful in their current careers and they rated the majority of these skills as utilized to a great extent. They also found that the curriculum which they experienced in the University as adequate and relevantly significant in their professional development and progress. Thus, in terms of the aforementioned aspects, the science education curriculum of the University fairs well among the stakeholders providing them good amount of satisfaction. These satisfaction level and outcome of the graduates of the curricular program serve as indicators that the curricular program contributorily helps the country in developing quality human resource uplifting the University’s or institution’s state and thereby offers opportunities for better global competitive index through quality outcomes.
Self-assessment through retrospective evaluation by means tracer studies may provide efficient and fair assessment of the curricular program not just in the post-baccalaureate but also and vis-à-vis the baccalaureate. It is a means of evaluating the value of the curricular program against the national and international standards and framework through the lens of the curricular program’s products. It is an initial step towards developing and reconfiguring the curricular program to suit the needs of time. Tracing the graduates may even dictate the route that the curricular program may track while it tries to uniquely find its place in the national and global arena such as international partnership for internship, placing a touch of ASEAN curricular component to fully realize the expected integration and increase chances of student exchange and mobility among ASEAN nations. However, all these probable results may not be fully attained with a minimal number of response retrieval rates to assume validity of the retrospective analysis. Thus, the University must conduct all possible means to improve and increase response rates of the graduates. It may be that the University taps and strengthen its collaboration with the Alumni organizations to improve studies of this kind for better assessment and improved curricular programs in the long run.
Acknowledgement - This study has been reviewed and approved by the institutional review board (Educational Policy Research and Development Center) and the research ethics committee as a Full Professor research compliance.
6. References
ASEAN Qualifications Reference Framework. (2012). About AQRF. Retrieved from http://kkni-kemenristekdikti.org/asset/pdf/1-AQRF_General_Information.pdf
Burnes, B. (2004). Kurt Lewin and the planned approach to change: A re-appraisal. Journal of Management Studies, 41(6), 977–1002. http://dx.doi.org/10.1111/j.1467-6486.2004.00463.x
Cañizares, M. J. F. (2015). Tracing University of San Carlos’ science and mathematics education graduates: How well are we in developing teacher professionals? International Journal of Research Studies in
Education, 4(2), 69-86.
CHED Memorandum Order (CMO). (2012). CMO No. 46, Series 2012, Policy-Standard to Enhance Quality Assurance (QA) in Philippine Higher Education through an Outcomes-Based and Typology-Based QA. Retrieved from http://www.ched.gov.ph/wp-content/uploads/2013/07/CMO-No.46-s2012.pdf
Church, C. H. (1988). The qualities of validation. Studies in Higher Education, 13, 27-43. http://dx.doi.org/10.1080/03075078812331377945
Durban, J. M., & Alontaga, J. V. (2013) A self – assessment of the professional stress among elementary school teachers. European Social Sciences Research Journal, 1(1), 19- 28.
International Academic Research for Multidisciplinary, 2(8), 305-325.
Heidemann, L. (2011). Only Successful Graduates Respond to Tracer Studies: A Myth? Results from the German Cooperation Project Tracer Studies. Almalaurea Working Papers, 3, 1-14.
Kotter, J. P. (1990). A force for change: How leadership differs from management. San Francisco: Jossey-Bass. Macatangay, L. (2013). Tracer study of BSCS graduates of Lyceum of the Philippines University from
2004-2009. Academic Research International, 4(5), 361-377.
Malipot, I. H. (2014, April 22). DepEd solving Math, Science teacher shortage. Manila Bulletin. Retrieved from http://www.mb.com.ph/deped-solving-math-science-teacher-shortage/
Malipot, M. (2015, June 3). DepEd hit for same old problems: Lack of teachers, classrooms. Manila Bulletin. Retrieved from http://www.mb.com.ph/deped-hit-for-same-old-problems-lack-of-teachers-classrooms/ Mercado, F. M. (2010). A tracer study of MSUEF graduates (Unpublished Masteral thesis). College of Arts and
Sciences, Institute of Graduate Studies and Research Envarga University.
Mugwisi, T., & Hikwa, L. (2015). A tracer study of master of science in library and information science graduates from the National University of Science and Technology, Bulawayo, Zimbabwe. African Journal of Library, Archives & Information Science, 25(2), 173-183.
National Research Council. (1998). National Science Education Standards. Retrieved from http://www.nap.edu/read/4962/chapter/1
Pemba, S., Macfarlane, S. B., Mpembeni, R., Goodell, A. J., & Kaaya, E. E. (2012). Tracking university graduates in the workforce: Information to improve education and health systems in Tanzania. Journal of Public Health Policy, 33(Suppl 1), 202-215. http://dx.doi.org/10.1057/jphp.2012.48
Philippine Qualifications Framework (PQF). (2012). About PQF. Retrieved from http://ceap.org.ph/upload/download/20138/2723637531_1.pdf
Quality. (2015). Retrieved from http://www.merriam-webster.com/dictionary/quality
Ramirez, T. L., Cruz, L. T., & Alcantara, N. V. (2014). Tracer study of RTU graduates: An analysis. Researchers World Journal of Arts, Science and Commerce, 5(1), 66-76.
Sabanci, A. (2011). The effect of teachers’ stress on educational organizations’ health. International Journal of Business and Social Science, 2(11), 91-100.
Samad, N. I. A., Hashim, Z., Moin S., & Abdullah, H. (2010). Assessment of stress and its risk factors among primary school teachers in the Klang Valley, Malaysia. Global Journal of Health Science, 2(2), 163–171.
Sande, O. A, Walela, K. B., & Wamukoya, O. (2015). Change management and performance of public secondary schools in Siaya Sub county. International Journal of Scientific & Technology Research, 4(4), 162-174. Schwab, K. (2015). The Global Competitiveness Report 2015–2016. World Economic Forum. Retrieved from
http://www3.weforum.org/docs/gcr/2015-2016/Global_Competitiveness_Report_2015-2016.pdf Science education realities. (2014). Retrieved from
http://www.manilatimes.net/science-education-realities/100096/
SEI-DOST & UP NISMED. (2011). Framework for Philippine science teacher education. Manila: SEI-DOST & UP NISMED.
Shongwe, M., & Ocholla, D. (2011, March 9-11). A tracer study of LIS graduates at the University of Zululand, 2000–2009. Paper presented at the 6th Biennial ProLISSA, Pretoria, South Africa, University of Zululand.
Tan, M. (2006, February 9). Improving the quality of science and mathematics education by enhancing teachers' quality. Panel Presentation on Japan Education Forum III.
The free dictionary. (n.d). Retrospective study. Retrieved from