University of New Orleans University of New Orleans
ScholarWorks@UNO
ScholarWorks@UNO
University of New Orleans Theses and
Dissertations Dissertations and Theses
Summer 8-6-2013
Two Essays on the Efficiency, Diversification, and Performance of
Two Essays on the Efficiency, Diversification, and Performance of
Financial Institutions
Financial Institutions
Abu Khan
Follow this and additional works at: https://scholarworks.uno.edu/td
Part of the Finance and Financial Management Commons
Recommended Citation Recommended Citation
Khan, Abu, "Two Essays on the Efficiency, Diversification, and Performance of Financial Institutions" (2013). University of New Orleans Theses and Dissertations. 1694.
https://scholarworks.uno.edu/td/1694
This Dissertation-Restricted is protected by copyright and/or related rights. It has been brought to you by ScholarWorks@UNO with permission from the rights-holder(s). You are free to use this Dissertation-Restricted in any way that is permitted by the copyright and related rights legislation that applies to your use. For other uses you need to obtain permission from the rights-holder(s) directly, unless additional rights are indicated by a Creative Commons license in the record and/or on the work itself.
This Dissertation-Restricted has been accepted for inclusion in University of New Orleans Theses and Dissertations by an authorized administrator of ScholarWorks@UNO. For more information, please contact
Two Essays on the Efficiency, Diversification, and Performance of Financial
Institutions
Dissertation
Submitted to the Graduate Faculty of the
University of New Orleans
in partial fulfillment of the
requirements for the degree of
Doctor of Philosophy
in
Financial Economics
by
Abu Nahian Faisal Khan
B.Sc. (Hons.) University of Windsor, Canada, 2002
M.A. Ryerson University, Toronto, Canada, 2007
ii
Dedication
** I would like to dedicate my dissertation to my parents, my wife and my son, without their supports it would not happen.
** I would also like to thank my dissertation Co-chair Dr. Kabir Hassan and Dr. Neal Maroney for their guidance and advice throughout the process. My sincere thanks to my committee members for their feedback.
iii
Table of Contents
List of tables………..iv
Abstract ... v
Chapter 01: Efficiency, Value Addition and Performance of US Bank Mergers ... 1
1.1. Introduction ... 1
1.2. Literature Review on Merger and Acquisions ... 3
1.3. Data and Methodology ... 7
1.3.1. Sample Description ... 7
1.3.2. Performance Measure ... 8
1.3.2.1. Accounting Measure ... 9
1.3.2.2. Economic Value Added ... 9
1.3.2.3. Efficiency Measurement ... 11
1.3.3. Regression Analysis ... 13
1.4. Results and Main Findings ... 15
1.5. Conclusion ... 31
References ... 33
Chapter 2: Efficiency, Diversification, and Performance of Financial Institutions ... 38
2.1. Introduction ... 38
2.2. Literature Review ... 41
2.3. Hypothesis... 44
2.4. Model ... 45
2.5. Data and Methodology ... 47
2.5.1. Measures of Activities ... 47
2.5.2. Measures of Diversity ... 48
2.5.3. Bank-Level Performance: Tobin’s Q, Activity-Adjusted q, and Excess Value ... 49
2.5.4. Efficiency Measures ... 51
2.5.6. Other Bank-Level Variables ... 52
2.6. Empirical Results ... 54
2.7. Conclusion ... 58
References ... 60
iv
List of tables:
Table 1: Descriptive Statistics of merger and acquisitions ... 15
Table 2: Profitability, Expense, and Asset Quality Ratios ... 17
Table 3: Acquirer Changes in Pre- and Post-merger Accounting Ratios ... 18
Table 4: Correlation Coefficient of Various Performance Metrics ... 19
Table 5: Average Change in Pre-and Post-merger Operating Profit ... 21
Table 6: Average Change in Acquirer Various Pre-and Post-merger Acquirer Efficiency Scores ... 23
Table 7: Average Performance Metrics of Geographic and Product Focus Versus Geographic and Product Diversification... 25
Table 8: Changes in Economics Value Added ... 27
Table 9: Results of the Regression Analysis-Accounting Performance ... 29
Table 10: Results of the Regression Analysis-Efficiency Scores ... 30
Table 11: Sample characteristics of Bank Holding Companies ... 666
Table 12: Reduced form individual and time effects OLS ... 677
Table 13:Individual and time effects-OLS systems estimation with alternative efficiency metrics and asset-based measures ... 688
Table 14 : Individual and time effects-2SLS systems estimation with alternative efficiency metrics and asset-based measures ... 7171
v
Abstract
In the first chapter I investigate the change in operating performance, efficiency and value addition of US bank merger and acquisition after GLBA. I extend the previous research by combining all the previous methodology used in merger literature and added a new methodology namely Expected EVA improvement. I will test whether these performance metrics have similar results or the performance of merger vary depending on the measurements. I will also examine the factors that have significant impact on the change in the banks’ performance.
My results show that industry-adjusted operating performance of merged banks increases significantly after a merger. I also find that the acquirer expected EVA improvement increase significantly after the merger. Revenue enhancement opportunity appears to be more profitable if there exist more opportunity for cost cutting such as geographic focus and diversified merger. Product diversification merger increase the industry adjusted performance more than product focused merger. The efficiency or profitability of targets has either positive or no effect change in acquirer performance.
In the second chapter I examine how diversifying away from traditional lending activity into noninterest income has affected banks efficiency and value. Does this activity or product diversification affect the bank’s production efficiency and excess value? How does this efficiency translate into excess value for the firm or how excess value increase is related to diversification and efficiency? I find that diversifications significantly reduce the value of banks measured in excess value and vice versa regardless of which measures diversification or excess value I use. Both revenue and asset diversification also significantly reduce all measures of efficiency scores. But the impact of efficiency on diversification is mixed. Only efficiency scores computed based on variable return to scale have negative on revenue diversification and other efficiency scores have no impact on diversifications. I also find that increasing efficiency will increase the excess value of the banks significantly and vice versa. So increasing diversification will reduce the excess value and hence will lower the excess value or BHC with lower diversification will have lower excess value and are more efficient.
JEL Classification : G21, G28, G30, G34
1
Chapter 01: Efficiency, Value Addition and Performance of US Bank Mergers
1.1. Introduction
Bank mergers and acquisitions (M&A) have been a trend in the US since the mid-1980s. This bank consolidation process was accelerated with the passing of the Riegle-Neal Interstate Banking and Branch Efficiency Act (1994) and the Gramm-Leach-Bliley Act of 1999 (GLBA), or Financial Service Modernization Act. These acts removed the restrictions on interstate banking and the barriers between depository institutions and securities and insurance firms. The GLBA presented US banks the opportunity to shift away from lending activities toward broader financial services and opened the way for full financial integration or universal banking. According to most practitioners and academics, the process of banking integration is far from complete; this trend is expected to continue and become more comprehensive1. Berger et al. (1999) argue that M&A are banks’ strategic answer to a regulatory environment. This consolidation is largely motivated by the fact that the acquirer can improve performance through economies of scale and scope, revenue enhancement, cost reduction, cost and profit efficiency, increased market power, and reduced earnings volatility. Although the number and size of mergers within the banking industry have steadily increased, there is little consensus regarding theimpact of consolidation on industry performance. These mixed findings reflect the different methodologies used
in previous studies, but the high incidence of contradictory findings results from the differences in the
time period being studied. Much of the extant literature examines M&A data at early stages in the
industry consolidation process, mainly from the mid-1980s through the mid-1990s, and consequently may
have been observing disequilibrium or pre-equilibrium phenomena (DeYoung, Evanoff, & Molyneux,
2009). This raises the question of whether all bank M&A have a significant impact on bank performance or whether it is possible to differentiate the types of M&A that lead to significant gains from those that do not add value. The goal of this paper is to investigate the change in operating performance, efficiency, and
1 Source: Mishkin (1998) observes that regulatory and technological changes will allow banks to expand, and in twenty years, the number of
2
value addition of bank M&A after the GLBA. Following prior research, I will examine the operating
performance and efficiency of bank mergers. Then I will add a new measure, the Expected Economics
Value added (EVA) Improvement, which will interest both academic researchers and practitioners. I will
test whether these performance metrics have similar results or the performance of mergers varies
depending on the measurements. I will also examine the factors that significantly affect the change in the
banks’ performance. As there is little consent regarding the overall performance of M&A, I will also
extend our analysis to address the impact of activity- and geographically focused mergers versus activity-
and geographically diversified mergers.
In this paper, I will take a very simple route and define activity-focused mergers as when the two-digit standard industrial classification code (SIC) codes of the target and the acquirer are the same and if both the target and the acquirer are from the same state. I will call this type of merger a geographically focused merger. There appears to be a significantly different set of goals between a focused and a diversified merger. While cost savings is anticipated from focused mergers, revenue growth is usually the goal of diversified mergers. For example, in the year 2000, when Chase Manhattan Bank, a bank, acquired JP Morgan, a non-bank financial firm, the CEOs of both companies claimed the merger was driven more by revenue growth potential than by cost reduction (Cornett, McNutt, & Tehranian, 2006). This merger added diversification to Chase’s business in the form of equity underwriting, equity derivatives, and asset management—areas Chase had been trying to build by itself. Less than four years later, JP Morgan Chase acquired Bank ONE for almost twice the deal value of its earlier acquisition and claimed the combined entity was anticipating an annual cost savings of $2.2 billion2.
The financial gain from M&A can come either from improving market power or operating performance and efficiency. I will directly test the merger-induced operating performance and efficiency by comparing pre- and post-merger levels of financial ratios and non-parametric efficiency measures, namely input-oriented efficiency and output-oriented efficiency. To test if mergers create value for shareholders, I will compare pre- and post-merger expected EVA improvement. In addition, it is not
3
simple to determine if mergers attract two firms with similar activities; however, I can easily differentiate between banks whose last two-digit SIC code is different. For example, the SIC code is 6000 for depository institutions, 6100 for non-depository credit unions, and 6200 for securities and commodities brokers. Due to financial deregulation, the US banking industry is steadily shifting away from traditional sources of revenue, that is, loan making, toward nontraditional activities that generate fee income, service charges, trading revenue, and other types of noninterest income. Some of the reasons for commercial banks to acquire non-banks are regulatory changes, capital adequacy requirements, an increase in cost efficiency, revenue growth, and managers’ personal incentives.
Finally, I will test the relationship between the change in bank-performance and merger-related factors, along with other firm-level control variables that are found to be significant in affecting performance. Our merger data was collected after the GLBA was passed; hence, our entire merger sample will have a similar regulatory effect. I will consider a merger if the target size measured by total assets is greater than $100 million. Most of the literature on the US bank merger study sample periods falls between two regulatory regimes. For example, examining the sample period of mergers from 1996 to 2004 will provide biased results due to the differences in merger motivation before and after the GLBA. Our paper will overcome this issue. To our knowledge, no other study has explored the value addition of bank mergers by the expected EVA improvement methodology. This will be the main contribution of this research.
The rest of the paper is organized as follows. Section Two summarizes the literature review and highlights the main findings in this area. Section Three describes our data and methodology. Section Four analyzes our results, and Section Five concludes the paper.
1.2. Literature Review on Merger and Acquisions
4
performance. In this section, I review the portion of the literature most relevant to our work. Interestingly, some empirical evidence suggests the impact of M&A operations in the US banking industry have not improved performance (DeLong & DeYoung, 2007; Amel et al., 2004; Berger, Demsetz, & Strahan, 1999). Beccalli and Frantz (2009) investigated the effects of M&A on the performance of banks and explored the sources of merger-induced changes in performance. They used a sample of 714 deals involving European Union (EU) acquirers and targets throughout the world from 1991 to 2005. Their results show that M&A slightly deteriorate performance measured by return on equity, cash flow return, and profit efficiency and improve performance measured by cost efficiency. They attributed these changes in performance directly to M&As’ operations and argued that the changes would not have occurred in the absence of M&A. Hagendorff and Keasey (2009) found some evidence for a cost-cutting and revenue-enhancing strategy that entails an increase in both on- and off-balance sheet activities for US
mergers during the three years after a merger of European banks. They also discovered that a European
merger resulted in an increase of small performance gains for the acquirer during the post-merger period,
while a US merger did not result in any performance changes. Considering the impact of M&A on cost X-efficiency (Vander Vennet, 1996, 2002; Altunbas, Molyneux, & Thornton, 1997); the impact on profitability ratios such as ROE and ROA (Vander Vennet, 1996; Altunbas and Ibáñez, 2004); and the impact on profit X-efficiency (Huizinga et al., 2001; Vander Vennet, 2002), a handful of literature on M&As in the EU banking industry also seems to conclude that M&A seldom improve performances. By using a hybrid translog cost function Altunbas, Molyneux, and Thornton (1997) find limited opportunities for cost savings from big-bank mergers. An increase in total costs appears more likely. By using a sample of 492 M&A operations related to EU banks from 1988 to 1993, Vander Vennet (1996) shows that domestic mergers among equal-sized partners significantly increase the accounting profitability of the merged banks, while improvements in cost efficiency are observed only for cross-border acquisitions, not for domestic operations.
5
used 134 samples of US bank merger from 1990 to 2000 to examine the changes in overall industry-adjusted operating performance and long-run stock returns of commercial bank mergers. They also find large bank mergers produce greater performance gains than small bank mergers, activity-focusing mergers produce greater performance gains than activity-diversifying mergers, and geographically focusing mergers produce greater performance gains than geographically diversifying mergers. The performance gains were even larger after the implementation of full nationwide banking in 1997 via the Riegle-Neal Act. The improved performance results from both revenue enhancement and cost reduction activities.
6
Another way banks can achieve potential economies of scale is through geographical diversification, because once the basic infrastructure is in place, organizations can expand the system elsewhere at a potentially reduced cost. Benefits of geographical diversification include better access to capital markets in other regions or countries, which potentially leads to reduced cost of capital (Deng and Elyasiani, 2008), greater market power (Iskandar-Datta and McLaughlin, 2007), and reduced tax liabilities because geographically diversified banks can transfer resources from high-tax to low-tax areas. Gleason et al. (2006) examined market reaction to mergers between banks and non-banks and joint ventures from 1980 to 1998.They discovered that, in both cases, the market responds favorably and product market expansion provides value-enhancing opportunities to US banks.
Maretno , Ha-Chin , and Chotigeat (2010) demonstrated that, when a bank merges with a non-bank, subsequent annualized stock returns are diminished by 2%, but the same choices do not significantly produce abnormal returns during the two days before and two days after the announcement dates. This finding was consistent with those of previous studies (DeLong, 2001; 2003), which found that focusing mergers among banks are more value enhancing to shareholders than diversifying mergers.
Altunbas and Marques (2008) showed improvements in performance after a merger particularly in cross-border M&As; broad similarities between merging partners are also conducive to improved performance. Berger (2000) and Hughes et al. (1999) argue that most of the efficiency gains from mergers are on the revenue side, arising through asset diversification. Value creation from market-related considerations has also been reported in US markets. Kane (2000) found that mergers are likely to generate value when the target bank is a large deposit institution and when both firms are headquartered in the same US state.
Some explanations for this puzzling evidence are the following:
The absence of best-practices guidelines for planning and executing increasingly large and complex acquisitions (DeLong & DeYoung, 2007),
7
The longer time (up to five years) needed to realize efficiency gains, leading to more favorable prices for consumers (Focarelli & Panetta, 2003),
The difficulties of integrating broadly dissimilar institutions (Altunbas & Ibáñez, 2004; Vander Vennet, 2002),
Increased costs associated with changes in post-merger risk profiles, and Business strategies (Demsetz & Strahan, 1997; Hughes et al., 1999).
Nevertheless, all the above studies refer to the overall change in performance by comparison in a dynamic analysis (according to the definition by Berger, 1998 and 1999) of the post-M&A performance with the pre-M&A performance. However, some of this difference could be due to a continuation of firm-specific performance before the merger or economy-wide and industry factors, as stated by Healy et al. (1992).
1.3. Data and Methodology
1.3.1. Sample Description
The data set was obtained by combining three sources: Thomson ONE Banker M&A for data on M&A operations, Bankscope for balance sheet and income statement of the banks involved in M&A operations (M&A sample), and the CRSP/Compustat database for market-level data. My sample comprises M&A deals announced between 1/1/1999 and 31/12/2009 in which the acquirer is a US public Bank Holding Companies (BHC) and the target is a bank operating in the US. The initial M&A sample refers to 1,264 mergers. To be included in our sample, M&A must fulfill the following criteria:
1. The merger should not involve any federal government assistance.
2. The target banks must have at least $100 million dollar in asset book value at the time of the merger announcement. That reduces our sample from 1,264 to 555 mergers.
3. The acquirer and target bank can be involved in no other merger in the year before and after the merger in questions, which leaves 311 mergers.
8
5. I eliminate those merger samples for those we had missing values either for acquirer or target. Finally, I found 79 mergers.
1.3.2. Performance Measure
One measure I use to evaluate the M&A performance is the operating profitability of an average asset. Healy et al. (1992), Cornett et al. (1998, 2006), and Hagendorff et al. (2009) used similar metrics as pretax operating cash flows divided by the book value of each asset. Conversely, accounting measures relying on return on asset (ROA) and return on equity (ROE) will include general interest expenses, which are influenced by both the method of accounting (pooling vs. purchasing)3 and takeover finance (cash vs. equity)4. Those measures will allow limited inferences about the changes in economic performance4. Hence, I use the EVA method that overcomes the suspicious aspect of using operating profitability to estimate performance.
Although accounting ratios are useful performance indicators, they have been criticized for not accurately reflecting real changes of the firm in the long run, especially when they are subject to manipulation (Berger et al., 1994; DeYoung, 1997; Bauer et al., 1998; Berger et al., 1999; and Kohers et al., 2000). The rapid evaluation of both parametric and non-parametric efficiency methodologies made the traditional techniques obsolete in the study of bank performance. Despite the intense research effort, there is no consensus on which method is the best. Regardless of the method used to estimate efficiency scores, they should be consistent in their efficiency levels and ranking. The method should be able to identify the best and worst firms and be consistent over time and with competitive market conditions. Following Al-Sharkas, Hassan, & Lawrence (2008), I chose to use the non-parametric Data Envelopment Analysis (DEA) methodology to estimate input- and output-oriented efficiency.
3
Source: Healy, Palepu, & Ruback (1992).
9
1.3.2.1. Accounting Measure
I use operating profitability over average asset to measure accounting performance. The benefit of using this measure is that it excludes the effect of interest on debt used as capital financing by the bank. To measure pre-merger pro forma performance, I combine the operating performance of target and acquirer. Following Cornett et al. (2006), the performance of the combined banks is the weighted average of values for the target and acquirer, where the weights are the relative sizes of the two firms at the end of the year before the merger. Following the same method, I also obtain the industry-adjusted operating performance for both the target and the acquirer. Then I compute the difference between year-end operating profitability of the acquirer one year after the merger and operating profitability of the pre-merger proforma year-end operating performance one year before the pre-merger.
1.3.2.2. Economic Value Added
Sirower and O’Byrne (1998) developed the Economic Value Added equation (EVA) methodology for forecasting and evaluating post-acquisition operating performance both for corporate practitioners and researchers. From a performance evaluation perspective, when an acquirer takes over a target, the past essentially becomes irrelevant. Performance should be forward looking. A firm with a stellar past can lose market value if it fails to meet market expectations. Hence, the main challenge would be to develop a post-acquisition benchmark to determine what level of performance the market was expecting before the transaction was announced (Sirower et al., 1998). They separated the known components of the market value from the expectational components. This was the main idea behind their methodology. They broke the total market value of the firm into its known and expected components:
1 ∆
1
10
0, c is the weighted average cost of capital, and ∆EVAt is the expected EVA improvement in Year t. The EVA0 is derived as follows:
The NOPAT0 is net operating profit after tax at the end of Year 0. Capt-1 is book capital at the beginning of Year 0. The cost of capital is derived as
! 1 " !"
where wd is the weight of debt, we is the weight of equity, Kd is the cost of debt before tax, T is the tax rate, and ke is the cost of equity derived from Capital Asset Pricing Model (CAPM).
: !" $% &$' $%( )*
where rf is the risk-free interest rate, rm is market return, and )* is the beta of the firm.
To measure the future growth value (FGV) that is the capitalized present value of the expected annual EVA improvements in Equation 1, I will rewrite that as:
+,
The EVA will only provide a cost of capital return on current operation value. Hence, the EVA improvement is required to earn a cost of capital return on the Future Growth Value (FGV) to get a cost of capital return on total market value. The expected EVA improvement must satisfy the following:
∆ ∆ ∆+, +,
where EVA1 is actual EVA improvement,∆-./0 is the capitalized actual EVA improvement, ∆FGV1 is the
change in FGV, and c*FGV0 is the cost of capital return on FGV.
To provide a total value of c*FGV0, the substantial ∆EVA is required to satisfy the following:
∆122 +,
or
11
Here, 1222 +, is the actual expected EVA improvement. The actual improvement is
compared to the expected EVA improvement to get the excess EVA improvement for post-merger periods. Positive excess EVA improvement indicates that the return is above what was expected in the operating performance of the firm after the merger and acquisition, whereas negative excess EVA improvement indicates the return is below what was expected.
1.3.2.3. Efficiency Measurement
12
The main reasons to choose the DEA method over the parametric stochastic frontier is because, unlike stochastic models that require a large sample size and proper functional form of the frontier to make reliable estimations, the DEA demands relatively less data and does not require knowledge of the proper functional form of the frontier, error, and inefficiency structures (Evanoff & Israilevich, 1991; Grifell-Tatje & Lovell, 1997; Bauer et al., 1998; Wheelock & Wilson, 1999). The DEA is based on the individual firm, so it is easy to analyze efficiency by firm, which is particularly convenient for studying scope economies. The DEA technique measures the performance of each bank in the industry relative to best practice-efficient frontiers consisting of the dominant banks in the industry. Efficiency scores vary between 0 and 1, with fully efficient banks having efficiencies equal to 1 and inefficient firms having efficiencies between 0 and 1. Technical efficiency for a given firm is defined as the ratio of the input usage of a fully efficient firm producing the same output vector as the input usage of the firm under consideration. Technical efficiency can be achieved if the firm operates on the production frontier. I use the following input and output variables to compute efficiency.
Input vectors:
(1) Labor: Measured by staff costs (the number of full-time employees on the payroll), (2) Fixed capital: Measured by costs of premises and fixed assets, and
(3) Customer and short-term funding: Measured by the sum of deposit (demand and time) and non-deposit funds as of the end of the respective year.
Output vectors:
(1) Total loan: Both short-term and long-term loans,
(2) Other earning assets: Loans to special sectors (directed and specialized loans), inter-bank funds sold, and investment securities (treasury and other securities), and
13
1.3.3. Regression Analysis
To analyze the effect of a merger on performance, I will empirically test the following model: ∆ performance = β0 * Constant
+ β1 * Year
+ β2 * Relative size + β3 *Transaction value + β4 * Same state (dummy)
+ β5 * Same SIC (dummy)
+ β6 * Post-merger performance acquirer loan loss reserve over gross loan
+ β7 * Post-merger acquirer net interest margin + β8 * Post-merger acquirer cost-to-income ratio + β9 * Target performance
Relative size: Relative size is measured as the ratio of target to acquirer assets. For domestic mergers, a positive relation with relative size and change in performance will indicate that relatively larger targets may offer more opportunities to realize post-merger cost efficiencies. But post-merger performance will be weaker in a “merger of equals” because of internal power struggles and conflict in the integration process.
14
Same State: This is a dummy variable to capture the effect of geographic diversification. If both the acquirer and target are from the same state, I assign a value of 1; otherwise, I designate the variable as 0. Banks considering entering a market via acquisition would select the best target banks. Hence, increasing market shares might increase their profitability. However, Berger and DeYoung (2001, 2006) found that the greatly increased geographic footprint of US bank holding companies due to industry consolidation can cause managerial difficulties that will reduce efficiency.
Same SIC: This dummy variable captures the effect of product diversification. If a depository institution/non-depository merges with another depository institution/non-depository, it would like to increase its interest income. I call it product diversification. However, if a depository institution merges with another non-depository institution, I call it product diversification as its income will come from both interest and non-interest income.
Acquirer post-merger strategy: The post-merger performance of the acquirer will mostly depend on the strategy taken by the acquirer. To control for other non-merger-related factors, I use loan loss reserve/gross loan to measure the credit risk of the acquirer, which would be negatively related to the performance. I also use the net interest margin (NIM) as an indicator of acquirer lending efficiency and cost-to-income ratio (CI) as an indicator of operating expenses. I expect NIM would be positively and CI would be negatively related to performance.
15
1.4. Results and Main Findings
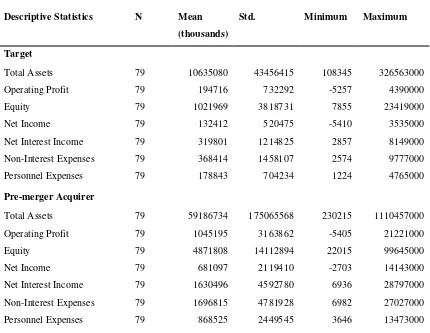
The descriptive statistics in Table 1 indicate that, in terms of size as measured by total assets, the acquirer banks on average are five and half times larger than the targets. Operating profits of the acquirer banks on average are 5.36 times, and net income on average is 5.16 times, higher than the target banks. Post-merger acquirer size measured by total assets on average is 1.36 times higher than pre-merger. Also the total profitability on average increases by 1.14 times. The initial results of our descriptive statistics show that mergers increase the size and profitability of the acquirer.
Table 1: Descriptive Statistics of merger and acquisitions
The descriptive statistics of Table 1, Panel A, refer to acquirer pre- and post-merger and target’s pre-merger total asset, total equity, accounting profitability, and expenses. Panel B shows the relative size of the target at the time of announcement and transaction value. Our sample period contains merger data from the years 1999 to 2009.
Descriptive Statistics N Mean Std. Minimum Maximum
(thousands) Target
Total Assets 79 10635080 43456415 108345 326563000
Operating Profit 79 194716 732292 -5257 4390000
Equity 79 1021969 3818731 7855 23419000
Net Income 79 132412 520475 -5410 3535000
Net Interest Income 79 319801 1214825 2857 8149000
Non-Interest Expenses 79 368414 1458107 2574 9777000
Personnel Expenses 79 178843 704234 1224 4765000
Pre-merger Acquirer
Total Assets 79 59186734 175065568 230215 1110457000
Operating Profit 79 1045195 3163862 -5405 21221000
Equity 79 4871808 14112894 22015 99645000
Net Income 79 681097 2119410 -2703 14143000
Net Interest Income 79 1630496 4592780 6936 28797000 Non-Interest Expenses 79 1696815 4781928 6982 27027000
Personnel Expenses 79 868525 2449545 3646 13473000
16
Total Assets 79 80924147 249135616 378690 1459737000 Operating Profit 79 1194229 4513879 -2687385 30681374
Equity 79 7596313 22699747 31134 135272000
Net Income 79 789769 3102187 -2113000 21133000
Net Interest Income 79 2047382 5837679 13046 34591000 Non-Interest Expenses 79 2279533 6682827 9862 35549000 Personnel Expenses 79 1137116 3419809 5844 18255000
Relative Size 79 0.33 0.43 0.003 3.244
tran_val 79 2489.87 9481.15 8.53 58663.15
17
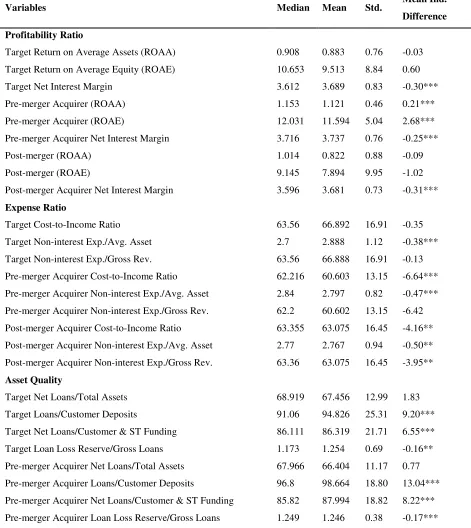
Table 2: Profitability, Expense, and Asset Quality Ratios
Table 2 shows various profitability expense and asset quality ratios of targets and acquirers from 1998 to 2009. Industry Mean Difference is computed as the difference between merging banks (target and acquirer) performance and the industry. Data are for the years 2000 to 2009. We use a non-parametric Pearson sign test to evaluate the significance of median.* indicates significance at 10%, ** indicates significance at 5%, and ***indicates significance at 1%.
Variables Median Mean Std. Mean Ind.
Difference Profitability Ratio
Target Return on Average Assets (ROAA) 0.908 0.883 0.76 -0.03 Target Return on Average Equity (ROAE) 10.653 9.513 8.84 0.60
Target Net Interest Margin 3.612 3.689 0.83 -0.30***
Pre-merger Acquirer (ROAA) 1.153 1.121 0.46 0.21***
Pre-merger Acquirer (ROAE) 12.031 11.594 5.04 2.68***
Pre-merger Acquirer Net Interest Margin 3.716 3.737 0.76 -0.25***
Post-merger (ROAA) 1.014 0.822 0.88 -0.09
Post-merger (ROAE) 9.145 7.894 9.95 -1.02
Post-merger Acquirer Net Interest Margin 3.596 3.681 0.73 -0.31*** Expense Ratio
Target Cost-to-Income Ratio 63.56 66.892 16.91 -0.35 Target Non-interest Exp./Avg. Asset 2.7 2.888 1.12 -0.38*** Target Non-interest Exp./Gross Rev. 63.56 66.888 16.91 -0.13 Pre-merger Acquirer Cost-to-Income Ratio 62.216 60.603 13.15 -6.64*** Pre-merger Acquirer Non-interest Exp./Avg. Asset 2.84 2.797 0.82 -0.47*** Pre-merger Acquirer Non-interest Exp./Gross Rev. 62.2 60.602 13.15 -6.42 Post-merger Acquirer Cost-to-Income Ratio 63.355 63.075 16.45 -4.16** Post-merger Acquirer Non-interest Exp./Avg. Asset 2.77 2.767 0.94 -0.50** Post-merger Acquirer Non-interest Exp./Gross Rev. 63.36 63.075 16.45 -3.95** Asset Quality
18
Post-merger Acquirer Net Loans/Total Assets 69.049 67.216 10.04 1.59 Post-merger Acquirer Loans/Customer Deposits 98.41 99.989 16.03 14.37*** Post-merger Acquirer Net Loans/Customer & ST Funding 88.632 88.335 14.18 8.56*** Post-merger Acquirer Loan Loss Reserve/Gross Loans 1.204 1.284 0.45 -0.13**
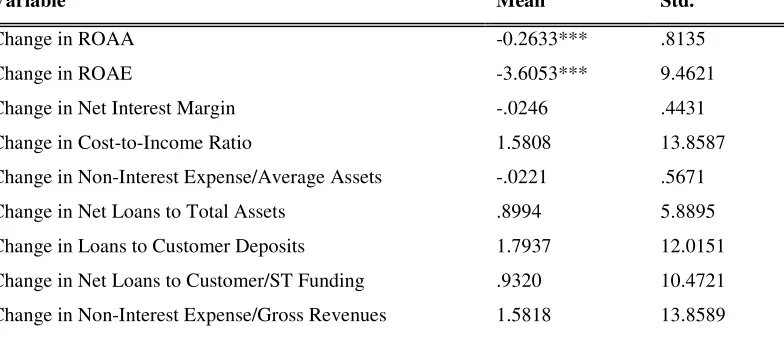
I report the difference between these various profitability, expense, and asset quality ratios in
Table 3. It shows that, after merger on average, ROAA and ROAE decrease more significantly than pre-merger combined banks’ ROAA and ROAE. However, I did not find any evidence that the expense ratio and asset quality of the acquirer bank changes more significantly after a merger than pre-merger combined banks’ expense ratios and asset quality. So far, I found that post-merger the profitability of the acquirer, as measured in ROAA and ROAE, decreases more significantly than in a pre-merger combined firm. However, this measure could be manipulated.
Table 3: Acquirer Changes in Pre- and Post-merger Accounting Ratios
Table 3 shows the average change in various accounting ratios for the acquirer before and after a merger. Data are for the years 2000 to 2009. * indicates significance at 10%,**indicates significance at 5%, and ***indicates significance at 1%.
Variable Mean Std.
Change in ROAA -0.2633*** .8135
Change in ROAE -3.6053*** 9.4621
Change in Net Interest Margin -.0246 .4431
Change in Cost-to-Income Ratio 1.5808 13.8587
Change in Non-Interest Expense/Average Assets -.0221 .5671 Change in Net Loans to Total Assets .8994 5.8895 Change in Loans to Customer Deposits 1.7937 12.0151 Change in Net Loans to Customer/ST Funding .9320 10.4721 Change in Non-Interest Expense/Gross Revenues 1.5818 13.8589
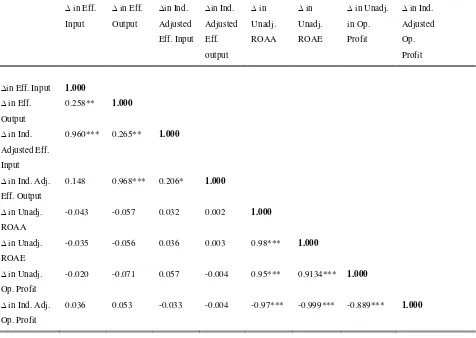
industry-19
adjusted operating profitability, ROAA, and ROAE, they are significantly negatively correlated. I did not find any significant correlation between change in efficiency and other performance change metrics.
Table 4: Correlation Coefficient of Various Performance Metrics
Table 4 shows the correlations between various performance metrics. Data are for the years 2000 to 2009. *indicates significance at 10%,**indicates significance at 5%, and ***indicates significant at 1%.
∆ in Eff.
Input
∆ in Eff.
Output ∆in Ind. Adjusted Eff. Input ∆in Ind. Adjusted Eff. output ∆ in Unadj. ROAA ∆ in Unadj. ROAE
∆ in Unadj.
in Op. Profit
∆ in Ind.
Adjusted Op. Profit
∆in Eff. Input 1.000
∆ in Eff.
Output
0.258** 1.000
∆ in Ind. Adjusted Eff.
Input
0.960*** 0.265** 1.000
∆ in Ind. Adj. Eff. Output
0.148 0.968*** 0.206* 1.000
∆ in Unadj.
ROAA
-0.043 -0.057 0.032 0.002 1.000
∆ in Unadj. ROAE
-0.035 -0.056 0.036 0.003 0.98*** 1.000
∆ in Unadj. Op. Profit
-0.020 -0.071 0.057 -0.004 0.95*** 0.9134*** 1.000
∆ in Ind. Adj. Op. Profit
0.036 0.053 -0.033 -0.004 -0.97*** -0.999*** -0.889*** 1.000
20
examine the performance of merged banks regardless of industry-wide changes that might affect performance. The change in unadjusted performance may reflect some factors other than the bank merger. Following Cornett et al. (2006), I identify industry banks as all banks that were not involved in a merger in the year before and after the merger in question. But, rather than forming four groups, I form eight groups.
Group 1 has less than $100 million; as our target filter size is $100 million, I never used this group.
Group 2 asset size lies between $100 million and $300 million. Group 3 asset size is between $300 million and $600 million. Group 4 asset size is between $600 million and $1 billion. Group 5 asset size encompasses $1billion to $5billion. Group 6 asset size comprises $5 billion to $10 billion. Group 7 asset size is between $10 billion and $50 billion. Group 8 has assets of more than $50 billion.
If the merger bank asset size is $1.5 billion, then industry banks will include all the banks in the group. Matching the merged banks to their respective group will allow us to compare their characteristics with their most similar competitors.
To identify the sources of changes in performance, I also evaluate their other profitability, operating efficiency, and asset quality indicators. There is collinearity between some of the specific ratios, for example, return on asset and return on equity. Hence, change in performance result from common elements. I use t-statistics to test the change in performance by using the following formula:
t&∑<9=>&5678956:;((
?√B@C
21
Panel A of Table 5 represents the unadjusted operating profitability of the target and acquirer before and after the merger as well as the combined banks’ pre-merger profitability. On average, the unadjusted operating profitability of the acquirer was 1.63%, compared to target 1.245%. The post-merger operating profitability was 1.178%, compared to pre-post-merger combined banks’ 1.147%. The difference between pre-and post-merger operating profitability is .03%; however, it is not significantly different from zero.
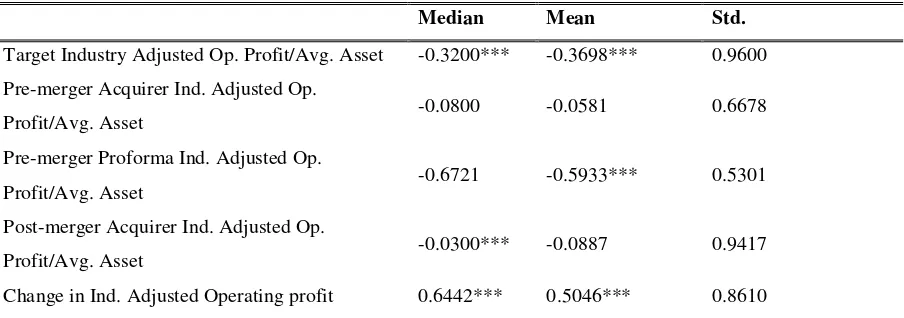
Table 5: Average Change in Pre-and Post-merger Operating Profit
Table 5, Panel A, shows the average change in pre- and post-merger acquirer unadjusted operating profit/average asset. Panel B shows the average change in pre- and post-merger acquirer industry adjusted operating profit/average asset. Mean industry adjusted difference is calculated as the difference between operating profit/average asset of merging banks and their corresponding peers average operating profit/average asset. Data are for the years 2000 to 2009. I use the non-parametric Pearson sign test to evaluate the significance of the median.*indicates significance at 10%,**indicates significance at 5%, and ***indicates significance at 1%.
Panel A: Average Change in Pre-and Post-merger Acquirer Unadjusted Operating Profit/Average Asset
Median Mean Std.
Target Op. Profit/Avg. Asset 1.2300 1.2453 1.0674 Acquirer Pre-merger Op. Profit/Avg. Asset 1.6600 1.6318 0.7043 Unadjusted Pre-merger Pro-forma Op.
Profit/Avg. Asset
1.0504 1.1470 0.5952
Acquirer Post-merger Op. Profit/Avg. Asset 1.3500 1.1775 1.1989 Change in Op. Profit/Avg. Asset 0.3123** 0.03042 1.1516
Panel B: Average Change in Pre-and post-merger Acquirer Unadjusted Operating Profit/Average Asset
Median Mean Std.
Target Industry Adjusted Op. Profit/Avg. Asset -0.3200*** -0.3698*** 0.9600 Pre-merger Acquirer Ind. Adjusted Op.
Profit/Avg. Asset -0.0800 -0.0581 0.6678
Pre-merger Proforma Ind. Adjusted Op.
Profit/Avg. Asset -0.6721 -0.5933*** 0.5301
Post-merger Acquirer Ind. Adjusted Op.
Profit/Avg. Asset -0.0300*** -0.0887 0.9417
Change in Ind. Adjusted Operating profit 0.6442*** 0.5046*** 0.8610
22
while the target industry-adjusted operating performance is -0.37%. Both the acquirer and target operating profitability were below their industry-matched performance, but the difference between their performance and the industry did not differ significantly from zero. Moreover, the pre-merger pro-forma performance was also lower than the post-merger performance. On average, a merger increased the industry-adjusted operating performance by 0.50%, an increment not significantly different from zero. So, like Cornett et al. (2006), merged banks perform similar to others in the industry before a merger. However, a merger did not increase the operating profitability of the merged banks.
Table 6 shows the efficiency scores of the merged banks. Panel A reports the unadjusted
efficiency of the target, pre-and post-merger acquirer, and pro-forma combined banks. The median of
target input-oriented efficiency was about 13% higher than the acquirer, while the mean of the target
input efficiency was 12% higher than acquirer pre-merger efficiency scores. However, the median and
mean of the target output efficiency were lower than the acquirer by about 1% and 4% respectively.
Post-merger input efficiency of the acquirer significantly decreased by 8%; output efficiency significantly
increased by 6.7%. The resulting median change in input-oriented efficiency is about -4.0% and is
significant at the 1% level, while the median change in output-oriented efficiency is 0.7% and is
insignificant.
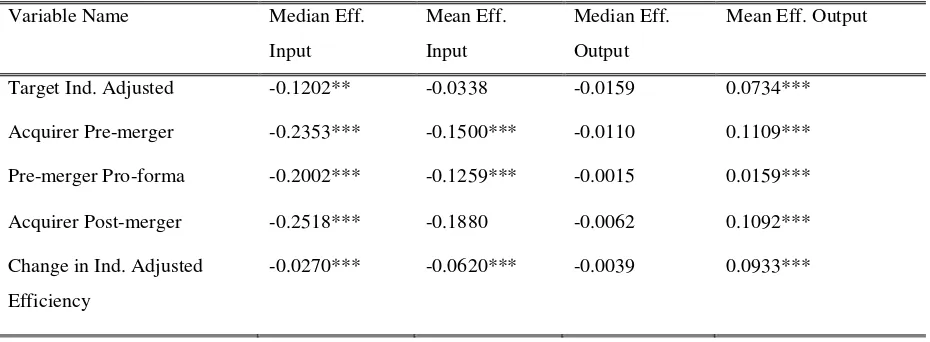
Panel B, Table 6, shows the industry-adjusted input- and output-oriented efficiency scores. Both
the target and acquirer median and mean input-oriented efficiency scores were significantly below the
industry’s. While the median output-oriented efficiency scores of the target and acquirer were not
different from their industry, mean output-oriented efficiency was significantly higher than the industry.
Consistent with unadjusted efficiency scores, I find that, after a merger, the industry-adjusted mean
input-oriented efficiency decreased significantly by 2.7%, which was lower than unadjusted input-input-oriented
efficiency. The mean output-oriented efficiency increased significantly by about 9%, which is more than
the unadjusted change in output-oriented efficiency. I can conclude that mergers on average increase
efficiency if the efficiency of the acquirer is higher than the target, though many studies have concluded
23
Peristiani (1997), and Berger (1998) find little or no cost-efficiency improvement in mergers. Apparently,
managerial inefficiencies of the acquiring banks or integrating system have offset the potential gain from
consolidation.
Table 6:
Average Change in Acquirer Various Pre-and Post-merger Acquirer Efficiency
Scores
Table 6, Panel A, shows the average change in pre- and post-merger acquirer unadjusted efficiency scores. Panel B shows the average change in pre- and post-merger acquirer adjusted efficiency scores. Mean industry-adjusted difference is calculated as the difference between efficiency of merging banks and their corresponding peers’ average efficiency scores. Data are for the years 2000 to 2009. I use a non-parametric Pearson sign test to test the significance of median.*indicates significance at 10%,**indicates significance at 5%, and ***indicates significance at 1%.
Panel A: Unadjusted Values of Efficiency
Variable Name Median
Eff. Input
Mean Eff. Input Median Eff. Output
Mean Eff. Output
Target 0.2108 0.2906 0.0274 0.1435
Acquirer Pre-merger 0.0798 0.1743 0.0359 0.1800
Premerger Pro-forma 0.1044 0.1984 -0.0452 0.0861
Acquirer Post-merger 0.0551 0.1171 0.0297 0.1529 Change in Efficiency -0.0452*** -0.0812*** -0.0072 0.067**
Panel B: Comparison of Industry-Adjusted Values of Efficiency Variable Name Median Eff.
Input
Mean Eff. Input
Median Eff. Output
Mean Eff. Output
Target Ind. Adjusted -0.1202** -0.0338 -0.0159 0.0734*** Acquirer Pre-merger -0.2353*** -0.1500*** -0.0110 0.1109*** Pre-merger Pro-forma -0.2002*** -0.1259*** -0.0015 0.0159*** Acquirer Post-merger -0.2518*** -0.1880 -0.0062 0.1092*** Change in Ind. Adjusted
Efficiency
24
Now I examine the product and geographic focus versus product and geographic diversification
merger. Theoretically, for a focus merger, improved performance and market value of the combined firm come from economy of scale, and for diversified merger, come from enhancing the income-generating capacity of the combined institution and lowering the operating costs through operational synergies, for example, economies of scope. If a specialized bank is already minimizing its costs, it can also improve its performance by economy of scale, that is, a diversified merger. But a diversified merger can incur agency costs due to the complexity of the conglomerate organization. Therefore, it is unclear whether the potential benefits of activity diversification outweigh the costs.
Moreover, from a theoretical perspective it is uncertain which type of merger reduces the risk— focuses or diversified. Standard portfolio theory predicts that the combined cash flows from non-correlated revenue sources should be more stable than the constituent parts. Securities and insurance activities can decrease conglomerate risk, but the effect largely depends on the type of diversifying activities that bank holding companies undertake (Kwan & Laderman, 1999). Moreover, if the acquirer does not know the true status of the credit risk of the target loan, then after the merger, it might increase the credit risk and the allowance for loan loss ratios.
Apart from the activity focus-diversified motive, bank mergers are also motivated by geographic focus and diversification. Because the financial service industry is highly regulated and different locations have different regulatory environments, a bank’s location plays a vital role in the market for corporate control, the activities in which the bank may engage, and the bank loan portfolio. The main goal of this paper is to investigate the impact of bank M&A on performance and find what kind of merger significantly affects firm efficiency, value addition, and long-run performance.
25
abnormal return in the long term. The capital market studies have not been able to identify whether the gains from M&A are due to market inefficiency or real economics gain (Healy, Palepu, & Ruback, 1992). Stock prices that reveal the market’s expectations of future cash flows may differ from actual performance.
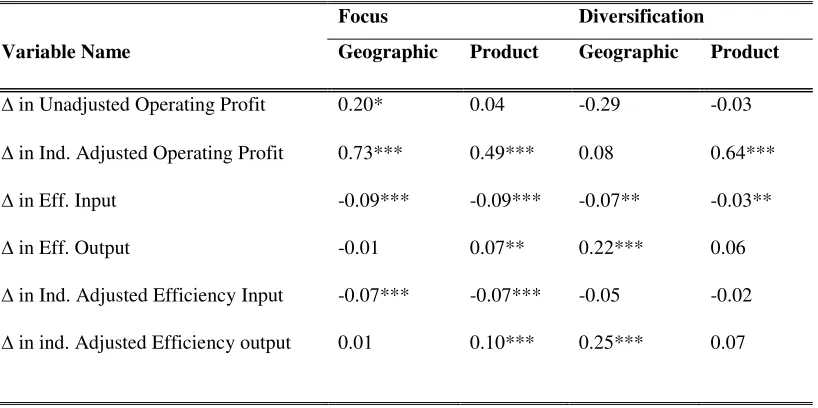
Table 7: Average Performance Metrics of Geographic and Product Focus Versus
Geographic and Product Diversification
Table 7, Panel A, shows mean performance metrics of geographic and product focus versus geographic and product diversification. If the merging banks’ headquarters are in the same state, then the merger is considered a geographically focused merger; otherwise, it is a geographically diversified merger. A product- or activity-focused merger happens when the two-digit SIC code of the merging banks are the same. Mean industry-adjusted difference is calculated as the difference between merging banks and their corresponding peers’ average. Data are for the years 2000 to 2009. *indicates significance at ∆10%, **indicates significance at 5%, and ***indicates significance at 1%.
Focus Diversification
Variable Name Geographic Product Geographic Product
∆ in Unadjusted Operating Profit 0.20* 0.04 -0.29 -0.03
∆ in Ind. Adjusted Operating Profit 0.73*** 0.49*** 0.08 0.64***
∆ in Eff. Input -0.09*** -0.09*** -0.07** -0.03**
∆ in Eff. Output -0.01 0.07** 0.22*** 0.06
∆ in Ind. Adjusted Efficiency Input -0.07*** -0.07*** -0.05 -0.02
∆ in ind. Adjusted Efficiency output 0.01 0.10*** 0.25*** 0.07
Table 7 reports the results of a focus versus diversification merger. I found significant evidence
that a geographically focused merger increases the operating profitability of the banks; there was no
significant evidence that a geographically diversified merger has any impact on operating profitability.
Compared to the overall industry-adjusted performance, a geographically focused merger increases the
operating performance by 0.20%. Both product-focused and a diversification merger increase operating
profitability; however, product diversification increases the operating profitability by 0.15% over a
26
lowered the input efficiency and increased the output efficiency of product-focused and geographically
diversified mergers.
So far, I have compared post-acquisition with pre-acquisition measures of operating performance
and efficiency like most academic studies. Now I will use the EVA methodology developed by Sirower
and O’Byrne (1998) for forecasting and evaluating post-acquisition operating performance, which will
interest both corporate practitioners and researchers. The EVA method uses the market values of both
acquirer and target before the merger and the merger premium to determine the future levels of annual
operating performance that are necessary to justify the investment in the merger. When an acquirer takes
over a target, the acquirer pays an up-front price that virtually always includes a substantial premium.
These premiums should include the expectation of the acquiring bank of making improvements in the
target bank’s future performance and exploiting other synergies between the two banks. To create value
for shareholders, the present value of the performance gains of the merging banks must be higher than the
stand-alone expectations to recapture the premium.
M&A are a complex process with unique features. Just by comparing operating performance one
year before and after it, I cannot find the true effect of a merger and acquisition. Sirower et al. (1998)
identified some benchmark problems, such as:
1. Acquisitions are a capital investment decision that the shareholders of the acquirer can
essentially make on their own—just by buying the shares of other companies—without
paying either premiums or integration expenses.
2. Unlike any other capital investment decision, an acquisition requires paying all the money up
front, including the acquisition premium, before any improvements can begin.
3. Paying the acquisition premium creates an additional business problem—achieving
performance gains above those already reflected in the share prices of the two stand-alone
firms.
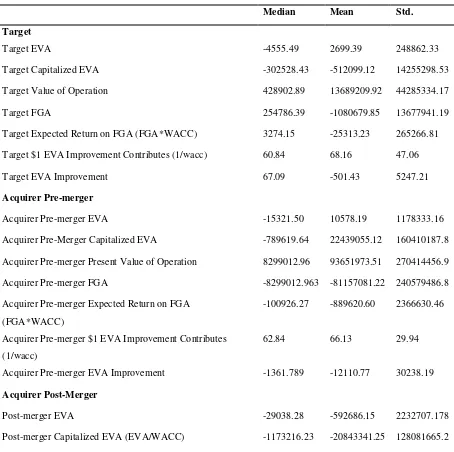
As I have documented in Table 8, the sample of our merger shows significant improvement in
27
the acquirer had a negative EVA improvement, and the target had a positive EVA improvement. The
pro-forma EVA improvements of the combined firms were also less than zero. However, after the merger, the
mean expected EVA improvement of the acquirer was $.76 million, and the acquirer on average improved
its expected EVA by $31.09 million, which is significantly different from zero.
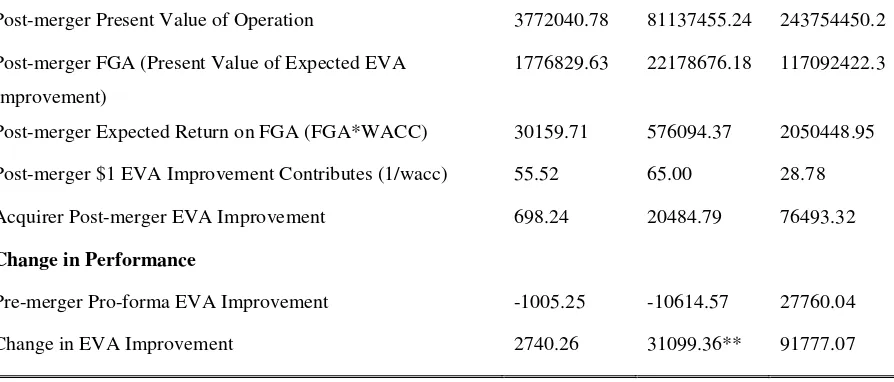
Table 8: Changes in Economics Value Added
Table 8 shows the expected EVA improvement analysis of merging banks. Data are for the years 2000 to 2009. *indicates significance at ∆10%,**indicates significance at 5%, and***indicates significance at 1%.
Median Mean Std.
Target
Target EVA -4555.49 2699.39 248862.33
Target Capitalized EVA -302528.43 -512099.12 14255298.53
Target Value of Operation 428902.89 13689209.92 44285334.17
Target FGA 254786.39 -1080679.85 13677941.19
Target Expected Return on FGA (FGA*WACC) 3274.15 -25313.23 265266.81 Target $1 EVA Improvement Contributes (1/wacc) 60.84 68.16 47.06
Target EVA Improvement 67.09 -501.43 5247.21
Acquirer Pre-merger
Acquirer Pre-merger EVA -15321.50 10578.19 1178333.16
Acquirer Pre-Merger Capitalized EVA -789619.64 22439055.12 160410187.8 Acquirer Pre-merger Present Value of Operation 8299012.96 93651973.51 270414456.9 Acquirer Pre-merger FGA -8299012.963 -81157081.22 240579486.8 Acquirer Pre-merger Expected Return on FGA
(FGA*WACC)
-100926.27 -889620.60 2366630.46
Acquirer Pre-merger $1 EVA Improvement Contributes (1/wacc)
62.84 66.13 29.94
Acquirer Pre-merger EVA Improvement -1361.789 -12110.77 30238.19
Acquirer Post-Merger
Post-merger EVA -29038.28 -592686.15 2232707.178
28
Post-merger Present Value of Operation 3772040.78 81137455.24 243754450.2 Post-merger FGA (Present Value of Expected EVA
Improvement)
1776829.63 22178676.18 117092422.3
Post-merger Expected Return on FGA (FGA*WACC) 30159.71 576094.37 2050448.95 Post-merger $1 EVA Improvement Contributes (1/wacc) 55.52 65.00 28.78 Acquirer Post-merger EVA Improvement 698.24 20484.79 76493.32
Change in Performance
Pre-merger Pro-forma EVA Improvement -1005.25 -10614.57 27760.04
Change in EVA Improvement 2740.26 31099.36** 91777.07
To identify the factors contributing to the change in performance, I ran a regression analysis. Panel A,
Table 9, shows the changes in operating profitability as a function of merger-related variables and other
firm-level control variables. Consistent with previous findings, I find that geographically focused mergers
increase the unadjusted operating profitability significantly (Regression 1a). A product-focused merger
does not significantly affect the change in unadjusted operating profit. Consistent with Cornett et al.
(2006), I also find that, the bigger the target bank size relative to the acquirer, the greater the
improvement in performance around the merger. I also find that a 1% increase in target input-oriented
efficiency and output-oriented efficiency will increase the unadjusted operating profitability significantly
by 0.9% and 0.83%, respectively. Panel B shows the relationship between the change in industry-adjusted
operating profitability around the merger and other variables. Here, only the deal size and Geographically
focused merger have a significant, positive relationship with change in industry-adjusted operating
profitability. However, when I control for other variables, industry-adjusted performance target efficiency
has no significant impact on change in operating profitability. The relative size of the target has
significant positive impact on change in operating profitability and has positive but not significant impact
29
Finally, Table 10 shows that, the larger the deal, the higher the improvement in efficiency.
Geographically focused mergers decrease output-oriented efficiency. This result is consistent with our
previous findings and economy of scale hypothesis.
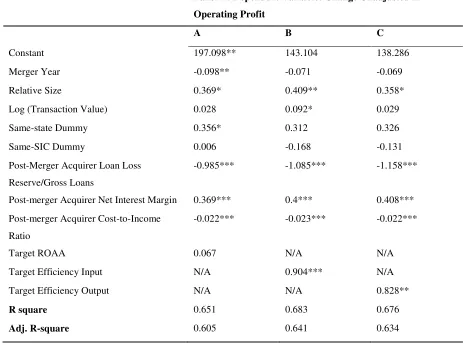
Table 9: Results of the Regression Analysis-Accounting Performance
Table 9 shows the results of the regression analysis. The dependent variable in Panel A is the change in operating profit/average asset. Model A includes Target ROAA as an independent variable while Model B and C include the target’s input- and output-oriented efficiency scores. In Panel B, the dependent variable is the change in industry-adjusted operating performance. Data are for the years 2000 to 2009. *indicates significance at 10%,**indicates significance at 5%, and***indicates significance at 1%.
Panel A: Dependent Variable: Change Unadjusted in Operating Profit
A B C
Constant 197.098** 143.104 138.286
Merger Year -0.098** -0.071 -0.069
Relative Size 0.369* 0.409** 0.358*
Log (Transaction Value) 0.028 0.092* 0.029
Same-state Dummy 0.356* 0.312 0.326
Same-SIC Dummy 0.006 -0.168 -0.131
Post-Merger Acquirer Loan Loss Reserve/Gross Loans
-0.985*** -1.085*** -1.158***
Post-merger Acquirer Net Interest Margin 0.369*** 0.4*** 0.408*** Post-merger Acquirer Cost-to-Income
Ratio
-0.022*** -0.023*** -0.022***
Target ROAA 0.067 N/A N/A
Target Efficiency Input N/A 0.904*** N/A
Target Efficiency Output N/A N/A 0.828**
R square 0.651 0.683 0.676
30
Panel B: Dependent Variable: Change in Ind. Adjusted Operating Profit
A B C
Variables Coefficients Coefficients Coefficients
(Constant) -195.464** -196.988** -192.368**
Merger Year 0.098** 0.098** 0.096**
Relative Size 0.231 0.246 0.231
Log (Transaction Value) 0.046 0.086* 0.065
Same-state Dummy 0.511*** 0.459** 0.463**
Same SIC Dummy 0.077 -0.008 0.018
Post-Merger Acquirer Loan Loss Reserve/Gross Loans
-0.428** -0.459** -0.462**
Post-merger Acquirer Net Interest Margin 0.344*** 0.354*** 0.351*** Post-merger Acquirer Cost-to-Income
Ratio
-0.023*** -0.023*** -0.023***
Target ROAA 0.141 N/A N/A
Target Ind. Adjusted Eff. Input N/A 0.302 N/A
Target Ind. Adjusted Eff. Output N/A N/A 0.181
R-Square 0.539 0.534 0.53
Adjusted R-Square 0.479 0.473 0.469
Table 10: Results of the Regression Analysis-Efficiency Scores
Table 10 shows the results of the regression analysis. The dependent variable is the change in industry-adjusted and unadjusted efficiency scores. The change in industry-adjusted efficiency scores are calculated as the difference between efficiency scores of merging banks and their corresponding peers’ average efficiency scores. Data are for the years 2000 to 2009.*indicates significance at 10%,**indicates significance at 5%, and ***indicates significance at 1%.
Dependent Variables Change in Eff. Input
Change in Ind. Adjusted Eff. Input
Change in Eff. Output
Change in Ind. Adjusted Eff. Output Variables Coefficient Coefficient Coefficient Coefficient
Constant -47.106** -35.361** -46.135** -11.955
Merger Year 0.023** 0.018** 0.023** 0.006
Relative Size 0.032 0.026 -0.071 -0.081*
Log (Transaction Value) 0.018* 0.021** 0.087*** 0.087***
31
Same-SIC Dummy -0.014 -0.014 0.074 0.083
Post-merger Acquirer Loan Loss Reserve/Gross Loans
0.026 0.03 0.062 0.074
Post-merger Acquirer Net Interest Margin
-0.014 -0.021 -0.018 -0.023
Post-Merger Acquirer Loans/Customer Deposits
-0.001 -0.001 0.001 0.001
Post-merger Acquirer Operating Profit/Average Total Assets
0.024 0.03 0.044 0.046*
Target Eff. Input -0.107 N/A N/A N/A
Target Ind. Adjusted Eff. Input N/A -0.063 N/A N/A
Target Eff. Output N/A N/A -0.145** N/A
Target Ind. Adjusted Eff. Output N/A N/A N/A -0.12
R-square 0.234 0.217 0.663 0.682
Adjusted R-Square 0.121 0.102 0.614 0.635
1.5. Conclusion
32
33
References
Altunbas, Y, Gardener, E P M, Molyneux P, Moore, B (2001) Efficiency in European banking. European Economic Review 45, 1931-1955
Altunbas Y, Marques D (2008) Mergers and acquisitions and bank performance in Europe. The role of strategic similarities. J Econ Bus 60:204–222
Altunbas Y, Ibáñez D M (2004) Mergers and acquisitions and bank performance in Europe. The role of strategic similarities. ECB Working paper n. 398, Frankfurt.
Altunbas Y, Molyneux P, Thornton J (1997) Big-Bank Mergers in Europe: An Analysis of the Cost Implications. Economica 64 (254), 317-329
Al-Sharkas Adel A, Hassan M. Kabir and Lawrence Shari (2008) The Impact of Mergers and Acquisitions on the Efficiency of the US Banking Industry: Further Evidence. Journal of Business Finance & Accounting, 35 (1) and 35 (2), January/March, pp. 50-70
Amel D, Barnes C, Panetta F, Salleo C (2004) Consolidation and efficiency in the financial sector: a review of the international evidence. J Bank Financ 28:2493–2519
Banker R D, Charne A & Cooper W W (1984) Some models for estimating technical and scale inefficiencies in data envelopment analysis. Management Science,30(9), 1078-1092
Bauer KJ, Miles LL, Nishikawa T (2009) The effects of mergers on credit union performance. J Bank Financ (in press)
Bauer W, Berger AN, Ferrier G D, and Humphrey D B (1998) Consistency Conditions for Regulatory Analysis of Financial Institutions: A Comparison of Frontier Efficiency Techniques, Journal of Economics and Business 50, 85-114.
Beccalli E, Frantz P (2009) M&A Operations and performance in banking. Journal of Financial Services Research, Vol. 36, No. 2
Benston G J, Hunter W C, and Wall L D (1995) Motivations for Bank Mergers and Acquisitions:
Enhancing the Deposit Insurance Put Option Versus Earnings Diversification”, Journal of Money, Credit, and Banking, 27 777-88.
Berger AN (2007) Obstacles to a global banking system: ‘Old Europe’ versus ‘New Europe’. J Bank Financ 31:1955–1973
Berger AN, DeYoung R (2006) Technological progress and the geographic expansion of the banking industry. J Money, Credit Bank 38:1483–1513
34
Berger AN (2003) The economic effects of technological progress: evidence from the banking industry. J Money, Credit Bank 35:141–176
Berger AN, DeYoung R (2001) The effects of geographic expansion on bank efficiency. J Financ Serv Res 19:163–184
Berger AN, DeYoung R, Udell GF (2001) Efficiency barriers to the consolidation of the European financial services industry. Eur Financ Manag 7:117–130
Berger AN, DeYoung R, Genay H, Udell GF (2000) The globalization of financial institutions: evidence from cross-border banking performance. Brookings — Wharton Papers on Financ Serv 3:23–125
Berger AN, Demsetz RS, Strahan PE (1999) The consolidation of the financial services industry: causes, consequences, and implications for the future. J Bank Financ 23:135–194
Berger AN, Hannan TH (1998) The efficiency cost of market power in the banking industry: a test of the `quiet life’ and related hypotheses. Rev Econ Stat 80:454–465
Berger AN and Mester L J (1997), ‘Inside the Black Box: What Explains Differences in the Efficiencies of Financial Institutions?’ Journal of Banking and Finance, Vol. 21, pp. 895–947.
Berger AN, Humphrey DB (1992) Megamergers in banking and the use of cost efficiency as an antitrust defense. Antitrust Bull 37:541–600
Campa JM, Hernando I (2006) M&As performance in the European financial industry. J Bank Financ 30:3367–3392
Carbó VS, Humphrey DB (2004) Predicted and actual costs from individual bank mergers. J Econ Bus 56:137–157
Charnes A, Cooper W W, and Rhodes E (1978) Measuring the efficiency of decision making units.European Journal of Operational Research, 2, 429-44.
Cohen AM, Mazzeo M J (2004) Competition, product differentiation and quality provision: an empirical equilibrium analysis of bank branching decisions, Board of Governors of the Federal Reserve System Finance and Economics Discussion Series Working Paper 2004-46
Cornett MM, Örs E, Tehranian G (2002) Bank performance around the introduction of a Section 20 subsidiary. J Finance 57:501–521
Cornett MM, McNutt JJ, Tehranian H (2006) Performance changes around bank mergers: revenue enhancements versus cost reductions. J Money, Credit Bank 38:1013–1050
Cybo-Ottone A, Murgia M (2000) Mergers and shareholder wealth in European banking. J Bank Financ 24:831–859