The Effects of Infrastructure on the Economic
Growth of the Main Sectors of the Economy of
Iran’s Provinces
Mansour Khalili Araghi1, Mahboobeh Kabiri Renani*2, Elham Nobahar3
Received: March 7, 2016 Accepted: August 15, 2017
Abstract
evelopment of social and economic infrastructure in every region is of the basic requirements of economic growth. Infrastructure stimulates economic activity, enhance the productivity of private sector’s inputs, improve economic performance and thus sustainable economic development, enhancing the social welfare and better income distribution. Since the different kind of infrastructure has different effects on the sectors of the economy and then on regional development, examining the effect of infrastructure on regional economic development in various economic sectors for policymakers and planners is of particular importance. In this regard, the production function for different sectors (industry, services and agriculture) for the 30 provinces of Iran for the period 2007-2013 is estimated. Production function by the Panel Corrected Standard Errors (PCSE) method is estimated. Results show that social and economic public infrastructure has a positive impact on the economic growth of these sectors. Furthermore, the result indicates that the impacts of different kinds of infrastructure are different on various sectors of the provinces. That is the impact of social infrastructure on industrial and service sectors are more than an economic infrastructure. On the other hand the economic infrastructure has more effects on the agricultural sector compared to other infrastructure.
Keywords: Infrastructure, Economic Growth, Panel Data, PCS.
JEL Classification: C23, O47, R11.
1.Introduction
About the regional issues, the policymakers and researchers have claimed that investment in the public infrastructures is one of the most
1. University of Tehran, Factuly of Economic, Tehran, Iran (khalili@ut.ac.ir). 2. University of Tehran, Factuly of Economic, Tehran, Iran (Corresponding Author: m.kabiri@ut.ac.ir).
3. University of Tabriz, Faculty of Economics, Tabriz, Iran (enobahar@tabrizu.ac.ir).
important tools for implementation of the regional growth strategy. In fact, it is one of the competitive ways of the regional states for attracting the new firms through investment in different kinds of public facilities.
The importance of the public infrastructures in elevation of the economic development has been widely known among the policymakers. Recently, the economists have observed the effects of the infrastructure in regional economic development more than a stimulus of productive activities. The economists express that the public infrastructures stimulate the economic activities, enhance the efficiency of the private factors of production, or indirectly enter into the production process. Moreover, families and firms may be more attracted to the region by increasing welfare facilities and public infrastructures in the region which help the development of the region more.
The concept of capital of the state or public infrastructures is presented back to the period of Adam Smith (1970). In his words, the government should construct and maintain the public goods and capitals. However, the exact entity of public infrastructure capital is not clear always, and there are various definitions for the term public capital (or public infrastructures).
Generally, capital includes is defined as “all what human constructs for increasing production, such as tools, machineries, and factories which are used in the process of making goods and other services instead of being used by themselves” (Lipsey, 1989). The term financial capital is used for the spent money to perform or hold a job, and the term physical capital (or capital goods) is used for the tangible factors of production (Varian, 1993).
In its literal sense, the term infrastructure means the physical and organizational structure required for benefitting from a society or firm. Biehl (1986) suggests that the infrastructure is a source that simultaneously has the public goods’ and capitalization feature. Infrastructure simultaneously shows “publicness” both in production and consumption. For the same reason, the non-excludability, immobility and indivisibility features are true about the infrastructures; but the degree varies according to infrastructure type.
justifying government investment in the public infrastructures: The first is the private market’s failure to allocate resources on an optimum way, and the second reason is because of economies of scale. Indeed, when the production scale increases, a significant decrease will occur in the accessibility and distribution costs.
In looking at the role of public investment in the economic development, Hansen (1965) categorizes the public infrastructures into two categories: Economic Overhead Capital (EOC) and Social Overhead Capital (SOC). In fact, EOC is the direct support of the productive activities and SOC is the improvement of human capital and includes social services like education, public health facilities, firing, police services, and nursing home. According to Capello (2007), despite that the social overhead capital influences the human capital and quality of life, - its productive effect appears in the long- term. The two common aspects of all of these categorizations of the public infrastructures are the ones that distinguish them from other investments. The first is that the public infrastructures provide the main basis for the economic activities. The second is that it creates positive spillover.
According to Eric (2002: 412), generally, the infrastructures enhance the economic growth and total production in three ways: 1. As a production factor, infrastructures enter the production, such as gas, water, and electricity; 2. As an intermediate input, the infrastructures are able to directly increase the productivity of production factors such as mass transit system which facilitates the transfer of goods and inputs; 3. In “new growth” literature, the infrastructures indirectly influence on the investment decisions, and can cause long-term acceleration (Barro, 1990). Regarding to the two first influences, it can be said that the economic infrastructures are complementary with other factors of production, and cause increase in the final production and productivity of the production factors. Of course, in the third way, Eric states that in the case of improper
management of infrastructures, unprofessional financing of
infrastructures and lack of coordination of the infrastructure components with the economic activities, could cause negative impact of the infrastructures on the economic development.
necessary to allocate the resources the in an optimal way, in order to stimulate and accelerate the economic development. Hence, the necessity of exact investigation of the impacts of all types of infrastructures on the provinces of the country is revealed for directing the infrastructure investment resources to the most effective sectors to achieve the efficient use of the limited resources. Moreover, by investigating the impact of the infrastructure capitals on the economic development of the provinces, and by analyzing the production function of different sectors, we can help modifying of government’s policies regarding to the more justly distribution of incomes and homogeneous growth of regions. Since no study has been so far carried out about the amount of influence of the public capital to the breakdown of social and economic -on the production of industry, services, and agricultural sectors of the provinces of the country, it is very important to exactly investigate this subject.
The aim of the current study is to investigate the distinguished
impacts of the economic infrastructures (energy, water,
communication and technology) and social infrastructures (education and healthcare) on the economic development of the main sectors of provinces of Iran. Therefore, the hypotheses of this research include the different impacts of all kinds of infrastructures of water, energy, information technology and communication, healthcare, and education on the economic development of different sectors of provinces of Iran. To this end, the production functions of industry, services, and agricultural sectors will be estimated through the panel data.
The remainder of this paper is organized as follows. In section 2 the theoretical frameworks is presented, and in section 3, the literature review are shown. In section 4, the econometric panel data are expressed. Section 5 explains the results of estimating the model. At last, conclusion is presented in section 6.
2.Theoretical Framework
defines and emphasizes the need to focus on public sector stock of tangible capital. An expanded version of this definition includes human capital.
Hansen (1965) divides infrastructure investments into social and economic infrastructure investments. Social infrastructure investments are health, schools and sports facilities, waste collection centers, and social services that improve human capital. Economic infrastructure investments are highways, gas and electricity production, treatment and drainage systems, bridges, ports, irrigation systems and river transportation systems that support production or provide mobility to economic goods.
Eberts (1990) expresses that two characteristics discern public infrastructure investments; they are public capital investments that underpin economic activities and they create positive externalities. At least three justifications for positive externalities to be considered. Fristly, some public infrastructure investments, for example; highways, provide services that cannot be excluded. Users share these facilities without reducing other users’ benefits. Second, infrastructure investments, for example; water treatment and pollution abatement, reduce negative externalities of private sector. Finally, infrastructure
investments, including energy generation, highways and
communication, demonstrate economies of scale. When more users enter the system, the large cost of these investments is distributed across many users, and unit costs continuously decline.
Instead of incorporation theories and theories of regional growth and development investigate the regional development and spatial distribution of economic activity. They emphasize that the infrastructure investments of state contribute to regional development. For example, Porter externality, a type of dynamic externality, refers to productivity improvement arising when sellers and buyers in a cluster utilize the infrastructure investments and state-sponsored education and other public institutions. The importance of public institutions, infrastructure investments and public arrangements in improving regional competition and clustering is significant.
determine regional growth, the evolution of exportable goods depends on comparative advantages reflected by relative production costs. North adds that local and central governments inclined to grow
transportation and other infrastructure may improve the
competitiveness of regional exports by reducing transportation and other costs. The approach of Perroux’s growth notes that the pole provides social and economic infrastructure investments, which may draw attention.
The cumulative causality approach of Myrdal, argues that developing regions attract efficient production factors from other regions, leading to growth in developing regions and persistent recession and decline in underdeveloped regions. This in turn erodes transportation, health and education infrastructure in underdeveloped regions (Myrdal, 1975). The approach of Barro, conducted in the context of endogenous growth models, states that efficient public infrastructure expenditures increase factor productivity (Barro and Sala-I-Martim, 1995).
3. Literature Review
One of the most important issues in urban and regional economy, is the impact of infrastructure on economic growth areas. Most empirical studies are conducted on the developed regions such as USA and European countries. Followingly, some of the most important studies in the field, and their results will be explained.
Munnell and Cook (1990) explored the impacts of the public capitals on the production process of the USA and its regions (48 States for the period of 1970–1986), using the Cobb-Douglas production function approach. They selected OLS method to estimate their model. Results of their study supported the reverse casualty and indicated that the rich states have more capability of investment in the public infrastructures than the poor ones.
on production (production elasticity for each of these infrastructures is between 0.04 and 0.05).
Pinnoi (1994) investigated the impact of water and sanitation infrastructures on the economic development. To this end, he used the translog production function approach, using the panel data (48 States for the period of 1970–1986). Results show that in many regions and industries, the water and sewage services are complementary for the private capital and workforce.
Evans and Carras (1994) state that the government capital, in case of modification of serial correlation and calculating endogeneity will statistically show the negative productivity (except government educational services), using panel data of the 48 contiguous states and the production function approach. Also Sturm and Haan (1995) have estimated the Cobb-Douglas production function for the period similar to Aschauer. They concluded that the infrastructures do not influence development.
Moomaw et al. (1995) repeated the regional work of Munnell in the United States, but there was a major difference. Instead of using the Cobb-Douglas production function, they preferred using Translog function. Their main conclusion was that the water and sanitation systems have more significant impacts on increasing regional production especially in the southern states than the other types of public capitals. Moreover, their results supported the claim of Hanson about the different influence of various types of infrastructures regarding to the features of the region.
By a panel including 48 States of the US for the period of 1970 – 1986, Baltagi and Pinno (1995) indicated that the water and sanitation infrastructures have more significant impacts on productivity of the private sector than the other public capitals.
Charlot and Schmitt (1999) investigated the impact of the public infrastructures on the growth of regions, using the Cobb-Douglas production function for 22 regions of France between 1982 and 1993. The results of this study suggest that public capital has a positive impact on growth of the areas.
they can be considered as the fundamental factor of economic growth. Mlynek (2001) developed a study about relationship between the public capital stock and the private production, using the data of the industry sector in 11 provinces of Germany. Results indicate that the public capital is a significant input for the production in the industry sector and difference in the public capital of regions may explain the long-term differences in productivity of all over the provinces of Germany.
By using the data of 22 OECD countries for the period 1960–2001 and based on the Cobb-Douglas production function, Kamps (2004) with the simple panel method indicates that the production elasticity to public capitals is statistically significant and positive in many countries. In addition, the public capitals in OECD countries are on average productive.
In an expanded model for the period of 1965–1996 in Belgium, Heylen and Everaert (2004) studied the public capital’s long-term effects on production and labor market. Results of their simulation indicated the strong and positive impact of the public capital on the private production and capital formation. Also public capital and privately employed are substitutes for each other (public capitals have a negative effect on employment).
Fan and Zhang (2004) investigated the impact of the transportation
infrastructures (road density), communicative infrastructures
(telephone branches number), and education infrastructures on production function of agricultural and non-agricultural sectors of Chinese villages (of the Cobb-Douglas kind). Their results show that the education infrastructures play an important role in explaining the variety in productivity of the rural agricultural and non-agricultural sectors. In addition, the lower productivity of the west area is due to the lower level of education and science, and technology
infrastructures. Generally, their findings indicate that the
infrastructural investments in rural regions have the most direct influence on the improvement of the poor’s revenue and improvement of the roads and water, and sanitation services are very effective in their empowerment.
The results of this study show the positive long-term impact of the public investment per capita on economic growth of the region. Especially the education infrastructures are the most influential ones in the regional economic growth.
Akif Kara et al. (2015) explored the impact of all types of economic and social infrastructure costs on the income of the regions of Turkey for the period of 2004–2008, using production function. Results show that the social infrastructures have more significant impacts on the revenues of regions than the economic infrastructures.
For the Iranian studies, we can refer to the paper of Baba-Zadeh et al. (2009). They investigated the relationship between government’s capital in transportation sector and the economic growth with the approach of co-integration during the 1959–2005 period. In this study, they used endogenous growth pattern to estimate the short-term and long-term parameters of GDP function. Their results indicate that the government’s investment in the transportation sector for short-term and long-term have a positive significant influence on the economic growth.
Akbarian and Ghaedi (2012) evaluated the impact of investing in economic infrastructures (transportation, energy, and communications) on Iranian economic growth, using the VAR method for the period of 1961–2006. The results indicate that in the long-term, the impact of per capita investment (workforce) in the economic infrastructures on the GDP non-oil per capita is positive.
Qorbani et al. (2014) investigated Iran’s infrastructures impact on this country economic growth for the period of 1976–2012. Their findings show that infrastructures including the physical, social, and ICT infrastructures have a positive significant impact on the economic growth of Iran. Finally, it should be mentioned that no regional study has been so far performed about the amount of influence of the public capital stock in social and economic segregation, on the production of the main sectors of industry, services, and agriculture of the provinces of Iran.
4.Econometric Methodology
literature is widespread. It provides considerable advantages, such as lower co-linearity among the variables, more degrees of freedom and more efficiency, controlling for individual heterogeneity to name but a few. Panel data analysis combines time series and cross-sectional data (Greene, 2012). Unlike time series and cross sectional regressions, panel data regression is expressed as follows (Baltagi, 2005):
1,..., ; 1,...,
it k kit it
Y X u
i N t T
(6)
Where Y is the dependent variable, α is the constant; Xk is the
observed explanatory variable, i refers to cross sectional units, t is time, β is the estimated coefficient of the observed explanatory variable, and ε is the error term. If the error term is defined as:
it i it
u
v
(7)Then i represents the unobserved individual effects of cross
sections; and vit is the remaining portion of the error term. Therefore,
it is obvious that the error component is unidirectional. If the error term consists unobserved individual effects and the unobserved time effect, its error component is bidirectional (Baltagi, 2005). In this case, the error term is:
it i t it
u
v
(8)Where t is the unobserved time effect and is added to the error term.
The panel data regression is estimated using fixed and random effects under different assumptions. The fixed effects method includes unobserved effects in the model via dummy variables. A correlation between the explanatory variables and unobserved effects, is assumed (Dougherty, 2011).
sectional units, the fixed effects are justified (Atici and Gulog, 2006). Previous literature selects models employing the Hausman (1978) test, which identifies the correlation between unobserved and explanatory variables. This test shows the following:
0 1
: ( | ) 0
: ( | ) 0
it
it
H E u X
H E u X
(9)
The null hypothesis, there is no correlation between explanatory variables and unobserved effects. Accepting the null hypothesis means that random effects are efficient, and its rejection implies the fixed effects model is efficient, and the explanatory variables and unobserved effects are correlated (Baltagi, 2005, Woolderige, 2002).
5. Econometric Model and Data Set
In this study, we investigate the impact of public capital stock in economic and social segregation, on production of industry, agriculture, and private services sectors of Iran’s provinces for the period of 2007–2013. The data has been extracted from the regional accounts of the Statistical Center of Iran and Iran’s Central Bank. It should be noted that the data include all provinces of Iran, and due to the segregation of Tehran province in the middle of the studied period, data of the two provinces of Tehran and Alborz have been considered in an aggregated form in one province.
5.1 The Model
The general analytical framework used in this study will be estimated by the Cobb-Douglas production function for the main sectors of the economy of Iran’s provinces through using panel data analysis. Production function results are to be explored regarding to economic and social public capitals. Finally, the impact of each of the public capitals on the production of the main economic sectors of the provinces will be separately estimated. The production functions for the main sectors of the economy are as the followings:
a b c
it it it it
Q
AK L G
(10)time period (2007-2013). Where A represents the level of technology
or technological change, Qit represents the real value added of
economic sectors (industry, services and agriculture) in the province i
at time t, Kitis the real private capital input of economic sectors in the
province i at time t, Litis the average annual number of employment
in economic sectors in the province i at time t, and Git represents the
real public capital input in the province i at time t.
We suppose that the private and public capital inputs are respectively appropriate to the private and public capital stocks.
The empirical model of the relationship between the production factors of the main sectors of Iran’s provinces is expressed based on the previous empirical studies and the theoretical principles in the form of Cobb-Douglas function. In order to have a linear relationship of the two sides of the equation (10), the logarithmic form is:
0
ln
Q
it
A
a
ln
K
it
b
ln
L
it
c
ln
G
it
u
it (11)it
u :error term
Firstly, due to the significance of affection of the public capital stock- economic and social- on the production of various sectors, their separated effects are studied. The economic infrastructures include energy, water, ICT, and the social infrastructures include education and healthcare. In order to study the effects of different types of infrastructures on the economic growth of the main sectors of economy of Iran’s provinces, we use the following equation:
0 , .inf .
lnQit A alnKit blnLit clnGit econ uit
0 , .inf .
lnQit A alnKit blnLit clnGit soc uit
(12)
(13)
, .inf .
it econ
G represents the real public capital stock of economic and
, .inf .
it soc
G represents the real public capital stock of social.
0 ,inf .
lnQit A alnKit blnLit clnGit type uit (14)
It should be noted that production price index is used to having the real value of the value added of each sector and the private and public capital stock of each province.
The value added of the private industry sector of each province has been obtained from the sum of the value added of private industries (multiplying the value added of the industries of each province by the proportion of the number private workshops to the total number of
workshops of each province1), private mine (multiplying the value
added of the mine sector by the proportion of the number of mines exploited by the private sector of each province to the total number of mines of each province), and private construction (the value added of the construction sector of each province multiplied by the proportion of the value added of private construction to the value added of the total construction sector (national)).
The private value added of the agricultural sector of each province has been obtained from the sum of value added of agriculture, hunting
and forestry, and fishing sector of each province2. The private value
added of services sector has been obtained from the sum of value added retailing, wholesale, hotel, restaurant, transportation and
warehousing, communication, financial intermediation3, education4,
health5, and the other public, social, private, and domestic services.
Due to the shortage of information on provincial capital stock, and according to the studies performed in the field of estimating the capital stock of the regions by the national capital stock, we use the proportion of the value added of the sector i in the province j to the total national value added of the sector i, as a proxy to convert the national capital stock to the province capital stock (Derbyshire, Waights and Gardiner, 2013: 6–7). In this way, the capital stock of the
1. The proportion of the number of private workshops of each province to the total number of the workshops of each province has been considered as a proxy for the private percent of the value added of the private industry of each province.
2. Regarding to the statistics of the Central Bank, more than 90 percent of the agricultural sector is privately owned.
industrial sector of the province j is summed up by multiplying the national capital stock of the industrial sector by the proportion of the value added of the industrial sector in the province j to the national value added of the industrial sector. Then we use the proportion of the private fixed capital formation of the machineries to the total capital formation, as a proxy to convert the capital stock of the industrial sector of the province j to the private capital stock of industrial sector of each province. Furthermore, in order to estimate the private capital stock of the service sector, the capital stock of the service sector of each province is multiplied by the proportion of the private fixed
capital formation to the total fixed capital formation of construction1.
It should be noted that the total capital stock of the agricultural sector of each province, has been appraised as a private capital stock. The public capital stock of energy, water, ICT, education and healthcare infrastructures of each province, according to each province’s share of capital assets acquisition credits in the account total is calculated.
The employment of the main sectors (industry, services and agricultural) of each province is obtained by multiplying the share of the employed persons (10 year and more) of each sector of the province by the total number of the employed persons (10 years and more) of that province. Then, we use the proportion the number of the employed persons of the private sector of workshops with 10 workers and more to the total employed persons of workshops with 10 workers and more in the industry as a proxy for a number of workers employed in the private industry of the province is used. Moreover, all of the privately employed persons of the service sector are obtained by multiplying the private percent of this sector by the number of employed persons in the service sector and the total number of the employed persons in agricultural sector is considered private.
6.Estimation Result
In this study, to investigate the impact of all types of infrastructures on the economic growth of the main sectors of the provinces, we used the Cobb-Douglas production function approach by utilizing the panel data method.
First, by selecting between the panel data and the pooled data
method, the F-Limer statistic was used. In this test, the null hypothesis indicated the similarity of intercepts (pooled data) and its alternative hypothesis based on the intercept differentials (panel data). Either in the case of non-rejection of the null hypothesis of F-Limer statistic, or rejection of the alternative hypothesis, based on the panel data, the outcomes are the same. Hence, the model is estimated in the form of pooled data. If the null hypothesis of F-Limer statistic about the similarity of outcomes (pooled data) is rejected, the alternative hypotheses based on the panel data are accepted. If the panel data become confirmed, we estimate their fixed or random effects. Selecting one of these two effects to estimate the model, is done by using the Hausman test. The null hypothesis of Hausman test gets specified based on the data random effects. Non-rejection of the null hypothesis of the test means that there are random effects, and rejecting it displays the fixed effects in the model.
In case of rejecting the null hypothesis of the Hausman test statistic, the test for heteroskedasticity and serial correlation between
the residuals are performed. The constant variance1 test of the
residuals of a fixed-effect regression model is performed by the modified Wald statistic for groupwise heteroskedasticity. Then, Wooldridge test (2002) for the serial correlation of the residual in the
fixed- effect regression model2 is investigated.
Peterson (2007) states that in case of the existence of serial correlation and heteroskedasticity of the residuals, estimation of the standard deviation is not accurate, and consequently, the statistical inferences will not be valid. In case of heteroskedasticity, the unbiased and consistent estimators of the OLS of the fixed effects are not changed, but they do not have the minimum variance (efficent). When the variances are not minimum or efficent, the confidence intervals are not reliable and consequently, investigate the significance of the coefficients by using the standard deviation and t statistics of the OLS of the fixed-effect regression is not appropriate. Thus, the heteroscedasticity and serial correlation problems should be resolved.
It is notable that to eliminate the problems of heteroskedasticity and
serial correlation of the residuals, we can use the two methods of Feasible Generalized Least Squares (FGLS) and the Panel Correlated
Standard Errors (PCSE)1. Beck and Katz (1995) indicate that the use of
FGLS method for panels with short time period and a lot of cross-section units is not possible and they suggest using the least squares coefficient with the modified panel standard deviation. Also the efficiency advantage of FGLS over PCSE is at best slight, except in extreme cases of cross-sectional correlation, and then only when the number of time periods (T) is at least twice the number of cross-section units (N). Since in this study, the period is shorter than the number of cross-section (the number of provinces), in case of heteroskedasticity and serial correlation of residuals, we will use PCSE method.
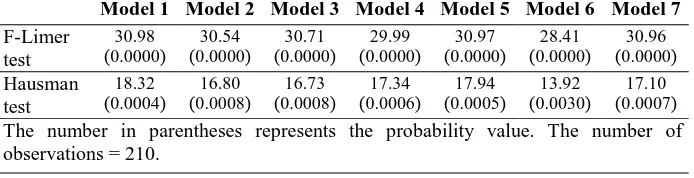
F-Limer and Hausman tests for the models2 of industry sector
(considering the different infrastructures) are reported in the table 1. According to the results of table 1, the null hypothesis of the F - Limer test is rejected in all models and the alternative hypothesis based on the panel data is accepted. After confirming of the panel data model, fixed or random effects through using of the Hausman test are investigated. According to the results of table 1, the null hypothesis of the Hausman test based on the random effects of the statistical data of the table 1 is rejected and its alternative hypothesis based on the fixed effects in all models of industrial sector is accepted.
Table 1: The Results of F Limer and Hausman Tests in the Industry Sector Model 7 Model 6 Model 5 Model 4 Model 3 Model 2 Model 1 30.96 ( 0.0000 ) 28.41 ( 0.0000 ) 30.97 ( 0.0000 ) 29.99 ( 0.0000 ) 30.71 ( 0.0000 ) 30.54 ( 0.0000 ) 30.98 ( 0.0000 ) F-Limer test 17.10 ( 0.0007 ) 13.92 ( 0.0030 ) 17.94 ( 0.0005 ) 17.34 ( 0.0006 ) 16.73 ( 0.0008 ) 16.80 ( 0.0008 ) 18.32 ( 0.0004 ) Hausman test
The number in parentheses represents the probability value. The number of observations = 210.
Source: Research findings
1. Summarily it can be said that GLS method with giving reversed weight of variance to the variables cause that the observations with more dispersion get less weight and the observations with less dispersion get more weights and these observations are more effective in regression.
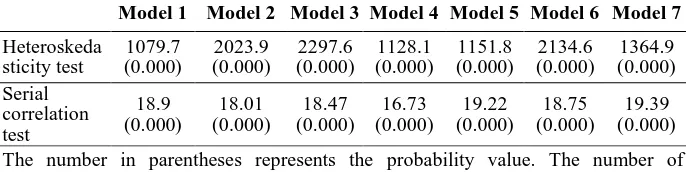
Then, the tests for heteroskedasticity and serial correlation of the residuals are performed. The results of both of them are presented in table 2. According to the results of table 2, the null hypothesis of these tests in all models of industrial sector are rejected and hence, the residuals in the fixed-effect models estimated in the industrial sector have heteroskedasticity and first-order autocorrelation. Thus, regarding to the heteroskedasticity and serial correlation of residuals, the least square method with the panel correlated standard errors is used to estimate the models of industry sector. The results of this estimation are reported in table 3.
Table 2: The Results of Heteroskedasticity and Serial Correlation Tests in the Industry Sector Model 7 Model 6 Model 5 Model 4 Model 3 Model 2 Model 1 1364.9 ( 0.000 ) 2134.6 ( 0.000 ) 1151.8 ( 0.000 ) 1128.1 ( 0.000 ) 2297.6 ( 0.000 ) 2023.9 ( 0.000 ) 1079.7 ( 0.000 ) Heteroskeda sticity test 19.39 ( 0.000 ) 18.75 ( 0.000 ) 19.22 ( 0.000 ) 16.73 ( 0.000 ) 18.47 ( 0.000 ) 18.01 ( 0.000 ) 18.9 ( 0.000 ) Serial correlation test
The number in parentheses represents the probability value. The number of observations = 210.
Source: Research findings
Results of table 3 indicate that the effectiveness of the social infrastructures on the economic growth of the industry sector of provinces (model 2) is more significant than the economic infrastructures (model 1). Thus, as it was mentioned in the theoretical section, the social infrastructures improve the human capital, and as the human capital increases in a region, the productive power of people will enhance, and it is expected the production to be accelerated. Hence, increase in the human capital of the region creates the power and capability of attracting technologies, and using it increases the total productivity of the economy of the region, and causes the innovation and permanent increase of the regional growth.
the very low values of government’s investment in this field. Also in all production functions, private capital significantly strengthens the region's industrial sector. In addition, results indicate that the production factors of the private capital stock and workforce associated with the ICT infrastructures’ capital, consolidate the
industry sector of provinces1. In fact, these results confirm the
mentioned theoretical principles.
Results of table 3 show that the capital stock of energy has the most impact on the economic growth of the industry sector. This result confirms the viewpoint of Berndt and Wood (1975) and Denison (1985). In fact, investment on the energy infrastructures enables access to the reliable and clean energy with competitive prices, and determines the regional competition of the industry sector. Then, the healthcare and education infrastructures have the most impact on the economic growth of the provinces’ industry sector, rather than the other infrastructures. The results presented in table 3 illustrate that to develop the industry sector of provinces, investment on the energy infrastructures and the other types of infrastructures should be considered.
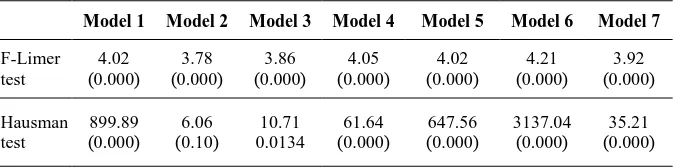
In the following, the effectiveness of all types of infrastructures on the provinces’ service sector are investigated. According to the results of table 4, in all models of the service sector, the null hypothesis of F-Limer statistic based on the pooled data is rejected and its alternative hypothesis based on the panel data is accepted. After confirming of the statistical panel data in the models of the service sector, the fixed effects of the statistical data are confirmed with the rejection of Hausman test.
Table 3: Effect of Infrastructure Types on Regional Economic Growth in Industry Sector by Using PCSE (Dependent Variable: Real Value Added of Industry Sector)
Model 7 Model 6 Model 5 Model 4 Model 3 Model 2 Model 1 Variables .6639 ( 0.0000 ) .6121 ( 0.0000 ) .67270 ( 0.0000 ) .6132 ( 0.0000 ) .6334 ( 0.0000 ) .6204 ( 0.0000 ) .6556 ( 0.0000 )
lnLit1
.4297 ( 0.0000 ) .3788 ( 0.0000 ) .4326 ( 0.0000 ) .40856 ( 0.0000 ) .4115 ( 0.0000 ) .4079 ( 0.0000 ) .4273 ( 0.000 )
lnKit2
.0175 ( 0.677 ) , .inf . lnGit econ 3
.0641 0.094 , .inf .
lnGit soc 4
.0506 ( 0.168 ) , .inf .
lnGitEdu
5
.0632 ( 0.012 ) , .inf .
lnGitHea 6
-.0040 ( 0.89 )
, .inf .
lnGitWater
7
.10409 ( 0.0000 )
, .inf .
lnGitEnergy 8
.00618 ( 0.778 )
, .inf .
lnGitCom
9 -2.498 ( 0.0000 ) -2.054 ( 0.000 ) -2.561 ( 0.0000 ) -2.107 ( 0.0000 ) -2.363 ( 0.0000 ) -2.3096 ( 0.0000 ) -2.514 ( 0.0000 ) Constant 0.777 0.799 0.777 0.786 0.780 0.781 0.7775 R-square 3791.3 ( 0.0000 ) 13367.6 ( 0.000 ) 3621.4 ( 0.0000 ) 9065.6 ( 0.0000 ) 4660.6 ( 0.0000 ) 5375.3 ( 0.0000 ) 4110.23 ( 0.0000 ) Wald chi2
The number in parentheses represents the probability value. The number of observations = 210.
Source: Research findings
1. The logarithm of the number of people employed in private industry sector. 2. The logarithm of real private capital stock in Industry sector
3. The logarithm of real productive public capital stock(consists of water, energy, communications and information technology infrastructures).
4. The logarithm of real social public capital stock(consists of education and healthcare infrastructures).
Table 4: The Results of F-Limer and Hausman Tests in the Service Sector Model 7 Model 6 Model 5 Model 4 Model 3 Model 2 Model 1 3.92 ( 0.000 ) 4.21 ( 0.000 ) 4.02 ( 0.000 ) 4.05 ( 0.000 ) 3.86 ( 0.000 ) 3.78 ( 0.000 ) 4.02 ( 0.000 ) F-Limer test 35.21 ( 0.000 ) 3137.04 ( 0.000 ) 647.56 ( 0.000 ) 61.64 ( 0.000 ) 10.71 0.0134 6.06 ( 0.10 ) 899.89 ( 0.000 ) Hausman test
The number in parentheses represents the probability value. The number of observations = 210. Source: Research findings
Then, the heteroskedasticity and serial correlation tests for residuals are performed. Results of these two tests are presented in table 5. According to the results of table 5, the null hypothesis is rejected and the residuals in the models of fixed effects estimated in
the service sector have heteroskedasticity and first-order
autocorrelation. Due to the heteroskedasticity and serial correlation of the residuals, the least square method with the panel correlated standard errors is used to estimate the models of the service sector. The results of estimation are presented in table 6.
Table 5: The Results of Heteroskedasticity and Serial Correlation Tests in the Service Sector Model 7 Model 6 Model 5 Model 4 Model 3 Model 2 Model 1 5875.5 ( 0.000 ) 5080.2 ( 0.000 ) 5886.1 ( 0.000 ) 12870 ( 0.000 ) 6957.6 ( 0.000 ) 8781.6 ( 0.000 ) 5947.3 ( 0.000 ) Heteroskedasticity test 9.119 ( 0.005 ) 10.616 ( 0.003 ) 8.863 0.006 7.789 ( 0.01 ) 8.828 ( 0.006 ) 8.552 ( 0.007 ) 8.914 ( 0.006 ) Serial correlation test
The number in parentheses represents the probability value. The number of observations = 210.
Source: Research findings
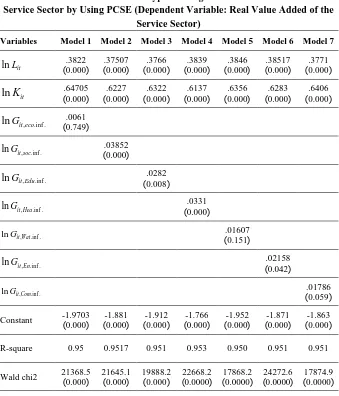
Results of table 6 indicate that the effectiveness of the social infrastructures on the economic growth of the provinces’ service
sector1 (model 2) is more significant than the economic infrastructures
(model 1). The results show that the improvement of human capital in service sector like the industry sector causes more economic growth of this sector.
According to the results of table 6, all types of the public capital stock, separately have a positive influence on the economic growth of the provinces’ service sector. Also in all production functions, private capital and the workforce significantly strengthens the region's service sector. The private capital associated with the ICT infrastructures’ capital, and the workforce combined with the energy infrastructures, consolidate the service sector of provinces. In fact, in case that the policymakers seek for more effectiveness of the private capital (increase private investment) and workforce (increase employment) on the growth of the service sector of provinces, they should develop the ICT and energy infrastructures, respectively.
Results of table 3 show that the healthcare infrastructures has the most impact on the economic growth of the service sector; then the infrastructures of education, energy, ICT, and water are respectively considered as the effective infrastructures on the economic growth of the provinces’ service sector. These results indicate that improvement in the human capital in the service sector is very significant. It should be noted that the level of the healthcare and education infrastructures in the determination of economic performance, competitive structure and job creation are significant (European Commission, 2004). Therefore, it can be said that to develop the service sector of provinces, investment on all types of infrastructures especially on social infrastructures are necessary.
Table 6: Effect of Infrastructure Types on Regional Economic Growth in the Service Sector by Using PCSE (Dependent Variable: Real Value Added of the
Service Sector)
Variables Model 1 Model 2 Model 3 Model 4 Model 5 Model 6 Model 7
lnLit .3822(
0.000
) ).375070.000(
.3766 ( 0.000
) ).38390.000(
.3846 ( 0.000
) ).385170.000(
.3771 ( 0.000 )
lnKit .64705(
0.000 ) .6227 ( 0.000 ) .6322 ( 0.000 ) .6137 ( 0.000 ) .6356 ( 0.000 ) .6283 ( 0.000 ) .6406 ( 0.000 )
, .inf .
lnGit eco
.0061 ( 0.749 )
, .inf .
lnGit soc .03852
( 0.000 )
, .inf .
lnGitEdu .0282
( 0.008 )
, .inf .
lnGitHea .0331
( 0.000 )
, .inf .
lnGitWat
.01607 ( 0.151 )
, .inf .
lnGitEn .02158
( 0.042 )
, .inf .
lnGitCom
.01786 ( 0.059 )
Constant -1.9703(
0.000
) )-1.8810.000(
-1.912 ( 0.000
) )-1.7660.000(
-1.952 ( 0.000
) )-1.8710.000(
-1.863 ( 0.000 )
R-square 0.95 0.9517 0.951 0.953 0.950 0.951 0.951
Wald chi2 21368.5(
0.000
) 21645.1)0.000(
19888.2 ( 0.000
) )22668.20.0000(
17868.2 ( 0.0000
) )24272.60.0000(
17874.9 ( 0.0000 )
The number in parentheses represents the probability value. The number of observations = 210.
Source: Research findings
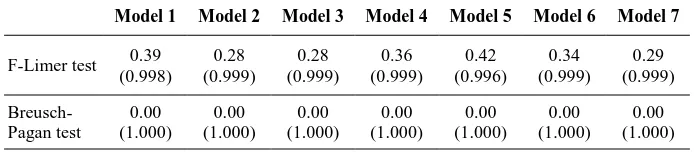
Table 7: The Results of F Limer and Breusch-Pagan Test in the Agriculture Sector
Model 7 Model 6
Model 5 Model 4
Model 3 Model 2
Model 1
0.29 (0.999) 0.34
(0.999) 0.42
(0.996) 0.36
(0.999) 0.28
(0.999) 0.28
(0.999) 0.39
(0.998) F-Limer test
0.00 (1.000) 0.00
(1.000) 0.00
(1.000) 0.00
(1.000) 0.00
(1.000) 0.00
(1.000) 0.00
(1.000)
Breusch-Pagan test
The number in parentheses represents the probability value. The number of observations = 210.
Source: Research findings
According to the results of the table 7, failed to reject the null hypothesis and conclude that random effects model is not appropriate. This is, no evidence of significant differences across provinces, therefore, to estimate relationships between private capital stock, employment, public capital stock and agricultural production, a simple OLS regression is runed.
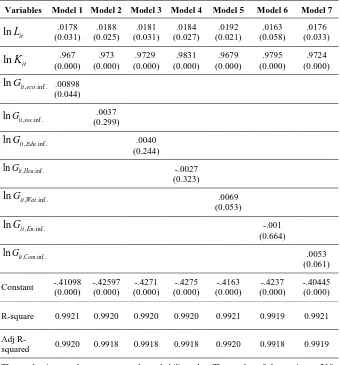
Table 8: Effect of Infrastructure Types on Regional Economic Growth in the Agriculture Sector by Using OLS (Dependent Variable: Real Value Added of Agriculture Sector) Model 7 Model 6 Model 5 Model 4 Model 3 Model 2 Model 1 Variables .0176 (0.033) .0163 (0.058) .0192 (0.021) .0184 (0.027) .0181 (0.031) .0188 (0.025) .0178 (0.031) lnLit
.9724 (0.000) .9795 (0.000) .9679 (0.000) .9831 (0.000) .9729 (0.000) .973 (0.000) .967 (0.000) lnKit
.00898 (0.044)
, .inf .
lnGit eco
.0037 (0.299)
, .inf .
lnGit soc
.0040 (0.244)
, .inf .
lnGitEdu
-.0027 (0.323)
, .inf .
lnGitHea
.0069 (0.053)
, .inf .
lnGitWat
-.001 (0.664) , .inf .
lnGitEn
.0053 (0.061)
, .inf .
lnGitCom
-.40445 (0.000) -.4237 (0.000) -.4163 (0.000) -.4275 (0.000) -.4271 (0.000) -.42597 (0.000) -.41098 (0.000) Constant 0.9921 0.9919 0.9921 0.9920 0.9920 0.9920 0.9921 R-square 0.9919 0.9918 0.9920 0.9918 0.9918 0.9918 0.9920 Adj R-squared
The number in parentheses represents the probability value. The number of observations = 210.
Source: Research findings
Results of table 8 show that the water infrastructure has the most impact on the economic growth of the agricultural sector. Then the ICT and education infrastructures have more impact on the economic growth. Results indicate, the necessity of paying attention to the investment in all types of the infrastructure, especially development of water and ICT infrastructures to develop the agricultural sector of provinces.
regions, monitoring the surface and deep waters, and transferring lines among the provinces. Lands’ drainage is performed for two fundamental purposes, reviving the unusable lands and improving the existing agricultural lands. Today, drainage plays a very significant role, including reviving or sweeting the lands, water management, issues related to the environment or the water quality; these are from the issues considered in implementation of drainage plans. Moreover, today, drainage is not only carried out to increase the products, but also for decreasing production costs, providing conditions for producing various products, improvement of the economic, social and health conditions of farmers, and so on. Thus, development of water infrastructures for the development of the agricultural sector is very significant.
7.Summary and Conclusion
Development of social and economic infrastructures in any region is considered as very fundamental measures of the economic growth. The infrastructures stimulate the economic activities, increase the private inputs’ productivity, improve the economic performance which results in sustainable economic development, expand the public welfare, and upgrade better income distribution. Thus, investment in various infrastructures can be considered as a powerful tool of the regional policy to develop each of the sectors and eliminate the regional imbalance. Hence, determining the effectiveness rate of each of the economic and social infrastructures as one of the production function inputs (and influential in the productivity of the other inputs) on the economic growth of the main sectors of the regional economy is an important serious.
tests for the residuals were performed. The result of these tests indicate heteroskedasticity and serial correlation in the residuals of the service and industry sectors models. Therefore, regarding to heteroskedasticity and serial correlation in the residuals, the least square method with the panel correlated standard errors was used to investigate the models of the service and industrial sectors.
In accordance with the results of this study, the public infrastructures of social and economic have positive effects on the economic development of economy’s main sectors of the provinces. According to the study, social infrastructures are more effective in the industry and service sectors, and economic infrastructures are more effective in the agricultural sector, rather than the other infrastructures. In addition, results show that energy infrastructures are more effective in the economic growth of industry sector, and water infrastructures are more influential of the economic growth of agricultural sector; also healthcare infrastructures are more effective in the economic growth of the service sectors.
This study shows that it is necessary to plan, regarding to the lack of investment resources in infrastructures and the provinces’ need, in order to achieve the balanced development of the sectors with relative advantages in regions, and an increase in the public welfare. In this regard, in order to reduce unemployment and encourage investments of the private sectors which result in sustainable growth, we should focus on the balanced and the simultaneous development of economic and social infrastructures of undeveloped provinces.
References
Akbarian, R., & Ghaedi, A. (2012). Investment in Economic
Infrastructure and Its Effect on Economic Growth. Journal of Economic
Growth and Development (Scientific Research), 1(3),11–48.
Aschauer, D. A. (1989). Is Public Expenditure Productive. Journal of
MonetaryEconomics, 23, 177–200.
Babazadeh, M., Ghadimi, Kh., & Mohseni, R. (2010). Effects of Investment in the Transport Sector on Economic Growth in Iran.
Baltagi, H. B., & Pinnoi, N. (1995). Public Capital Stock and State Productivity Growth: Further Evidence from an Error Components
Model. Empirical Economics, 20(2), 351–359.
Baltagi, H. B. (2005). Econometric Analysis of Panel Data (3rd Ed.).
Chichester: John Wiley & Sons Ltd.
Derbyshire, J., Gardiner, B., & Waights, S. (2013). Estimating the
Capital Stock for the NUTS2 Regions of the EU27. Applied
Economics, 45(9), 1133–1149.
Dougherty, C. (2011). Introduction to Econometrics (4th Ed.). Oxford:
Oxford University Press.
Eberts, R. W. (1990). Public Infrastructure and Regional Economic
Development. Economic Review, 26(1), 15–27.
Evans, P., & Karras, G. (1994). Is Government Capital Productive?
Evidence from a Panel of Seven Countries. Journal of
Macroeconomics,16(2), 271–279.
Everaert, G., & Heylen, F. (2004). Public Capital and Long-Term
Labour Market Performance in Belgium. Journal of Policy Modeling,
26(1), 95–112.
Fan, S., & Zhang, X. (2004). Infrastructure and Regional Economic
Development in Rural China. China Economic Review, 15(2), 203–
214.
Garcia-Mila, T., & McGuire, T. (1992). The Contribution of Publicly
Provided Inputs to States' Economies. Regional Science and Urban
Economics, 22(2), 229–241.
Ghorbani, M., Ahmadi Shadmehri, M. T., & Mostafavi, M. (2014). The Effect of Infrastructure on Economic Growth in Iran During
1977-2013. Journal of Economic Growth and Development (Scientific
Research), 5(17), 49-60.
Greene, W. H. (2012). Econometric Analysis (7th Ed.). New York:
Hanushek, E. A., Woessmann, L., Jamison, E. A., & Jamison, D. T.
(2010). Education and Economic Growth. International Encyclopedia
of Education, 2, 245–252.
Kamps, C. (2004). New Estimates of Government Net Capital Stocks for
22 OECD Countries 1960–2001. IMF Working Paper, Retrieved from
https://www.imf.org/en/Publications/WP/Issues/2016/12/30/New- Estimates-of-Government-Net-Capital-Stocks-for-22-OECD-Countries-1960-2001-17318.
Marzban, H. (2011). The Role of Health and Education in the Economic Growth of Some Developing Countries (1990-2006).
Journal of Economic Knowledge, 1, 33–49.
Munnell, A. H. (1992). Infrastructure Investment and Economic
Growth. Journal ofEconomic Perspective, 6(4), 189–198.
Mehmet, A. K., Seyhan T., & Serkan, A. (2015). The Impact of
Infrastructure Expenditure Types on Regional Income in
Turkey. Regional Studies, 49, 1509–1519.
Moomaw, R. L., Mullen, J. K., & Williams, W. (1995). The
Interregional Impact of Infrastructure Capital. Southern Economic
Journal, 61(3), 830–845.
Petersen, M. A. (2009). Estimating Standard Errors in Finance Panel
Data Sets: Comparing Approaches. The Review of Financial Studies,
22(1), 435–480.
Meeks, R. (2012). Water Works: The Economic Impact of Water
Infrastructure. Harvard Environmental Economics Program, Retrived
from http://heep.hks.harvard.edu/files/heep/files/dp35_meeks.pdf.
Wooldridge, M. (2002). Econometric Analysis of Cross-section and