DOI: 10.22059/poll.2018.260705.466
Print ISSN: 2383-451X Online ISSN: 2383-4501 Web Page: https://jpoll.ut.ac.ir, Email: [email protected]
The Study of CO Symptoms' Impacts on Individuals, Using GIS
and Agent-based Modeling (ABM)
Jalali, S. H.1*, Vafaeinejad, A. R.2, Aghamohammadi, H.3 and Esmaeili Bidhendi, M.4
1. Department of GIS & RS, Science and Research Branch, Islamic Azad University, Tehran, Iran
2. Faculty of Civil Engineering, Water and Environmental Engineering, Shahid Beheshti University, Tehran, Iran
3. Department of GIS & RS, Science and Research Branch, Islamic Azad University, Tehran, Iran
4. Graduate Faculty of Environment, University of Tehran, Tehran, Iran
Received: 23.06.2018 Accepted: 09.11.2018
ABSTRACT: The purpose of this study is to use both agent-based modeling as a new method in modeling dynamic phenomena and GIS to show the effects of carbon monoxide (CO) on individuals in the city of Tehran. After collecting the latest information about the severity of carbon monoxide pollutants on different days, one of the days with a very high severity of this pollutant has been selected for investigation and the interpolation map of its data has been developed via IDW method in ArcGIS software environment, which is then re-classified with the NetLogo software environment used to run the agent-based model. At this stage, the agents are randomly produced in four different age groups in the environment and begin moving with the onset of the running process in the environment. Also, the symptoms, caused by the pollution effects on the agents, appear in form of changes in color and are based on carboxyhemoglobin (COHb) levels (percentage) of each. The results indicate that among the considered older age groups, the members of the age group above 65, have had been mostly affected by pollution and the effect of pollution on the agents of the age group of 13 to 30 years old has been less than the other groups.
Keywords: Air Pollution, Agent-based Modeling, GIS, Carboxyhemoglobin (COHb), Tehran.
INTRODUCTION
Air pollution is a worldwide problem for environment and health (Li et al., 2018). Expansion of urbanization, urban
development, population growth,
development of industrial activities, increased fossil fuel consumption, lack of efficient public transport system, and low quality of
Corresponding Author, Email: [email protected]
role in generation of the pollutants (Prez-Martinez et al., 2014). In Tehran metropolis, inappropriate public transportation infrastructure, non-standard streets and highways, population congestion, lack of efficient urban planning and management, and other different causes have caused the traffic jam dilemma (Vafa-arani, 2014).
Undoubtedly, air pollution is a substantial risk factor for human health as well as the quality of life (Ozcan & Cubukcu, 2015). Accordingly, if we want to refer to some of the most important problems arising from exposure to high volumes of pollutants, we can remark respiratory problems, exacerbation of people’s cardiovascular diseases, and even early deaths (Esposito et al., 2014). To add salt to injury, air pollution has many negative impacts on children, creating a variety of respiratory problems for them. Massive exposure to high levels of air pollutants disrupts lung growth of children, impairing their respiratory function (Viera et al., 2009). Today, air pollutant sources in cities are categorized into two fixed and mobile groups. Mobile-sourced (such as cars and motorcycles) pollutants are considered one of the major sources of air pollution in large cities. In addition, the fixed sources like heavy industries in cities and power plants that use low-quality fuels thus creating high levels of heat and sulfur are also considered other pollution sources (Tasdemir et al., 2005).
In general, different pollutants in the air could be divided based on their production source, chemical compositions, size, and release mode in an open or a closed environment. Accordingly, pollutants, directly coming from their sources into the air, are primary pollutants, while those, resulted from chemical reactions with other pollutants or gases within the atmosphere, are secondary ones (Bernstein et al., 2004). Among the various pollutants, the main and predominant pollutants in urban air are carbon monoxide (CO), Particulate Matter (PM), ozone (O3), nitrogen oxides (NOX),
and sulfur dioxide (SO2) (Zvyagintev et al., 2014).
Carbon monoxide (CO) is one of the major pollutants in urban air, which is very effective in lowering blood oxygen levels and developing lung infection and its consequent problems. Carbon monoxide binds with the hemoglobin in the lungs, creating carboxyhemoglobin (COHb) which reduces blood's capacity to carry oxygen to human body tissues, resulting in hypoxia in the tissues, themselves (Tao et al., 2011). Several surveys have dealt with air pollution and its impacts in different countries along with Tehran; and they can be categorized into several general formats. Investigation of these studies shows that some always aim at estimating the amount of air pollutants in cities and determining their distribution (Naughton et al., 2018). This has often been done via mathematical modeling and multivariate regression such as Land Use Regression (LUR) (Habermann et al., 2018). In addition, other researches tend to integrate GIS with dynamic modeling methods like agent-based modeling, spatial time model, etc., in order to simulate and display the impacts of air pollution on people. At the same time, GIS' ability to analyze and model different phenomena has made it a likely tool to be used in different studies on pollution effects, such as the ones that establish databases for storing spatial information of pollutants, model air pollution, estimate pollution-related impacts on individuals, and determine the relevant patterns (Stroh, 2010).
to share the aims, constraints, etc., anticipates and reacts with flexibility to its environment, learns from its experiences, and adapts to its environment” (Kanth, 2017). Additionally, based on the definition provided by Maes, “an agent is a system, trying to fulfill a set of goals in a complex dynamic environment.
An agent is situated in the environment: it can sense the environment through its sensors and act upon the environment using its actuators” (Hosseinali & Alesheikh, 2013). What is more, based on their reaction and type of behavior in the environment, agents can be defined from a passive range level, capable of only reacting (simple reactive agents) to a level of intelligence which they can understand, or even predicting the environment (smart agents) (Russell & Norvig, 2003). Creation and development of agent-based models require a software platform for which there are two main methods (Abar et al., 2017). One is to use tools and software programs available for users like NetLogo, Agent Analyst, Swarm, Mason, and AgentSheets; and the other to code the model from its basis and use programming languages like Java and C++ (Crooks et al., 2012). The main idea and purpose of this paper is, therefore, to use GIS and agent-based modeling for simulation of urban dynamic phenomena in order to evaluate the effects of CO on inhabitants of Tehran.
MATERIAL AND METHODS
Prior to performing any research work, it is necessary to specify the process of work step by step, which will make it possible to determine the ultimate goal precisely. In this research, the stages of work are divided into three sections. The first part involves providing data that must be first collected. The second part is related to preparation of such data as well as using an interpolation method to prepare the concentration map of the desired pollutant with the help of GIS software. As for the
third part, it concerns determination of agent-based model scenario, needed to be implemented after zoning the desired pollutant. According to the conducted investigations, descriptive and spatial data are required to perform the modeling process, such as:
Spot Layer related to the location of the air pollution monitoring stations Data related to carbon monoxide
concentration for each station Polygonal layer of Tehran city
In order to conduct the current research, the latest information on carbon monoxide pollutant was first gathered from Air Pollution Control Company. It was from 21 active stations in Tehran, the information of which had been recorded hourly. After collecting the data, it was investigated to find the date with the highest level of CO pollutant intensity, namely October 19 in the present work, the data of which was then used for the modeling process. The goal of preparing CO pollutant concentration data was to provide a pollution distribution map for all areas of Tehran.
To this end, one can use a variety of GIS software programs, ArcGIS 10 in this study. GIS is a convenient way to display input and output of a geospatial model (Vahidnia et al., 2018; Bolouri et al., 2018; Vafaeinejad, 2017; Vafaeinezhad et al., 2010).
Tehran. One of the most important tools in ArcGIS is Geostatistical Analyst, which can be employed to interpolate different levels. There are several methods in order to perform interpolation. In order to achieve the best possible accuracy, this study used IDW method. In general, the IDW interpolation method is based on the idea that the effect of the desired phenomenon decreases via increasing the distance.
Once the interpolation process is performed, it is necessary to reclassify the produced CO concentration maps so that a proper classification could be achieved. Here, the reclassify tool in the ArcGIS software was used for this purpose. The tool made it possible to change the number as well as the range of each of the classes, related to the extent of CO pollution, by entering the contamination distribution maps obtained through the interpolation methods. In this section, the range of each class was considered 2 ppm, based on the CO concentration, with the number of classes determined, based on minimum and maximum CO concentrations. Each new class got separated by different colors.
By defining the output of the interpolation maps and classifying them in GIS, the time of implementing the agent-based model arrived. In order to implement the agent-based model, various software programs were investigated in this research. Among these, NetLogo 5.1 software was selected as the appropriate one, thanks to its many advantages in relation to other agent-based software programs in achieving the goals of the study.
As aforementioned, one can display individuals, groups of individuals, and objects like houses or cars with agents (Malleson et al., 2010). In the agent-based model, developed in this research, individuals were considered as agents. Since elderly and children are more likely to show various air pollution-induced signs, the age agent was regarded the main characteristic of the agents’ set. In the desired model, the agents were divided into
four age groups, namely under 12 years old (children), 13 to 30 years old (teenagers), 31 to 64 years old (adults), and over 65 years old (the aged). The factors related to each age group had a specific shape, being in different sizes, so that the age groups could be distinguished from each other.
In order to achieve better and more realistic results, the model was designed in such a way that users could determine the number of agents, using the sliders embedded in the user interface. At the start of the implementation process of the model, the agents related to each age range firstly got generated in random within the related environment with regard to the
considered number. The target
environment was the same classified map related to the carbon monoxide concentration in Tehran, developed by means of ArcGIS software. The resulting GIS map got inserted into NetLogo software program through code writing.
Table 1. The effects of COHb values on the agents
COHb value (%) Effect’s description
Less than 1 No specific effect was seen
1 to 2 Few behavioral effects appeared
2 to 5 Effects on the nervous system, vision, and
incidence of psychological symptoms
5 to 10 Disorders of body organs
10 to 20 Incidence of chronic headaches
The effects on the agents appeared in such a way that the agents moved in the environment and over each hour, with their amount of COHb, calculated and added to the previous values. The symptoms, caused by this increase of the agents, appeared as a change of their color. In other words, if the percentage of COHb of agents remained within the range of the table above, their colors changed, accordingly. It should be noted that when the model reached number 12, its implementation process was stopped and the agents finished moving. The user interface was also designed in such a way that at any moment, the number of agents could be seen according to their color and age range with the help of different graphs and displays.
RESULTS AND DISCUSSION
As aforementioned, the IDW interpolation method was used in ArcGIS software in order to create a map to be used in the agent-based model. By linking the descriptive information about the extent of air pollution to the spot data of the stations, such information was called in the software environment and the data interpolation was performed by selecting the IDW method from the Geostatistical Analyst tool. After the interpolation, it was determined that the
obtained root mean square (RMS) error was equal to 1.3690. It is noteworthy that four distinct spots (4 Sectors) were used for interpolating data and determining the values of unknown spots. The obtained interpolation map was recalled in the software, with air pollution layers reclassified by means of the Reclassify tool.
Given that in the new classification, the range of CO concentration classes was 2 ppm, in the final obtained map, according to the intensity of CO pollutant at this day, three classes were obtained, ranging between 0 and 2 ppm, 2 and 4 ppm, and 4 and 6 ppm. Figure 1 demonstrates the maps from data interpolation as well as their reclassifications.
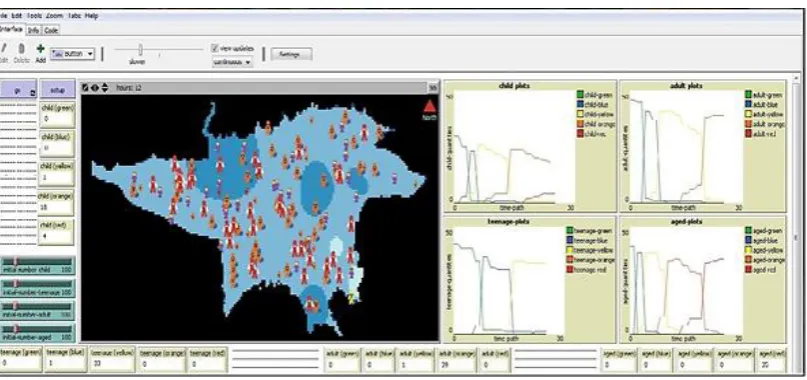
In order to implement the agent-based model by means of the user interface, designed in NetLogo software, the classified map of air pollution was called in the software environment. This was done with the help of the keys and sliders, embedded in the user interface, and a certain number of agents were produced for each age group in the environment. To create agents for each age group, a slider and a separate key was embedded in the user interface. Figure 2 shows the user interface, designed in the software for modeling effects.
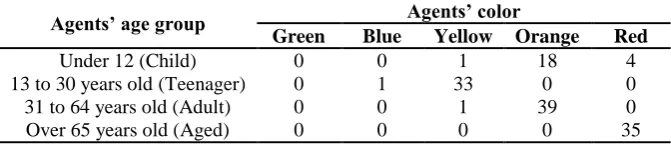
Table 2. color and number of agents in each age group, once the time is over
Agents’ color Agents’ age group
Red Orange
Yellow Blue
Green
4 18
1 0
0 Under 12 (Child)
0 0
33 1
0 13 to 30 years old (Teenager)
0 39
1 0
0 31 to 64 years old (Adult)
35 0
0 0
Fig. 1. Maps derived from Interpolation of CO data (right) and their classification (left)
Fig. 2. The user interface designed in NetLogo software for modeling the effects of CO Pollutant
After producing the agents, the model got implemented, which after 12 ticks, the results of the number of agents and the effects created in them were obtained, according to Table 2. As shown in this table, following the end of the modeling process in the children age group, among the agents in Tehran, there were one yellow, 18 orange, and four red agents. As aforementioned, the effects of CO pollutant on agents and their COHb increase appeared as changes in color of the agents. This change of color was in a way that green color was assigned to agents, produced in the environment, whose COHb fell below 1%. In addition, in the modeling process, the agents with percentage of COHb from 1% to 2%, 2% to 5%, 5% to
10%, and 10% to 20% were blue, yellow, orange, and red, respectively.
Based on what was mentioned above, it can be said that in the children age group, the four agents that became red suffered from chronic headache, the 18 orange ones had organ disorders, and the single agent to turn yellow just had a series of symptoms, appearing in the eyes as well as the nervous system.
for the adult age group, out of the 40 agents, one agent turned yellow and 39 others became orange, suffering from organ disorders. According to Table 2, the number of agents of the aged group in the map was 35, all of which turned red in the environment. In other words, all agents in this group suffered from chronic headaches after completing the modeling process. This indicated that the level of CO pollutant on the age group of above 65 years was higher than the other ones.
This study only considered the age parameter for the agents, due to the importance of this parameter in the rate of air pollution impacts on individuals. In other words, among different parameters like job, individuals’ mobility, etc., the individuals’ age was considered a parameter in the modeling process, leading to the division of the agents into four age groups.
CONCLUSION
If the present work is to be compared with a similar research, one can refer to the research by Mr. Khalesian et al. (2008), which employed a multi-agent modeling method and GIS in order to simulate traffic and its induced air pollution. The main similarity of both works is their use of a classified environment in GIS and its application in a multi-agent environment. Besides, similar to this study, the mentioned research employed data on CO pollutant and its intensity during the daylight for modeling. It goes without saying that the purpose of the abovementioned study was to model the traffic, thus using traffic parameters like the number of vehicles, fuel consumption rate, and cars' speed for modeling. (Khalesian et al., 2008)
Another differences between the two is the use of fuel parameters like volumetric gas flow rate and emission rate for modeling, used in the former but not in this work. Moreover, the other research utilized a local street as the sample for modeling and vehicles' movement as the agent,
whereas this paper used real data along with agents’ movement within Tehran. Thus, the effects of pollution on individuals were better represented, here.
Following the modeling process, it was necessary to evaluate and present the results obtained from the model. With regard to the outcome of the work and the obtained outputs, the results of modeling can be summarized as follows:
Results of implementing the proposed model show that among the considered age groups for agents, the effect of CO pollutant on the age group of above 65 years (the aged) was more than that the other age groups. In the meantime, the age group between 13 and 30 years (i.e., the teenagers) had been affected by the pollution less than the others. The obtained outcomes indicate the
fact that in some areas of Tehran where the CO concentration was higher, the effect of pollution on the agents was higher, too. For example, four agents in the children age group, whose color had turned red, were located around the Pounak station, considered one of the highly polluted areas. This also applied for other age groups, and agents located in areas with high levels of pollution had been affected more.
REFERENCES
Abar, S., Theodoropoulos, G. K., Lemarinier, P. and O’Hare, G. M. P. (2017). Agent Based Modelling and Simulation tools: A review of the state-of-art software. Comput. Sci. Rev., 24; 13-33.
Bernstein, J. A., Alexis, N., Barnes, C., Bernstein, L., Nel, A., Peden, D., Diaz-Sanchez, D., Tarlo, S. M. and Williams, P. B. (2004). Health effects of air pollution. Environ. Occup. Respir. Disord., 114(5); 1116-23.
Brauer, M., Hoek, G., Smit, J., Jongste, J.C., Postma, D.S., Gerritsen, J., Kerkhof, M. and Brunekreef, B. (2007). Air Pollution and the Development of Asthma, Allergy and Respiratory Infections in a Birth Cohort. Eur. Respir. J., 29; 879–888.
Bolouri, S., Vafaeinejad, A. R., Alesheikh, A. A. and Aghamohammadi, H. (2018). The ordered capacitated multi-objective location-Allocation problem for fire stations using spatial optimization. ISPRS Int. J. Geo-Inf., 7(2); 1-44.
Barn, P., Giles, L., Heroux, M. and Kosatsky, T. (2018). A review of the experimental evidence on the toxicokinetics of carbon monoxide: the potential role of pathophysiology among susceptible groups. Environ. Health., 17; 13.
Crooks, A. T., Heppenstall, A. J., See, L., Batty, M. (2012). Agent-Based Models of Geographical Systems. (New York: Springer Science)
Esposito, S., Galeone, C., Lelii, M., Longhi, B., Ascolese, B., Senatore, L., Prada, E., Montinaro, V., Malerba, S., Patria, M. F. and Principi, N. (2014). Impact of air pollution on respiratory diseases in children with recurrent wheezing or asthma. BMC. Pulm. Med., 14; 130.
Hosseinali. F. and Alesheikh, A. A. (2013). Assessing Urban Land-Use Expansion in Regional Scale by Developing a Multi-Agent System. Int. J. Hum., 20; 23-44.
Habermann, M., Billger, M. and Haeger-Eugensson, M. (2015). Land use regression as method to model air pollution. Previous results for Gothenburg/Sweden. Procedia Eng., 115; 21- 28.
Jain, S. and Khare, M. (2010). Adaptive neuro-fuzzy modeling for prediction of ambient CO concentration at urban intersections and roadways. Air Qual. Atmos. Health., 3(4); 203-212.
Khalesian, M., Pahlavani, P., Delavar, MR. (2008). GIS-based multi-agent traffic micro simulation for modelling the local air pollution. Int. Arch. Photogramm. Remote Sens. Spat. Inf. Sci., 37; 491-496.
Kanth, K. B. B. M. (2017). Agent-Based Modeling Based Artificial Intelligence Robot For Fire Extinguishing. Int. J. Eng. Res. Appl., 7; 38-42.
Kasereka, S., Kasoroa, N., Kyamakyab, K., Goufoc, E. F. D., Chokkid, A. P. and Yengoa, M. V. (2018). Agent-Based Modelling and Simulation for evacuation of people from a building in case of fire., Procedia Comput. Sci., 130; 10–17.
Li, Y., Guan, D., Tao, S., Wang, X. and He, K. (2018). A review of air pollution impact on subjective well-being: Survey versus visual psychophysics. J. Cleaner Prod., 184(20); 959-968.
Malleson, N., Heppenstall, A. and See, L. (2010). Crime reduction through simulation: An agent-based model of burglary. Comput. Environ. Urban syst., 34(3); 236–250.
Nuvolone, D., Maggiore, R. D., Maio, S., Fresco, R., Baldacci, S., Carrozzi, L., Pistelli, F. and Viegi, G. (2011). Geographical information system and environmental epidemiology: a cross-sectional spatial analysis of the effects of traffic-related air pollution on population respiratory health. Environ. Health., 10; 12.
Naughtona, O., Donnellya, A., Nolanbc, P., Pillad, P., Missteara, B. D. and Broderick, B. (2018). A land use regression model for explaining spatial variation in air pollution levels using a wind sector based approach. Sci. Total Environ., 630; 1324- 1334.
Ozcan, N. S. and Cubukcu, K. M. (2015). Evaluation of Air Pollution Effects on AsthmaDisease: The case of Izmir. Procedia Social Behav. Sci., 202; 448-455.
Prez-Martinez, P. J., Miranda, R. M., Nogueira, T., Guardani, M. L., Fornaro, A., Ynoue, R. and Andrade, M. F. (2014). Emission factors of air pollutants from vehicles measured inside road tunnels in Sao Paulo: case study comparison. Int. J. Environ. Sci. Technol., 11(8); 2155-2168.
Russell, S. and Norvig, P. (2003). Artificial Intelligence A Modern Approach. (Prentice Hall Series)
Stroh, E. (2010). The use of GIS in assessing exposure to airborne pollutants. (Sweden: Lund University)
Tasdemir, U., Cindoruk, S. and Esen, F. (2005). Monitoring of criteria air pollutants in bursa, turkey. Environ. Monit. Assess., 110; 227-241.
Vafa-Arani, H., Jahani, S., Dashti, H., Heydari, J. and Moazen, S. (2014). A system dynamics modeling for urbon air pollution: A case study of Tehran, Iran. Transp. Res., 31; 21-36.
Viera, L., Chen, K., Nel, A. and Lloret, M. G. (2009). The Impact of Air Pollutants as an Adjuvant for Allergic Sensitization and Asthma. Curr. Allergy Asthma Rep., 9(4); 327-333.
Vahidnia, M. H., Vafaeinejad, A. R. and Shafiei, M. (2018). Heuristic game-theoretic equilibrium establishment with application to task distribution among agents in spatial networks. J. Spat. Sci.
Vafaeinejad A. R. (2017). Dynamic Guidance of an Autonomous Vehicle with Spatio-Temporal GIS. Lect. Notes Comput. Sci., 10407; 502-511.
Vafaeinezhad, A. R., Alesheikh, A. A. and Nouri, J. (2010). Developing a spatio-temporal model of risk management for earthquake life detection rescue team. Int. J. Environ. Sci. Technol., 7(2); 243-250.