DESERT 16 (2011) 77-85
Assessment of the Palmer drought severity index in arid and semi
arid rangeland: (Case study: Qom province, Iran)
M.Azarakhshi
a*, M. Mahdavi
b, H.Arzani
b, H. Ahmadi
ca
Assistant professor, Technical and ٍEngineering Faculty of Torbat-e-Heydariyeh, Torbat-e-Heydariyeh, Iran
b
Professor, Faculty of Natural Resources, University of Tehran, Iran
c
Professor, Science and Research Branch, Islamic Azad University, Tehran, Iran
Received: 15 January 2007; Received in revised form: 1 September 2007; Accepted: 22 December 2007
Abstract
Drought is a normal, recurring feature of climate phenomena; it may occur virtually in all climatic regions. The effects of drought accumulate slowly and its impacts are spread over a larger geographical area than other natural hazards. Drought is a natural hazard originating from a deficiency of precipitation that result in a water shortage for some activities or some groups and is often associated with other climatic factors such as high temperatures, high winds and low relative humidity that can aggravate the severity of the event. Iran is frequently affected by recurring droughts. In this research the Qom province with an area 11500 km2 that located in an arid and semi arid region of
Iran was selected. Eighth site of rangeland were chosen that represented rangeland situation in the study area. In these sites relative factors such as plant cover , density, yield, regeneration ,land cover were measured in 60 plots with 2 m2 area along the 4 transect with 400 m along. Rangeland yield was measured with the cutting and weighting
method in a quarter of plots, and the total yield in each site was obtained from the regression models between plant cover and species yield. Data series were cumulated for 9 years (1998-2006). Palmer drought severity index (PDSI) carried out in this study. The objective of this study is to performance of the PDSI to assessment of drought in the rangeland of the Qom. The analysis of results indicated that each site growth season is different from another. The rangeland yield is not related to the annual rainfall, but the best relationship was between rainfall in growth season and range yield. Also the study showed that the highest frequency of significant models is related to March-July period.
Keywords: Drought; Growth season; Palmer Drought Severity Index (PDSI); Rangeland production
1. Introduction
Drought is a normal, recurring feature of climate; it occurs in virtually all climatic regimes. It is the consequence of a natural reduction in the amount of precipitation received over an extended period, usually a season or more in length. Drought is perhaps the most complex natural hazard (Wilhite, 2000). Drought is a slow-onset, creeping natural hazard that is a normal part of climate for virtually all regions of the world; it results in serious economic, social, and environmental impacts. Drought onset and end are often difficult to
Corresponding author. Tel.: +98 531 2291749, Fax: +98 531 2291749.
E-mail address: azar39m@yahoo.com
three categories could be defined as environmental droughts whereas the last one could be considered as water resources droughts (13,1).
The effects of drought accumulate slowly and its impacts are spread over a larger geographical area than are damages that result from other natural hazards. Drought is a natural hazard originating from a deficiency of precipitation those results in a water shortage for some activities or some groups and is often associated with other climatic factors such as high temperatures, high winds and low relative humidity that can aggravate the severity of the event. Drought differs from aridity in that the latter is restricted to low rainfall regions and is a permanent feature of the climate. Drought occurrences are common in virtually all climatic regimes.
Iran is frequently affected by recurring droughts (Morid et al. 2005). The most recent drought of 1998–2001 was the worst in the last 30 years with rainfall deficits consistently exceeding 60% of the mean annual rainfall in most of the country. The severity of this drought placed an extreme strain on water resources, livestock and agriculture. The Iranian Emergency Agency reported that 278 cities and 1050 villages had been affected by this drought. Also, the crops from a rain fed area of 4 million ha as well as those from an irrigated area of 2.7 million ha were completely destroyed. The total agricultural and livestock losses by the year 2001 were estimated to be US$2.6 billion. Eighteen out of the 28 provinces of the country were affected, but the impact of the drought differed throughout the country and some of the provinces were more hit than others.
A drought indicator, briefly defined, is a variable to identify and assess drought conditions (6). Common indicators are based on meteorological and hydrologic variables such as precipitation, stream flow, soil moisture, reservoir storage, and ground water levels. A drought trigger is a threshold value of the drought indicator that distinguishes a drought category, and determines when drought response actions should begin or end (20,22). Drought monitoring is an essential component of drought risk management. It is normally performed using various drought indices that are effectively continuous functions of rainfall and other hydro meteorological variables (12). A number of drought indices have been introduced and applied in different countries to date. Drought indices provide decision makers with information on drought severity and can be used to trigger drought. Many drought indices have
been developed to now. These include the Palmer Drought Severity Index (PDSI – Palmer, 1965), which is widely used in the United States, the deciles index (Gibbs and Maher, 1967), which is operational in Australia, the China-Z index (CZI), which is used by the National Metrological Center of China (Wu et al., 2001), the Surface Water Supply Index (SWSI – Shafer and Dezman, 1982) adopted by several states in the United States, and standardized precipitation index (SPI – McKee et al., 1993), which has gained world popularity, etc. Other indices are Bhalme and Mooley Drought Index (1980) - BMDI and Byun and Wilhite (1999) Effective Precipitation Index – EPI. The review of drought indices can be found in several sources .No index is ideal and/or universally suitable. The choice of indices for drought monitoring in a specific area should eventually be based on the quantity of climate data available and on the ability of the index to consistently detect spatial and temporal variations during a drought event (15). PDSI is one of the complete and best indeces to monitoring and assessment the drought in the World. PDSI commonly used to determine of agricultural drought. In this research PDSI was used to determinate the drought in the arid and semi arid rangelands of Iran. For this purpose Palmer drought severity index was calculated for 20 years period (1986-2006), and then the results compared with the rangeland yield. In order to find the capability of the PDSI to definite drought in the rangeland, summation of the monthly PDSI is calculated for 7 time steps (Annual, February to July, March to July, March to June, March to April and March)(16,10,18,21). Then the assessment is based on the highest determination coefficient (R2) between Palmer drought index and yield of rangeland (2, 4, 8, 13, 17, and 18). Also the relation between precipitation and rangeland yield was calculated and analyzed based on the above mentioned time scales (5, 8, 9, 18).
2. Material and Methods
2.1. Study area
condition of the arid and semi arid region in the Qom province.
2.2. Rangeland forage production
In 8 sites of the rangeland, relative factors such as plant cover , density, yield, regeneration ,land cover were measured in 60 plots with 2 m2 area along the 4 transect having 400 m long. The location of transects were permanent over sampling period. Rangeland yield was measured with the cutting and weighting method in a quarter of plots, and the total yield in each site was obtained from the regression models between plant cover and species yield (17). Data series were recorded for 9 years. But there were data gaps in some years and the rangeland yield was not measured so the calculation was carried based on the available data. The rangeland yield was determined based on the vegetative forms (forb, grass and shrub) (9).
2.3. Palmer Drought Severity Index (PDSI)
Although PDSI is referred as an index of meteorological drought, however, Palmer procedure considers precipitation, evapotranspiration, and soil moisture conditions, which are determinants of hydrological drought, i.e. the period during which the actual water supply is less than the minimum water supply necessary for normal operations in a particular region. The PDSI measures the departure of the moisture supply from normal conditions. Moisture supply is calculated from the water balance of a two-layer soil model using monthly mean precipitation and temperature data as well as the local available soil water content. From the input data, all the basic water balance terms, namely evapotranspiration, soil recharge, runoff, and moisture loss from the surface layer are estimated (Loukas et al., 2002). Complete
description of the equations of the PDSI calculation procedures can be found in the original paper (Palmer, 1965) or in a recent paper (Dalezios et al., 2000).
2.3.1. Calculation of the PDSI
The basis of the soil modeling is the calculation of the potential evapotranspiration (PET). PET is calculated using Thornthwaite's method. Besides PET, there is also potential recharge (PR), potential runoff (PRO), and potential loss (PL).Another definition is needed. The Available Water Holding Capacity (AWC) is the amount of water the soil is capable of
holding. The underlying soil moisture content is the amount of moisture that is being held beneath the topsoil. The top soil moisture content is the amount of moisture in the topsoil. Now, PR is the amount of water that could be absorbed by the soil, or the difference between the AWC and current soil moisture, so
PR = AWC - (Su + Ss) PRO is calculated assuming any precipitation
that falls is absorbed until the ground is saturated, and then the rest runs off. Thus, PRO is the difference between the potential precipitation and the amount of moisture the soil can absorb. Palmer decided to set the potential precipitation to AWC, and the amount of moisture the soil can absorb is simply PR, so
PRO=AWC-PR=AWC-(AWC-(Su+Ss))=Su+Ss
2.3.2. Moisture Departure
The Moisture Departure is basically the deficit or surplus of moisture for a given month. It is calculated using the following formula:
P P D
Here, P is the precipitation and is the CAFEC
(Climatically Appropriate for Existing Conditions) precipitation. is calculated as follows:
P=αi.ET+ ßiPR+ γiPRO- δiPL
The subscript i refer to the month of the year.
The coefficients are the average ratio of each of the actual values (ET, R, RO, and L) to the corresponding potential value (PET, PR, PRO, and PL). These ratios are called the water balance coefficients. They have the effect of adjusting the potential values to account for changes in the season. They are calculated as follows.
allyears allyears
PETi ETi i
allyears allyears
PRi Ri i
allyears allyears
PROi ROi i
allyears allyears
PLi Li i
2.3.3. Moisture Anomaly
The moisture departure, d, is the deficit or
moisture departure is adjusted again to create the Moisture Anomaly, Z, which represents how
wet or dry it is with respect to the current season and the local climate. This is done by simply multiplying the moisture departure by the Climatic Characteristic, K.
Z=d.K
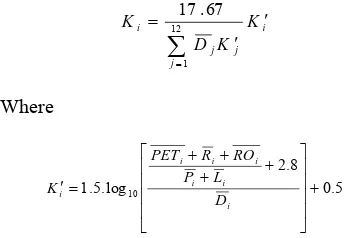
The value of K changes depending on
location and time of year, as is evident in the following formulas used to calculate it.
i j j j i K K D K
12 1 67 . 17 Where 5 . 0 8 . 2 log . 5 .1 10
i i i i i i i D L P RO R PET K
The formula for K is pretty complicated, and
it is hard to explain how it is related to the averages of PET, R, RO, P, and L. However, there are a few things to note about these equations. Once again, the subscripts i refer to
the months of the year. The value of 17.67 is an empirical value that Palmer derived from a limited set of data. There is one new abbreviation in both formulas, which is and is defined by the following formula.
record in
years of
d
D all years
i
i #
One should also note that the calculations of both d and Z depend on the 8 potential and
actual values that are related to the soil moisture conditions (PET, PR, PRO, PL, ET, R, RO, and L) from the entire length of record. That means that these eight values have to be calculated for each month of each year before the moisture departure and moisture anomaly are calculated. With the moisture anomaly calculated, the PDSI itself can now be calculated. There are actually three intermediate indices, X1 is
severity of a wet spell that may or may not be developing, X2 is the severity of a dry spell that
may or may not be developing, and X3 is the
severity of the current, "established" spell. The actual PDSI value is actually determined by picking one of the three indices according to a set of rules. Each of the three indices is
calculated in the same way. For example, X3 is
calculated as follows:
i i
i X Z
X 3 1 3 897 . 0 3 1 2.4. Data
Daily air temperature and precipitation data were derived from the Meteorological Organization of Iran. Only the stations with more than 15 years data were used.
Four stations (Doushan Tapeh, Qom, Kashan and Shams Abad) are selected according to the elevation and proximity to the rangeland sites. Accuracy and homogeneity of the data are tested. Missing data are regenerated. Monthly PDSI is calculated for 20 years period (1986-2006). The AWC for each rangeland site was calculated using an area –weighted method from land use and capability maps of Qom that were developed by Water and Soil Institute of Agriculture Ministry. The plant yield data of rangeland sites were available for 9 years (1998-2004) that were developed by Research Institute of Forest and Rangeland of Iran.
2.5. Evaluation of the PDSI
The evaluation of the Palmer drought severity index was carried out in two stages. During the first stage, a growing season drought index variable was created for PDSI by summing the monthly values for growth season in 6 time steps (February to July, March to July, March to June, and March to April and March). Another PDSI were tested in annual scale. For evaluation of the PDSI in rangeland, the determination coefficient and standard errors were used obtained from ANOVA results. The power and logarithmic regression models could not be used because the PDSI had negative values, and quadrate and cubic models were not suitable due to insufficient data. So, the linear regression model is used to evaluate the PDSI.
3. Results
abad. As show in Table 1 plant species are classified in 3 forms (shrubs, forbs and grasses). AWC in these sites varies from 0.9 inch in the Baghyek to 9 in the Cheshmeshor. The soil depths in these sites are from 10 cm to 90 cm. The model performance statistics for 8 sites are provided in the Table2.
The results of regression analysis between rangeland yield for different plants and PDSI are presented in Table 2. As shown in Table 2 the largest correlation between yield and PDSI in Baghyek site is 0.37 (in March) that significant at 85% level but other regression is not significant. Doushan Tapeh 0.0 100.0 200.0 300.0 400.0 1976-1 977 1979-1 980 1982-1 983 1985-1 986 1988-1 989 1991-1 992 1994-1 995 1997-1 998 2000-2 001 2003-2 004 year P re c ipi ta ti on( m m ) Kashan 0.0 50.0 100.0 150.0 200.0 250.0 300.0 19 76-1977 19 79-1980 19 82-1983 19 85-1986 19 88-1989 19 91-1992 19 94-1995 19 97-1998 20 00-2001 20 03-2004 year P re c ip it a tio n ( m m ) Qom 0.0 50.0 100.0 150.0 200.0 250.0 300.0 1987-1988 1989-1990 1991-1992 1993-1994 1995-1996 1997-1998 1999-2000 2001-2002 2003-2004 2005-2006 year P re c ip ita tio n (m m ) Shams Abad 0.0 100.0 200.0 300.0 400.0 500.0 600.0 700.0 1976-1977 1979-1980 1982-1983 1985-1986 1988-1989 1991-1992 1994-1995 1997-1998 2000-2001 2003-2004 year P re c ipi ta ti on ( m m )
Table 1: Characteristics of rangeland sites in Qom Rangeland Site Rangeland type Soil depth (cm) Soil texture AWC (inch) Period of yield
measurement
Baghyek
Stipa barbata-Artemisia sieberi 10 Relatively coarse 0.9 1998-2004 Cheshmeshor Artemisia sieberi 90
Fine- very fine 9
1998-2006
Ghale mohammad
Salsola rigida Artemisia sieberi 40
Relatively fine
3.3 1999-2006
Hosein abad
Asrragalus sp-Stipa barbata- Artemisia sieberi 60 Relatively fine 4.9 1998-2006 Varjan
Noea mucronata-buffonia macrocarpa 40
Relatively fine
3.3 1998-2006
Jadeh kashan
Salsola sp- Artemisia sieberi 50
Relatively fine
4.1 1998-2006
Vasf
Artemisia aucheri- Astragalus sp 30
Medium to fine 2.4
2001-2006
Karmjan
Artemisia aucheri- Astragalus sp 30
Medium to fine 2.4 2001-2006 0.0 50.0 100.0 150.0 200.0 250.0 300.0 1997-199 8 1998-199 9 1999-200 0 2000-200 1 2001-200 2 2002-200 3 2003-200 4 2004-200 5 2005-200 6 year R a n g el an d yi e ld ( K g /h a
) Baghy ek
cheshmeshor ghale mohammad hoseinabad jade kashan kamjan v arjan v asf
Fig. 2. The variation of the total yield of the rangeland sites in Qom province
4. Discussion and Conclusion
In arid and semi arid Rangeland of Iran drought is a recurring damage that affected of forage production. Many of the drought indices have developed to assessment of the drought severity. One of the most important drought indices is the PDSI. In this study the drought effects on rangeland forage have been research and the results showed that:
1- The results showed that in Baghyek site there is no significant correlation between yield and PDSI and it may be related to the shallow soil depth in this site. This result confirms the research of Bas van Wesemael (2003) in Spain that showed the relation between drought and soil properties, and said if soil has had sufficient depth that provide the soil storage to plants needs definition of precipitation has less effects on the plant cover.
2- Only in two stations annual PDSI and yield is significant at 80% level and in other sites there was no relation with annual PDSI.
3- In case of classified vegetative types, it would provide more accurate results. Moreover, the most appropriate time step for evaluation of drought based on PDSI is different for various sites.
4- Also the study showed that the highest frequency of significant models is related to March-July period.
5- The rangeland yield is not related to the annual precipitation, but the best relationship was between precipitation in growing season and rangeland yield. Growing season assumed from March to July.
6- Linear regression model provided better results than others. The result shows the PDSI is an appropriate drought index that could be used for drought monitoring in the rangeland of Qom province. These results are similar with the researches of Quiring et al. (2003) in Canadian prairies.
References
Alatise Michael O., Oladunni Bimpe Ikumawoyi, 2007. Evaluation of drought from rainfall data for Lokoja, a confluence of two major rivers, Vol. 1, Electronic journal of polish agricultural universities.
Anup, K.Prasad, Sudipta Sarkar, RAmesh P. Singh, Menas Kafatos, 2007. Inter-annual variability of vegetation cover and rainfall over India, Advances in space research, 39:79-87.
Dolling Klaus P., Pao-Shin Chu, Francis Fujioka, 2002, The validity of 4-Keetch/Bayram drought index in the Hawaiian islands
Fazeli, F. M.Ghorbanli and V.Niknam, 2007. Effect of drought on biomass, protein content , lipid per oxidation and antioxidant enzymes in two sesame cultivars, Vol. 1, Biologia plantrum 51: 98-103. Hodgkinson, K. C. and W. J. Muller, 2005. Death model for tussock perennial grasses: a rainfall threshold for survival and evidence for landscape control of death in drought, The rangeland journal, 27:105-115. Keyantash John & John A.Dracup, 2002. The Quantification of drought : An evaluation of drought indices, American meteorological society
Kumar,Vijendra, 1998. An early system for agricultural drought in an arid region using limited data, Journal of arid environments. 40: 199-209.
Leilah, A.A., S.A Al-Khateeb, 2005. Statistical analysis of wheat yield under drought condition. Journal of Arid environments, 61:483-496.
Mamolos, A.P., D.S.Veresoglou, V. Noitsakis, A. Gerakis, 2001. Differential drought tolerance of five coexisting plant species in Mediterranean grasslands, Journal of arid environments, 49:329-341.
Mckee, Thomas B., Nolan J. Doesken and John Kleist, 1993. The relationship of drought frequency and duration to time scales , Eighth conference on applied climatology, 17-22- January 1993, Anaheim California
Morid Saeid, Vladimir Smakhtin and Mahnosh
moghaddasi, 2006. Comparison of seven
meteorological indices for drought monitoring in
Iran, International journal of climatology, 26:971- 985.
Narasimhan B., R. Srinivasan, 2004, Development of a soil moisture index for agricultural drought monitoring using hydrologic model (SWAT), GIS and remote sensing
National drought mitigation center, 2006. What is drought? Understanding and defining drought
Palmer Wayne C.,1965, Meteorological drought; Washinghton, D.c; p.59
Pisani, L.G., H.J.Fouche, J.C.Venter, 1998. Assessing rangeland drought in South Africa, Vol.3, Agricultural systems, 57: 367-380.
Quiring Steven M., Timonthy N,Papakryakou, 2003, An evaluation of agricultural drought indices for the
Canadian prairies; Agricultural and forest
meteorology; 118,49-62
Stampfli, A. and M.Zeiter, 2004. Plant regeneration directs changes in grassland composition after extreme drought: a13- year study in southern Switzerland, Journal of Ecology, 92:568-576. Tielborger Katja, and Ronen Kadmon; 2000, Temporal environmental variation tips the balance between facilition and interference in desert plants; Ecology, 81, 6, 1544-1553.
Wayne Cook,C. and Phillip L. Sims, FAO Corporate document repository, 2001. Drought and its relationship to dynamics of primary productivity and production of grazing animals.
Wesemael Bas van , Erik Cammeraat, Mark Mulligan, Sophia Burke, 2003.The impact of soil properties and topography on drought vulnerability of rainfed cropping systems in southern Spain; Agriculture ecosystems & environment, 94: 1-15.
Yaakov Aviad, Haim Kutiel, Hanoch Lavee, 2004. Analysis of beginning, end, and length of the rainy season along a Mediterranean –arid climate transect for geomorphic purposes, Journal of arid environments, 59: 189-204.
Yurekli, K. And A. Kurunc, 2006. Simulating agricultural drought period based on daily rainfall and
crop water consumption, Journal of arid