University of New Orleans University of New Orleans
ScholarWorks@UNO
ScholarWorks@UNO
University of New Orleans Theses and
Dissertations Dissertations and Theses
8-5-2010
Dynamic Behavioral Analysis of Malicious Software with Norman
Dynamic Behavioral Analysis of Malicious Software with Norman
Sandbox
Sandbox
Danielle Shoemake University of New Orleans
Follow this and additional works at: https://scholarworks.uno.edu/td
Recommended Citation Recommended Citation
Shoemake, Danielle, "Dynamic Behavioral Analysis of Malicious Software with Norman Sandbox" (2010). University of New Orleans Theses and Dissertations. 1233.
https://scholarworks.uno.edu/td/1233
This Thesis is protected by copyright and/or related rights. It has been brought to you by ScholarWorks@UNO with permission from the rights-holder(s). You are free to use this Thesis in any way that is permitted by the copyright and related rights legislation that applies to your use. For other uses you need to obtain permission from the rights-holder(s) directly, unless additional rights are indicated by a Creative Commons license in the record and/or on the work itself.
Dynamic Behavioral Analysis of Malicious Software
with Norman Sandbox
A Thesis
Submitted to the Graduate Faculty of the
University of New Orleans
in partial fulfillment of the
requirements for the degree of
Master of Science
in
Computer Science
by
Danielle Shoemake
B.S., University of New Orleans, 2003
ii
iii
Acknowledgements
I owe the deepest gratitude to my thesis adviser, Dr. Daniel Bilar, for his encouragement, guidance, and support. His enthusiasm in the research area of malicious software was
motivational and made this thesis a pleasure. I am also grateful for the time and input contributed by my other committee members, Dr. Shengru Tu and Dr. Golden Richard III.
I want to give a special thanks to Dr. Jaime Nino for giving me such an amazing and solid programming foundation and to Dr. Shengru Tu, Dr. Nauman Chaudhry, and Dr. Vassil Roussev for their teachings in databases, distributed systems, and concurrent programming, as these are the areas I plan to pursue.
I want to express my sincere appreciation to staff members Fareed Qaddoura and Jeanne Boudreax. Fareed was readily available to me for lab and network support while Ms. Jean stayed on top of my paperwork to ensure that I would not fall through the cracks.
I am indebted to Mr. Matt Allen of the Norman Sandbox & Technology team. Without the use of the Norman Sandbox Analyzer, this thesis would not have been possible. I would also like to thank the team members at VX Heavens. Without their large malicious software
contribution, I would most likely still be searching for samples!
Finally, I thank my mother and step-father, friends, and coworkers for their support and assistance throughout the duration of my thesis and coursework.
iv
Table of Contents
LIST OF FIGURES ... VI
LIST OF TABLES ... VII
ABSTRACT ...VIII
CHAPTER 1 – INTRODUCTION ... 1
Time Frame of a Virus Definition Update ... 2
Signature-Based Matching Method ... 3
Behavioral Heuristics Mechanisms ... 4
CHAPTER 2 – RELATED WORK... 7
CHAPTER 3 – DESIGN AND IMPLEMENTATION ... 9
Overview of Approach ... 9
Setup ... ... 10
Samples ... 10
Generating System Interaction Logs ... 11
Creating the Behavior Database ... 13
Parsing Interaction Logs into the Database ... 16
CHAPTER 4 – BEHAVIOR EXTRACTION ... 19
Single Behavior Analysis ... 19
Pattern Behavior Analysis ... 20
CHAPTER 5 – STATISTICAL ANALYSIS... 24
v
Bayesian Inference ... 28
Discussion ... 31
CHAPTER 6 - FUTURE MALWARE ... 33
APPENDIX A: DEFINITIONS ... 34
APPENDIX B: SAMPLE LOG PRODUCED BY NORMAN SANDBOX ANALYZER ... 39
APPENDIX C: EXAMPLE AND EXPLANATION OF AN ORACLE EXPLAIN PLAN ... 41
APPENDIX D: PARSER CODE ... 43
APPENDIX E: COMBINATION GENERATOR ... 50
APPENDIX F: BEHAVIOR COUNTING SCRIPTS ... 52
BIBLIOGRAPHY ... 54
VITA... 56
vi
List of Figures
1 Goods and services available for sale on underground economy servers ... 1
2 New malicious code threats for 2008 ... 2
3 Graphical representation of multiple execution paths ... 8
4 Screenshot of the Norman Sandbox Analyzer ... 13
vii
List of Tables
1 Number of Malicious Software samples in their respective classes ... 11
2 Log extraction example... 17
3 Top 15 behaviors and probabilities that given class CApp, single behavior B is observed ... 24
4 Comparison of the top 4% behaviors of CApp with the other 5 classes ... 25
5 Comparison of the top 2% behaviors of CWorm with the other 5 classes ... 25
6 Comparison of the top 7% behaviors of CTrojan with the other 5 classes ... 26
7 Comparison of the top 10% behaviors of CVirus with the other 5 classes... 26
8 Comparison of the top 9% behavior of CDOS with the other 5 classes ... 27
9 Comparison of the top 9% behavior of CAPT with the other 5 classes ... 27
10 Behavior used for testing class membership ... 28
11 Given a class of programs, the probabilities we saw a behavior ... 29
12 Class probabilities in our 2000 samples... 29
13 For behavior B3, probability of class membership given execution of an unknown program ... 30
viii
Abstract
Current signature‐based Anti‐Virus (AV) detection approaches take, on average, two weeks from discovery to definition update release to AV users. In addition, these signatures get stale quickly: AV products miss between 25%‐80% of new malicious software within a week of not updating. This thesis researches and develops a detection/classification mechanism for malicious software through statistical analysis of dynamic malware behavior.
Several characteristics for each behavior type were stored and analyzed such as function DLL names, function parameters, exception thread ids, exception opcodes, pages accessed during faults, port numbers, connection types, and IP addresses. Behavioral data was collected via Norman Sandbox for storage and analysis.
We proposed to find which statistical measures and metrics can be collected for use in the detection and classification of malware. We conclude that our logging and cataloging procedure is a potentially viable method in creating behavior‐based malicious software detection and classification mechanisms.
1
CHAPTER 1 – INTRODUCTION
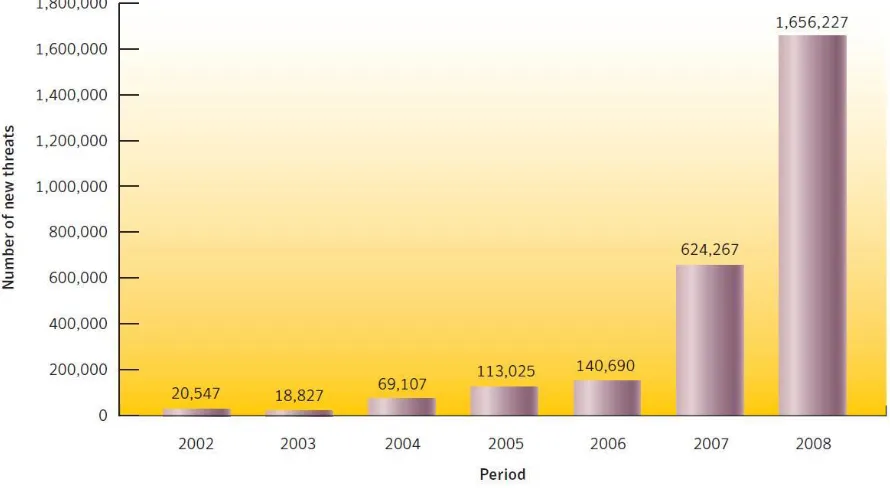
The current trend for the purpose of writing malicious code is that the resulting attacks involve extracting confidential financial information from their victims. The information is used for monetary gain by the attacker; thus affecting victims financially, rather than solely disrupting the function of their computer systems, as was the aim of the past. The figure below shows the prices at which confidential information can be sold. Profitability is the driving force inviting newcomers to associate themselves with the creation and distribution of malicious software. [1]
Figure 1 - Goods and services available for sale on underground economy servers
Data collected by Symantec shows that in 2008, 78 percent of confidential information threats exported user data and 76 percent of confidential information threats used a keystroke-logging component to steal information such as online banking account credentials. The financial services sector had the most identities exposed due to data breaches. The average cost of a data breach, in 2008, was $6.7 million. Total number of malicious threats detected by Symantec in 2008, was 1,656,227. As shown in the chart in figure 2, the number of new threats has
drastically increased and at an alarming rate. The number of threats discovered in 2008 account for 60 percent of total threats since 2002. [1]
2 Figure 2 - New malicious code threats for 2008
Time Frame of a Virus Definition Update
Typical scenario with current signature matching technique:
A bank employee receives a Trojan containing a key-logger via an email-worm that appears to the employee to be an application accompanying a joke that was also part of the email. It seems safe because it was sent from a friend. The employee has all of the other employees of her bank branch in her contacts list, several from other branches, and several friends that work for other
companies. The malware immediately replicates itself and is sent to everyone in the employee‘s
contacts list. Once downloaded by each new victim, the email-worm does the same process with contact lists on their machines. Within a few days, the malware has spread itself to thousands of computers.
At least one employee notices that the application is suspicious and forwards it to the security and IT departments of the bank. By the time the IT department analyzes the application, customers have begun to call in to customer service about missing funds from their accounts.
The bank‘s IT department begins their standard process for removing malicious software from
3
Eventually, AVs are wise to the new threat. Within a few days, the anti-virus developers have updated their virus definitions to include signatures for the new malware. They push out the update to their users. Not all computer users receive automatic updates or use anti-virus software; so unfortunately, the email-worm is not yet completely put to rest.
On average, two weeks will elapse during this cycle before AVs have pushed out releases for new virus definition updates. [2] Consider the number of bank transactions that occur in two weeks time by one bank teller, let alone the rest of the branch and the other banks and companies that could be infected as in the given scenario. This is two weeks merely to begin the process of slowing down the financial-trauma laden attacks and is not nearly enough to minimize damages at a satisfactory level.
This snail‘s pace practice is motivated by what is known as the signature matching method.
Signature-Based Matching Method
Signature matching is used to identify malicious software by most AV products.
―Writing virus signatures—the classic mechanism for detecting and stopping threats—is analogous to using fingerprint matching to catch criminals. If you‘re looking for a known criminal who has a fingerprint on file, it‘s a perfect system. If
you don‘t have their fingerprint yet, this traditional ‗blacklisting‘ mechanism isn‘t
effective.‖ [3]
A signature is a pattern that identifies malicious software and can be created from a piece of code or a hash. The fragment is used as an identifier for the entire malicious program. Once stored in memory, the fragment will look something like this example:
C3 7C FD 1D 31 C0 6F OF 96 18 A4
The rationale underlying these character patterns is that they are more likely to be encountered when analyzing malicious software rather than innocent programs. Hundreds of thousands of these signatures are stored in local AV databases. An AV scanning engine then tries to match pre-defined file areas against this signature database. These areas are typically located at the beginning and the end of the file and after the executable entry point of a program.
Malicious code can be tweaked to make the byte pattern mismatch. Generic matching was
4
slightly altered so as to evade the stricter matching. Using the example above, the second, third,
fourth and ninth bytes are replaced with a wildcard denoted by ‗??‘:
C3 ?? ?? ?? 31 C0 6F OF ?? 18 A4
For example, the strings below would both match the above:
C3 99 A0 BB 31 C0 6F OF 77 18 A4
C3 A1 22 00 31 C0 6F OF FF 18 A4
The problem with casting a wider net to catch ‗bad‘ programs is that ‗innocent‘ (non-malicious)
programs may be identified incorrectly; in other words, there is an increase in the false positive rate. [4]
Behavioral Heuristics Mechanisms
Behavioral heuristics is the notion of how a given software program interacts with its embedded
environment. For instance, a program may interact with a file system (by opening, creating or deleting a file) or the network (opening a connection to a server or setting up a receiving server).
These and other interactions of the program can be monitored in what is called a ‗sandbox‘. A
sandbox is a controlled, instrumented container in which the program is run and that records how it interacts with its environment. [4] A sample sandbox output is set out below:
Some general information about the file is shown and that a message box with the caption
‗sample‘ and message ‗tikkun olam!‘ is displayed on the screen.
[ General information ]
* Display message box (sample) : sample, tikkun olam! * File length: 18523 bytes.
* MD5 hash: 1188f67d48c9f11afb8572977ef74c5e.
Here shows that the action of the program is to delete a file and recreate one with the same name, kern32.exe.
[ Changes to filesystem ]
* Deletes file C:WINDOWS\SYSTEM32\kern32.exe. * Creates file C:WINDOWS\SYSTEM32\kern32.exe.
5 [ Changes to registry ]
* Creates key
"HKLM\Software\Microsoft\Windows\CurrentVersion\RunOnce".
* Sets value "kernel32"="C:WINDOWS\SYSTEM32\kern32.exe -sys" in key " HKLM\Software\ Microsoft\Windows \CurrentVersion\RunOnce".
The system is instructed to intercept the strokes used on the keyboard and pass it on to a custom function.
[ Changes to system settings ]
* Creates WindowsHook monitoring keyboard activity.
The program connects to a server at address 110.156.7.211 on port 6667, a typical port for Internet Relay Chat (IRC) chat server, logs in and joins a chat channel.
[ Network services ]
* Connects to "110.156.7.211" on port 6667 (TCP). * Connects to IRC server.
* IRC: Uses nickname CurrentUser[HBN][05]. * IRC: Uses username BoLOGNA.
* IRC: Joins channel #BaSe_re0T.
In the example above, interactions occur with the file system, the Windows registry (the internal Windows database) and the establishment of a TCP network connection to an IRC chat server. Connecting to a chat server is anomalous enough behavior that it should raise a concern that something is not correct. Taken together, this set of activities is consistent with the suspicious program being a bot, connecting to a botnet through the IRC server. [4]
AV signature databases quickly go out-of-date. After failing to update signatures for one week, the best AV tested missed between 26 and 31 per cent of the new malicious software, the worst
missed upwards of 80 percent. [2]
It is possible to derive a ‗behavioral signature‘ as opposed to the byte-value approach discussed
earlier. Some AVs are already employing this technique by attempting to stop a running program that has tried to execute some particular behavior, with ―running‖ being the operative
term as to why this technique has not made significant miracles. The AV would not be aware of the suspicious dynamic behavior until the moment of occurrence. While some AVs attempt to
‗undo‘, the program may have gotten far enough along in its processes to do irreparable damage.
AVs will look for obviously suspicious behaviors such as a registry change or file replacement.
These ―obviously suspicious‖ behaviors are most likely, at least in part, the malevolence of the
6
recognizable as suspicious nor are they obviously harmful. Sometimes they are part of Windows libraries and are even more hidden by the fact that they also occur as menial tasks in
non-malicious software.
From the logging and cataloging approach we will take in this thesis, we propose that we will find various avenues for which statistical measures and metrics can be collected for use in the detection and classification of malware. We anticipate finding not only those behaviors that are obviously suspicious, but also those prevalent in certain classes that are not typically considered suspicious. We may also find interesting and usable trends based on the details of a behavior such as the library it belongs to or the parameters associated with it. From this preliminary assessment, if positive results are discovered, we hope to be able to conclude that new behavior-based mechanisms, possibly involving the integration of a sandbox to work in conjunction with AVs, can be used to stop the execution of malicious software before it begins any of its processes and to aid in the classification of malware.
7
CHAPTER 2 – RELATED WORK
Dynamic malware investigations were undertaken by Rozinov (2005), Ries (2005), and Bilar
(2007): Bayer and Ries‘ behavioral analysis ran the malware dynamically in a sandbox, recorded
security-relevant Win32 API calls, and constructed a syscall-based behavioral fingerprint for malware identification and classification purposes. Rozinov, on the other hand, located calls to the Win32 API in the binary itself. While Ries and Bayer recorded the system calls of the malware dynamically during execution, Rozinov statically disassembled and simplified the malware binary via slicing, scanned for Win32 API calls and constructed an elaborate Finite State Automaton signature for later detection purposes. [10, 11, 12]
Graph-based structural approaches gained some traction when in 2005, Dullien proposed a simple but effective signature set to characterize statically disassembled binaries: every function in the binary was characterized by a three-tuple (number of basic blocks in the function, number of branches and number of calls). These sets were used to compare malware variants and localize changes. Bilar examined the static callgraphs of 120 malicious and 280 non-malicious executables. He fitted Pareto models to the in-degree, out-degree, and basic block count
distributions, and found a statistically significant difference for the derived power law exponent of the basic block count fit. He concluded that malware tended to have a lower basic block count than non-malicious software, implying a simpler structure: Less interaction, fewer branches and more limited functionality. [13, 14]
More recently (2008), Holz presented a system that classifies unknown malware samples based on their behavior. A particular limitation is that the system requires supervised learning, using a virus scanner for labeling the training set. [15] Lee developed a system for classifying malicious software samples that relies on system calls for comparing executables. The scalability of the technique is limited as the system required several hours to cluster a set of several hundred samples. Also, the tight focus on system calls implies that the collected profiles do not abstract the observed behavior. [16]
Leita suggest classifying malware based on the epsilon-gamma-pi-mu model. In this model, additional information on how the malware is originally installed on the target system is considered for classification. This can include information on the exploit and exploit payload used to install the malware dropper and on the way the dropper in turn downloads and installs the malware. [17]
8
expressed is that a sandbox will typically only utilize one execution path. That is, if a set of instructions (or code) includes conditional sections based on mutable program variables, in most cases there are situations in which multiple paths could be taken. The following is a graphical representation:
Figure 3 – Graphical representation of multiple execution paths
9
CHAPTER 3 – DESIGN AND IMPLEMENTATION
Overview of Approach
System interaction logs were collected from malware using a Norman sandbox. Data from the logs was parsed into a database in a manner such that all information is query-able and
essentially, a log could be rebuilt from its parts. From this data, counts of occurrence of
behaviors were taken per classification and per software (See the example below). From a list of behaviors found, all possible behavior sequences (with length 3) were generated, stored, and occurrences also counted per classification and per software.* Statistical analysis was performed from the data counts and also on several other factors such as how often exceptions and page faults occur within malware versus non-malicious software.
For the purposes of this paper, a ―behavior‖ is a single entity that describes an action that may
occur on a system. Behaviors can represent function calls, exceptions, page faults, port connections, socket bindings, send to port calls, and open network calls.
Example of a function call behavior:
KERNEL32.CreateProcessA()
A system interaction is the actual event of a behavior interacting with a system; some catalyst has caused a particular behavior to be executed on a system. The parts that comprise an interaction make it unique: software that called or caused the behavior, the order of its occurrence, and its parameters if there are any.
Example of a system interaction:
Agent.bz:KERNEL32.CreateProcessA
("C:\WINDOWS\MsgNet32.exe",NULL,0x00000000,0x00000000,0x00000000 ,0x00000000,0x00000000,NULL,0x00000000,0x00000000)
*Per the combination formula: n! / r! (n - r)!, there are a total of 1,435,853,825 possible behavior
10
Setup
Initial processing (parsing interaction logs into the database) was done with a Dell Studio laptop running Microsoft Windows Vista Home Premium Edition with Service Pack 2. The laptop has
an Intel® Core™2 Duo CPU P8600 @ 2.40GHz. VMware Player Version 2.5.3 build-185404
running Windows XP SP3 was used in conjunction with this machine for the handling of malware so that the machine would not be infected.
Secondary processing (analysis of stored database data) was done with a Dell Precision
WorkStation T3400 running Microsoft Windows 7 Enterprise Edition. It has an Intel® Core™2
Quad CPU Q9550 @ 2.83GHz.
Samples
Malicious software samples were found in binary form in an online database titled VX Heavens at http://vs.netlux.org. Initially, 67,000+ files were obtained with filename format:
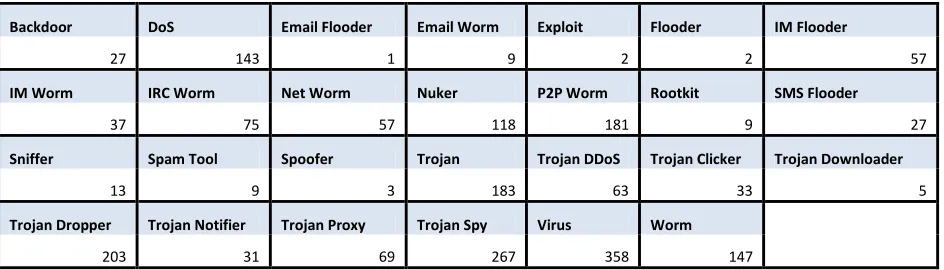
OS.Classification.MalwareName.version; example: Win32.Worm.Agent.az. Files were first filtered by operating system to only include those for Windows 32. The remaining 11,581 binaries were sorted into directories by the following twenty-seven malware classifications: Backdoor, DoS, Email-Flooder, Email-Worm, Exploit, Flooder, IM-Flooder, IM-Worm, IRC-Worm, Net-IRC-Worm, Nuker, P2P-IRC-Worm, Rootkit, SMS-Flooder, Sniffer, Spam-Tool, Spoofer, Trojan, Trojan-DDoS, Trojan-Clicker, Trojan-Downloader, Trojan-Dropper, Trojan-Notifier, Trojan-Proxy, Trojan-Spy, Virus, and Worm. Definitions for each class can be found in the Appendix.
11
Backdoor DoS Email Flooder Email Worm Exploit Flooder IM Flooder
27 143 1 9 2 2 57
IM Worm IRC Worm Net Worm Nuker P2P Worm Rootkit SMS Flooder
37 75 57 118 181 9 27
Sniffer Spam Tool Spoofer Trojan Trojan DDoS Trojan Clicker Trojan Downloader
13 9 3 183 63 33 5
Trojan Dropper Trojan Notifier Trojan Proxy Trojan Spy Virus Worm 203 31 69 267 358 147
Table 1: Number of Malicious Software samples in their respective classes.
Non-malicious software was obtained by scanning several Windows 32 systems for executable files. A total of 1557 samples were found, logged, and catalogued into the database but only 340 were utilized after using the same filtering techniques that were done for malware.
Generating System Interaction Logs
In order to catalogue the behaviors of software, a method had to be selected that would log each and every interaction between each of the executables and the system. This method would have to prevent the system from being infected by malware and could hopefully be incorporated into the future use of this research. There were two options considered: the first was to execute the software in a virtual machine with an API call logger running within the virtual machine, while the second was to execute the software within a Norman sandbox. Using a Windows virtual machine allows a greater degree of control of the environment since it is more like a true to life system versus the simulated Windows environment of a sandbox. It was decided however, that less control and constant variables were more desirable.
The dependent variables, the interactions reported in an API log, should only be affected by the independent variables, in this case, the executed software. While a VM offers more control of
the environment, allowing the manipulation of settings (i.e. installing or running other software) per software creates a less controlled environment, as in a controlled constant for testing. If one could guarantee that all altered settings remained exactly the same for all software that is
executed, this might be acceptable. However, there is software that will not run to completion when it discovers that some other particular software is present, and will then usually wait for a
user response as in this example, ―Setup cannot continue because this version is incompatible
with a previously installed one.‖ The API log to represent this situation would report this
12
trials of the investigation are equally impacted by the controlled variables, therefore allowing one to see the impacts of the independent variable on the dependent variable.
The Windows API calls that are used to prepare for and to seek out those external files will be logged and that will be sufficient. With the notion of using constant variables when logging behavior, the behavior that occurs while executing in the sandbox can be representative of any Windows 32 system regardless of the programs that are installed (as long as its Windows 32 files exist as they were originally installed).
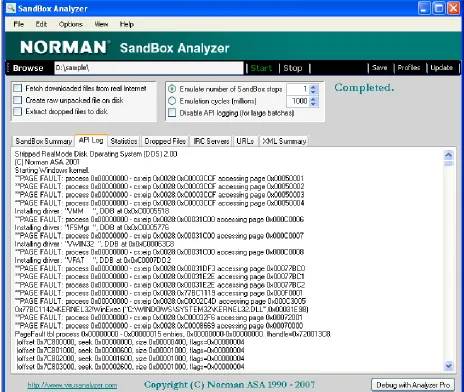
Therefore, the Norman sandbox was chosen to generate the system interaction logs; it simulates a clean install of Windows and operates exactly the same for all software, regardless of the type of system the sandbox is running on. The Norman sandbox comes with API logging features and saves the step of having to design our own. It shows each interaction in the order of occurrence, including its parameters when they exist. Another highly valued feature of the sandbox was that it allowed batch running of directories. This was considerably attractive feature on account of us wishing to log and store all 11,581 malicious and all 1557 non-malicious software samples, which resided in only 28 directories, one for each class.
Using the Norman Sandbox Analyzer consisted of the following steps: 1. Select Browse button and choose a directory for batch processing. 2. Select the Start button.
3. Once notified of completion, find the temp directory where logs are stored.
13 Figure 4 – Screenshot of the Norman Sandbox Analyzer
For an example of an API log generated by the Norman Sandbox Analyzer, please refer to the appendix.
Creating the Behavior Database
Oracle Database 11g Enterprise Edition Release 11.2.0.1.0 was chosen for its parallel threading feature. In-memory parallel execution harnesses the aggregated memory in a system to enhance query performance by minimizing or even completely eliminating the physical I/O needed for a parallel operation. Oracle automatically decides if an object being accessed using parallel
14
accessed. In an Oracle RAC environment, Oracle maps fragments of the object into each of the buffer caches on the active instances. By creating this mapping, Oracle knows which buffer cache to access to find a specific part or partition of an object to answer a given SQL query. In-memory parallel query harnesses the aggregated In-memory in a system for parallel operations, enabling it to scale out with the available memory for data caching as the number of nodes in a cluster increases. This new functionality optimizes large parallel operations by minimizing or even completely eliminating the physical I/O needed because the parallel operation can now be satisfied in memory. [6]
In creating the database schema, the goal was to have a database that would treat behaviors generically. It was hoped that all behavior types would be captured during sample processing, although initially, some types were unknown. More literally speaking, it was known that there would be function calls, while there was no certainty for the others. If there was a table per behavior type (an obvious 3NF schema); upon reaching a new type, processing would have to stop and the user would need to be notified that a database change was required before
processing could resume. Specifically, a new table would have to be created each time a new type was discovered. It was also necessary to maintain Third Normal Form (3NF) so that each piece of data was query-able and also extendible; extendible in this case meaning that the value could be used as a foreign key column if it was decided to include more information later. Another design factor: No certain number of parameters could be assumed for any type, as this too could cause an error during processing as well as it would result in a very large number of empty (null) fields. To avoid the problems explained above, the schema was designed as follows:
15
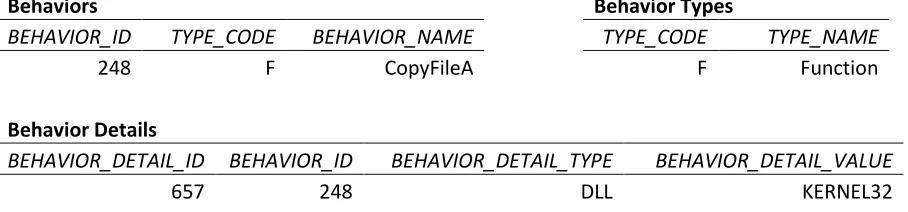
Each behavior was stored once in the Behaviors table which has a one-to-many relationship to the Behavior Details table. This arrangement was done in order to allow a behavior to have multiple details, while at the same time, avoiding numerous empty (null) fields. Behavior details are pieces of information that the sandbox provided with the behavior name to describe that behavior, such as a library name. The empty fields would have been an issue if the Behaviors table had been setup to include multiple columns for details, also for which, some random number of columns would to be selected that would hopefully be enough for all types of
behaviors. It was found that for the data collected, each behavior type required no more than one detail; but the described approach does avoid null space and keeps in line with the expandability objective. The Behavior Types descriptive table was also included to maximize saved storage space. For visual understanding, an example:
Behaviors Behavior Types
BEHAVIOR_ID TYPE_CODE BEHAVIOR_NAME TYPE_CODE TYPE_NAME
248 F CopyFileA F Function
Behavior Details
BEHAVIOR_DETAIL_ID BEHAVIOR_ID BEHAVIOR_DETAIL_TYPE BEHAVIOR_DETAIL_VALUE
657 248 DLL KERNEL32
The Interactions table is the pivotal part of the schema. Each record of this table directly correlates to a line of an interaction log. Software_id stores a foreign key that references the
software currently being processed. Behavior_id references the particular behavior executed and interation_order is the order in which it occurred as reported by the Norman sandbox.
The Interactions Details table was, much like the Behavior Details table, created to avoid having empty parameter columns that would have resulted from having to randomly guess a maximum number of parameters and making a column for each. There is no way of knowing how many columns to use as there is no set maximum for parameters. For each Interactions record containing one or more parameters, an Interactions Details record was created. The table is called Interaction Details versus Parameters because not all interactions include a behavior type that has associated parameters; some include other details such as exception fault codes. In the Interaction Details table, interaction_id is the reference to the Interaction for which it is
associated. Int_detail_type and int_detail_value are similar to the detail type and value columns
of the Behaviors table. For an Interaction record containing a function call, the associated
int_detail_typeis ―Parameter‖ and the int_detail_value is the value of the parameter.
16
Example:
Interactions
INTERACTION_ID SOFTWARE_ID BEHAVIOR_ID INTERACTION_ORDER
9383 102 248 8725
Interaction Details
INTERACTION_DETAIL_ID INTERACTION_ID INT_DETAIL_TYPE
28149 9383 Parameter
28150 9383 Parameter
28151 9383 Parameter
Interaction Details Continued
INT_DETAIL_VALUE INT_DETAIL_ORDER
"C:\sample.exe" 1 "C:\WINDOWS\MsgNet32.exe" 2
0xFFFFFFFF 3
Parsing Interaction Logs into the Database
The code for this process was written in Java using JDBC and can be found in the Appendix. The filename and lines of a log look similar to the following. There is one line to represent each behavior type found. Line numbers were added for readability and correlate to the line numbers of table _. This table shows how each piece will be parsed into the database by matching value to table and column name. Note that repeated column names on any table represent multiple records inserted into that table. Also empty cells represent the absence of a record and not null values.
Backdoor.Win32.Agobot.gz
1)**PAGE FAULT: process 0x00000000 - cs:eip 0x0008:0xD000CA98 accessing page 0x00070019
2)**EXCEPTION: ThreadID 0x15 opcode 0xAA45 SEH=0x7C825AA5 FaultCode=0xC0000005 EFlags=0x00000204
3)-connect port 01659, ["TCP"] IP "81.164.97.92" 4)-binds socket 00001 to port 00030891
5)Open network resource "Microsoft Windows-nettverk" ("Microsoft Windows-nettverk")
6)-sendto port 00137, IP "176.49.0.0" 7)0x7C80722C=KERNEL32!lstrcat
17
Line 1 2 3 4 5 6 7
SOFTWARE
SW_NAME Afcore.bz Agobot.gz Ppdoor.z Dumador.z Delf.ir Seteada Zero.a
CLASSIFICATIONS
CLASS_NAME Backdoor Backdoor Backdoor Backdoor IRC-Worm Trojan Virus
BEHAVIORS
BEHAVIOR_NAME PageFault Exception ConnectPort BindSocket OpenNetwork SendToPort lstrcat
BEHAVIOR_DETAILS
BEHAVIOR_DETAIL_TYPE DLL BEHAVIOR_DETAIL_VALUE KERNEL32
INTERACTIONS
SOFTWARE_ID 101 104 126 116 1818 954 10290 BEHAVIOR_ID 100 101 102 103 104 105 118 INTERACTION_ORDER 7 4044 1260 357 2279 1562 70
INTERACTION_DETAILS
INT_DETAIL_TYPE
AccessingPag
e ThreadID Port Socket Resource Port Parameter
INT_DETAIL_VALUE 0x00072031 0x15 01659 00001
MSHOME ("Microsoft
Windows-nettverk") 00137
"C:\WINDO WS\system 32\" INT_DETAIL_ORDER 1 1 1 1 1 1 1
INT_DETAIL_TYPE opcode
ConnectionT
ype Port IP Parameter
INT_DETAIL_VALUE 0xAA45 TCP 00030891 176.49.0.0
"oleaut32.d ll" INT_DETAIL_ORDER 2 2 2 2 2 INT_DETAIL_TYPE SEH IP
INT_DETAIL_VALUE 0x7C825AA5 81.164.97.92 INT_DETAIL_ORDER 3 3 INT_DETAIL_TYPE FaultCode
INT_DETAIL_VALUE 0xC0000005 INT_DETAIL_ORDER 4 INT_DETAIL_TYPE Eflags
INT_DETAIL_VALUE 0x00000204 INT_DETAIL_ORDER 5
Table 2: Log extraction to database example.
The following is a list of instructions that describe how the data was recorded.
1. Obtain software name (including version) and classification from filename.
18
3. Check the database to see if the software and version exist in the database for its class. a. It already exists, skip file completely.
b. It does not exist; insert a software record (sw_name, classification_id, operating_system).
For each line per log:
4. Check for line wrapping (explanation below)
a. Line appears to be a complete interaction, move to next step. b. Line is wrapped; loop until line appears to be complete.
5. Get behavior name.
a. It already exists, move to next step.
b. It does not exist; determine behavior type, insert a behavior record (type_code, behavior_name).
6. Check if there are associated behavior details.
a. Behavior details do not exist, move to next step.
b. Behavior details exist; insert a Behavior Details record (behavior_id, behavior_detail_type, behavior_detail_value).
7. Insert an interaction record (software_id, behavior_id, interaction_order).
8. Check if there are associated Interaction details.
a. Interactions details do not exist; get next line of file
b. Interaction details do exist; create an Interaction Details record for each (interaction_id, int_detail_type, int_detail_value, int_detail_order).
19
CHAPTER 4 – BEHAVIOR EXTRACTION
Single Behavior Analysis
Single behavior analysis is that which is performed on individual behaviors as they have occurred. As a basis for other analysis, counts of the number of times a behavior occurred per class were taken. Only one count was given per software. So if there were three Worms – A opens a file 23 times, B opens a file 12 times, and C opens a file 0 times; the count for opening a file is 2, 1 for A and 1 for B. Essentially, the count represents number of software for which a behavior exists. One may question why a simple count of occurrence per software was not taken so that the count would represent exact number of occurrences per entire class.
Amongst many of the software sampled, it could be seen from the sandbox generated logs that there were copious amounts of looping happening within the program. In some cases, there were tens of thousands of repeats per a set of processes. For some, it could be assumed that the
looping was because the program was waiting for a user action, for others it was clear it was looping until completion of a task for which it was unable to complete. It was never clear if a program stopped on its own or if the sandbox stopped running it. Number of emulation cycles can be set with a time allowed to run or by specific number of emulation cycles. One of the two options must be selected via a set of radio buttons; however there is no indication that software ran out of cycles, ran out of time, or ended on its own.
With the presence of this looping, there is not a way to decipher if a behavior has been called a large number of times independently or due to looping. There is also not a way to tell if the looping plays an important role and if counting the behavior within each loop should be done or not. So it was decided that the mere existence of a behavior occurring in a software item is what would be counted.
Here is an example:
0x77D3718C=USER32!PeekMessageA (0x0012FF5A,0x000001F4,0x00000001,0x00000001) 0x77D3718C=USER32!PeekMessageA (0x0012FF5A,0x000001F4,0x00000001,0x00000001) 0x77D3718C=USER32!PeekMessageA (0x0012FF5A,0x000001F4,0x00000001,0x00000001) 0x77D3718C=USER32!PeekMessageA (0x0012FF5A,0x000001F4,0x00000001,0x00000001) 0x77D3718C=USER32!PeekMessageA (0x0012FF5A,0x000001F4,0x00000001,0x00000001)
20
perhaps five occurrences (or counts) would not greatly skew statistics, however, what cannot be shown here is that the log belonging to Crasher.10 contains 132,833 lines. A rather sizeable 131,964 of those lines appear consecutively as the exact same function call shown in the example. This behavior would be given a count of 131,964 for this software and would absolutely sway statistics to show an overwhelming existence of this behavior for the class Denial of Service.
Counts were found with the following query and stored in the table Patterns1. (Table is named Patterns1 even though single behaviors are evaluated in order to keep a consistent naming convention, i.e. Patterns1, Patterns2, Patterns3, etc, where the number represents the length of the pattern.) This query was compared to several others that would return the same information by running each query, observing run time, and by examining the explain plans provided by Oracle (please refer to the Appendix for an example and explanation of explain plans). For the full script, please refer to the appendix. Before using the script, indexes were built for both
software_id and behavior_id on the Interactions table.
SELECT COUNT(*) FROM SOFTWARE S
WHERE S.CLASSIFICATION_ID = :CLASSIFICATION_ID AND S.FOR_ANALYSIS = 'Y'
AND EXISTS (SELECT 1
FROM INTERACTIONS I
WHERE I.SOFTWARE_ID = S.SOFTWARE_ID AND I.BEHAVIOR_ID = :BEHAVIOR_ID)
Bind variables represent variables that would be passed via cursor loops.
Example of results:
Behavior, with database id 723, has name GetEnvironmentStringsA. This behavior is a function and belongs to the DLL library KERNEL32.
GetEnvironmentStringsA occurs in only one software item in a non-malicious software sample set of size 340 (0.29%). This behavior occurs at least once per software in all of the malicious software sampled for each malware classification (100%).
Pattern Behavior Analysis
21
of malware that we tested. What we hoped to find were those behaviors that by themselves, in
the single analysis, didn‘t appear suspicious, but when grouped with other behaviors showed a
noticeable difference. For example, perhaps behaviors A, B, and C have a fairly even distribution in all classes but could only be found grouped together in a particular class.
The combination algorithm was used to find all combinations within a set of 2051 behaviors where the combination is three behaviors in length. In future work, other lengths will be tested; however length three was chosen for now as it is what our resources would allow. We could have used a length of two but it was realized that length two would not capture the simple process of opening, reading, and writing to a file.
The basis for other analysis was found with the same method that that was used for single behaviors. Counts of the number of times a behavior pattern occurred per software per class were taken. Only one count was given per software. The same logic that was used to avoid erroneous counts of single behaviors due to looping was also applied to patterns. If there were three Backdoors – A opens a file, reads the file, updates the file 23 times, B opens a file, reads the file, updates the file 12 times, and C opens a file, reads the file, updates the file 0 times; the count for the pattern of opening a file, reading the file, and updating the file is 2, 1 for A and 1 for B. Patterns were generated with an application written in Java with JDBC. Please refer to the appendix for this code.
Counting the existence of patterns was found with the following query and stored in the table Patterns3. As with single behaviors, the query was compared to other alternatives with testing and explain plans. Indexes were built for behavior_id1, behavior_id2, and behavior_id3 on the
Patterns3 table.
SELECT COUNT(DISTINCT S.SOFTWARE_ID) FROM SOFTWARE S, PATTERNS3 P
WHERE P.PATTERN3_ID = :PATTERN3_ID AND S.FOR_ANALYSIS = 'Y'
AND S.CLASSIFICATION_ID = :CLASSIFICATION_ID
AND S.SOFTWARE_ID IN (SELECT DISTINCT S1.SOFTWARE_ID FROM INTERACTIONS I1, SOFTWARE S1 WHERE I1.SOFTWARE_ID = S1.SOFTWARE_ID AND I1.BEHAVIOR_ID = P.BEHAVIOR_ID1) AND S.SOFTWARE_ID IN (SELECT DISTINCT S1.SOFTWARE_ID
FROM INTERACTIONS I2, SOFTWARE S2 WHERE I2.SOFTWARE_ID = S2.SOFTWARE_ID
AND I2.BEHAVIOR_ID = P.BEHAVIOR_ID2) AND S.SOFTWARE_ID IN (SELECT DISTINCT S3.SOFTWARE_ID
22
WHERE I3.SOFTWARE_ID = S3.SOFTWARE_ID AND I3.BEHAVIOR_ID = P.BEHAVIOR_ID3)
Bind variables represent variables that would be passed via cursor loops.
Example of result:
130:744:1091 - Application:0, Virus:10; where the first three numbers represents a pattern using behavior ids from the database, and following the pattern is a count of that pattern‘s occurrence in the classes Application and Virus.
For the purposes of this paper and project, non-malicious software was given the classification
‗Application‘.
Pattern table information
Results of counts were stored in the database. 3NF was maintained, however the decision to favor speed or to favor storage space was a constant battle. Tables were given class name as column names as can be seen in this table description:
Name Null? Type
--- --- ---
APPLICATION NUMBER(10)
BACKDOOR NUMBER(10)
DOS NUMBER(10)
EMAIL_FLOODER NUMBER(10)
EMAIL_WORM NUMBER(10)
EXPLOIT NUMBER(10)
FLOODER NUMBER(10)
IM_FLOODER NUMBER(10)
IM_WORM NUMBER(10)
IRC_WORM NUMBER(10)
NET_WORM NUMBER(10)
NUKER NUMBER(10)
P2P_WORM NUMBER(10)
ROOTKIT NUMBER(10)
SMS_FLOODER NUMBER(10)
SNIFFER NUMBER(10)
SPAMTOOL NUMBER(10)
23
TROJAN NUMBER(10)
TROJAN_CLICKER NUMBER(10)
TROJAN_DDOS NUMBER(10)
TROJAN_DOWNLOADER NUMBER(10)
TROJAN_DROPPER NUMBER(10)
TROJAN_NOTIFIER NUMBER(10)
TROJAN_PROXY NUMBER(10)
TROJAN_SPY NUMBER(10)
VIRUS NUMBER(10)
WORM NUMBER(10)
PATTERN1_ID NOT NULL NUMBER(20) BEHAVIOR_ID NOT NULL NUMBER(20)
In order to join another table to table Patterns1, by classification, one would have to use
something such as an EXECUTE IMMEDIATE SQL statement in order to pass a classification name as a column name in a varchar2. The alternative would have been to have two columns:
classification_id and count. Since there are 2051 behaviors, this would have meant 2051 records
24
CHAPTER 5 – DATA ANALYSIS
Single Behavior Findings
We observed roughly 2000 different ―single behaviors‖ in our sandbox environment and
investigated the proportional breakdown, i.e. given this observed behavior, what proportions of the particular classes exhibited that behavior?
We aggregated data and fixed six classes: CApp for Applications, CWorm for Worms, CVirus for
Viruses, CTrojan for Trojans, CDOS for Denial of Service, and CAPT for Advanced Persistent Threats.
Looking first at our reference non-malicious ‗Application‘ class CApp, we see that the top 15
‗single behaviors‘ are observed during execution of almost all of them (Table 3).
Library Behavior B P(B|CApp)
KERNEL32 SetCurrentDirectory 100%
KERNEL32 _lopen 100%
KERNEL32 GetFileSize 100%
KERNEL32 CloseHandle 100%
KERNEL32 InternalExec 100%
KERNEL32 GetCurrentProcessId 100%
KERNEL32 WinExec 99%
KERNEL32 CreateProcessA 99%
KERNEL32 RtlZeroMemory 96%
KERNEL32 HeapAlloc 96%
KERNEL32 GetModuleHandleA 96%
KERNEL32 GetProcAddress 96%
KERNEL32 GetCommandLineW 96%
KERNEL32 lstrlenW 96%
KERNEL32 LoadLibraryA 96%
Table 3: Top 15 behaviors and probabilities that given class CApp, single behavior B is observed.
If we compare these behavior occurrences across other classes, i.e. given an observed behavior, what class can it be attributed to; we find the following descriptive statistics (interesting behavior highlighted in yellow, reference class grayed). We show most prevalent behaviors seen in the class, meaning the behavior appears in at least 90% of the class.
These tables all show probabilities of the form: Given class Ci, what is the probability that we
see behavior B, this is P(B|Ci) We want to answer the question: Given behavior B, what is
the probability of belonging to a certain class P(Ci|B)?
The discrepancies between classes will help us to identify, by inspection, candidates for
25
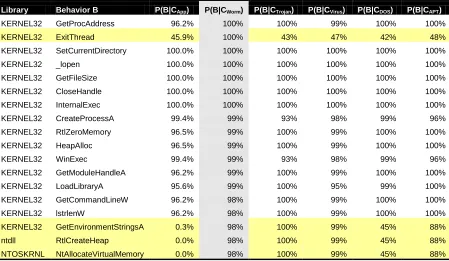
Library Behavior B P(B|CApp) P(B|CWorm) P(B|CTrojan) P(B|CVirus) P(B|CDOS) P(B|CAPT)
KERNEL32 SetCurrentDirectory 100% 100% 100% 100% 100% 100%
KERNEL32 _lopen 100% 100% 100% 100% 100% 100%
KERNEL32 GetFileSize 100% 100% 100% 100% 100% 100%
KERNEL32 CloseHandle 100% 100% 100% 100% 100% 100%
KERNEL32 InternalExec 100% 100% 100% 100% 100% 100%
KERNEL32 GetCurrentProcessId 100% 23% 33% 6% 68% 47%
KERNEL32 WinExec 99% 99% 93% 98% 99% 96%
KERNEL32 CreateProcessA 99% 99% 93% 98% 99% 96%
KERNEL32 RtlZeroMemory 96% 99% 100% 99% 100% 100%
KERNEL32 HeapAlloc 96% 99% 100% 99% 100% 100%
KERNEL32 GetModuleHandleA 96% 99% 100% 99% 100% 100%
KERNEL32 GetProcAddress 96% 99% 100% 99% 100% 100%
KERNEL32 GetCommandLineW 96% 98% 100% 99% 100% 100%
KERNEL32 lstrlenW 96% 98% 100% 99% 100% 100%
KERNEL32 LoadLibraryA 96% 99% 100% 95% 99% 100%
Table 4: Comparison of the top 4% behaviors of CApp with the other 5 classes.
GetCurrentProcessId occurs in 100% of Application samples, but only between 6-68% of the other malware classes exhibit that behavior.
Library Behavior B P(B|CApp) P(B|CWorm) P(B|CTrojan) P(B|CVirus) P(B|CDOS) P(B|CAPT)
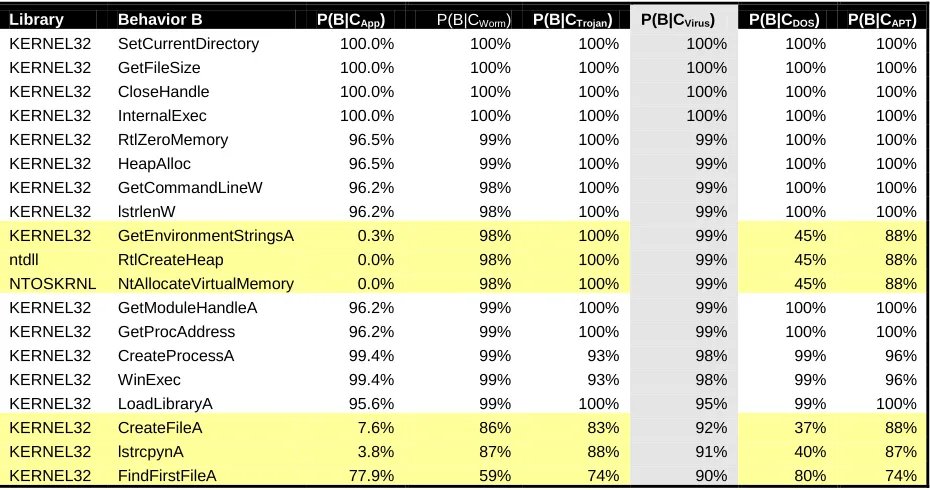
KERNEL32 GetProcAddress 96.2% 100% 100% 99% 100% 100%
KERNEL32 ExitThread 45.9% 100% 43% 47% 42% 48%
KERNEL32 SetCurrentDirectory 100.0% 100% 100% 100% 100% 100%
KERNEL32 _lopen 100.0% 100% 100% 100% 100% 100%
KERNEL32 GetFileSize 100.0% 100% 100% 100% 100% 100%
KERNEL32 CloseHandle 100.0% 100% 100% 100% 100% 100%
KERNEL32 InternalExec 100.0% 100% 100% 100% 100% 100%
KERNEL32 CreateProcessA 99.4% 99% 93% 98% 99% 96%
KERNEL32 RtlZeroMemory 96.5% 99% 100% 99% 100% 100%
KERNEL32 HeapAlloc 96.5% 99% 100% 99% 100% 100%
KERNEL32 WinExec 99.4% 99% 93% 98% 99% 96%
KERNEL32 GetModuleHandleA 96.2% 99% 100% 99% 100% 100%
KERNEL32 LoadLibraryA 95.6% 99% 100% 95% 99% 100%
KERNEL32 GetCommandLineW 96.2% 98% 100% 99% 100% 100%
KERNEL32 lstrlenW 96.2% 98% 100% 99% 100% 100%
KERNEL32 GetEnvironmentStringsA 0.3% 98% 100% 99% 45% 88%
ntdll RtlCreateHeap 0.0% 98% 100% 99% 45% 88%
NTOSKRNL NtAllocateVirtualMemory 0.0% 98% 100% 99% 45% 88%
Table 5: Comparison of the top 2% behaviors of CWorm with the other 5 classes
26
Persistent Threads, Viruses, and Trojans. However, they only occur in 45% of Denial of Service attacks and 0 – 0.3% of Applications.
Library Behavior B P(B|CApp) P(B|CWorm) P(B|CTrojan) P(B|CVirus) P(B|CDOS) P(B|CAPT)
KERNEL32 GetProcAddress 96.2% 100% 100% 99% 100% 100%
KERNEL32 SetCurrentDirectory 100.0% 100% 100% 100% 100% 100%
KERNEL32 _lopen 100.0% 100% 100% 100% 100% 100%
KERNEL32 GetFileSize 100.0% 100% 100% 100% 100% 100%
KERNEL32 CloseHandle 100.0% 100% 100% 100% 100% 100%
KERNEL32 InternalExec 100.0% 100% 100% 100% 100% 100%
KERNEL32 RtlZeroMemory 96.5% 99% 100% 99% 100% 100%
KERNEL32 HeapAlloc 96.5% 99% 100% 99% 100% 100%
KERNEL32 GetModuleHandleA 96.2% 99% 100% 99% 100% 100%
KERNEL32 LoadLibraryA 95.6% 99% 100% 95% 99% 100%
KERNEL32 GetCommandLineW 96.2% 98% 100% 99% 100% 100%
KERNEL32 lstrlenW 96.2% 98% 100% 99% 100% 100%
KERNEL32 GetEnvironmentStringsA 0.3% 98% 100% 99% 45% 88%
ntdll RtlCreateHeap 0.0% 98% 100% 99% 45% 88%
NTOSKRNL NtAllocateVirtualMemory 0.0% 98% 100% 99% 45% 88%
KERNEL32 CreateProcessA 99.4% 99% 93% 98% 99% 96%
KERNEL32 WinExec 99.4% 99% 93% 98% 99% 96%
Table 6: Comparison of the top 7% behaviors of CTrojan with the other 5 classes
In Table , for the class Trojan, we have three API calls which occur in other classes less
prevalently but 100% in Trojans. They are again, GetEnvironmentStringsA, RtlCreateHeap, and NtAllocateVirtualMemory. Occurrence is similar to that of Trojan in Viruses, Advanced
Persistent Threats, and Worms from 88 to 99% but again occur in 45% of Denial of Service Attacks and only 0 – 0.3% of Applications.
Library Behavior B P(B|CApp) P(B|CWorm) P(B|CTrojan) P(B|CVirus) P(B|CDOS) P(B|CAPT)
KERNEL32 SetCurrentDirectory 100.0% 100% 100% 100% 100% 100%
KERNEL32 GetFileSize 100.0% 100% 100% 100% 100% 100%
KERNEL32 CloseHandle 100.0% 100% 100% 100% 100% 100%
KERNEL32 InternalExec 100.0% 100% 100% 100% 100% 100%
KERNEL32 RtlZeroMemory 96.5% 99% 100% 99% 100% 100%
KERNEL32 HeapAlloc 96.5% 99% 100% 99% 100% 100%
KERNEL32 GetCommandLineW 96.2% 98% 100% 99% 100% 100%
KERNEL32 lstrlenW 96.2% 98% 100% 99% 100% 100%
KERNEL32 GetEnvironmentStringsA 0.3% 98% 100% 99% 45% 88%
ntdll RtlCreateHeap 0.0% 98% 100% 99% 45% 88%
NTOSKRNL NtAllocateVirtualMemory 0.0% 98% 100% 99% 45% 88%
KERNEL32 GetModuleHandleA 96.2% 99% 100% 99% 100% 100%
KERNEL32 GetProcAddress 96.2% 99% 100% 99% 100% 100%
KERNEL32 CreateProcessA 99.4% 99% 93% 98% 99% 96%
KERNEL32 WinExec 99.4% 99% 93% 98% 99% 96%
KERNEL32 LoadLibraryA 95.6% 99% 100% 95% 99% 100%
KERNEL32 CreateFileA 7.6% 86% 83% 92% 37% 88%
KERNEL32 lstrcpynA 3.8% 87% 88% 91% 40% 87%
KERNEL32 FindFirstFileA 77.9% 59% 74% 90% 80% 74%
27
For the class Virus, we have 6 API calls which occur in other classes less prevalently. Once more, the three behaviors GetEnvironmentStringsA, RtlCreateHeap, and
NtAllocateVirtualMemory occur significantly less in Applications, from 0 – 0.3%, and in Denial of Service, 45%. CreateFileA and lstrcpynA occur in Viruses 91% to 92%, and in Worms, Trojans, and Advanced Persistent Threats 83 to 88%; but only 37 - 40% in Denial of Service and 7.6 and 3.8% in Applications. FindFirstFileA occurs in 90% of Viruses and much lower with 59% in Worms, but is somewhat close to Viruses in the other four classes with 74 – 80%.
Library Behavior B P(B|CApp) P(B|CWorm) P(B|CTrojan) P(B|CVirus) P(B|CDOS) P(B|CAPT)
KERNEL32 SetCurrentDirectory 100.0% 100% 100% 100% 100% 100%
KERNEL32 GetFileSize 100.0% 100% 100% 100% 100% 100%
KERNEL32 CloseHandle 100.0% 100% 100% 100% 100% 100%
KERNEL32 InternalExec 100.0% 100% 100% 100% 100% 100%
KERNEL32 RtlZeroMemory 96.5% 99% 100% 99% 100% 100%
KERNEL32 HeapAlloc 96.5% 99% 100% 99% 100% 100%
KERNEL32 GetCommandLineW 96.2% 98% 100% 99% 100% 100%
KERNEL32 lstrlenW 96.2% 98% 100% 99% 100% 100%
KERNEL32 GetModuleHandleA 96.2% 99% 100% 99% 100% 100%
KERNEL32 GetProcAddress 96.2% 99% 100% 99% 100% 100%
KERNEL32 CreateProcessA 99.4% 99% 93% 98% 99% 96%
KERNEL32 WinExec 99.4% 99% 93% 98% 99% 96%
KERNEL32 LoadLibraryA 95.6% 99% 100% 95% 99% 100%
KERNEL32 _lclose 78.5% 84% 91% 49% 91% 90%
Table 8: Comparison of the top 9% behavior of CDOS with the other 5 classes
In Table for class DoS, there are three behaviors that occur less in other classes than in Denial of Service. CreateProcessA and WinExec exist in fewer software than Denial of Service but not with a significant difference at 93 to 99.4%. _lclose has a somewhat significant difference with 91% occurrence in Denial of Service and 49% in Viruses; but a close 78.5 – 91% in the four other classes.
Library Behavior B P(B|CApp) P(B|CWorm) P(B|CTrojan) P(B|CVirus) P(B|CDOS) P(B|CAPT)
KERNEL32 SetCurrentDirectory 100.0% 100% 100% 100% 100% 100%
KERNEL32 _lopen 100.0% 100% 100% 100% 100% 100%
KERNEL32 GetFileSize 100.0% 100% 100% 100% 100% 100%
KERNEL32 CloseHandle 100.0% 100% 100% 100% 100% 100%
KERNEL32 InternalExec 100.0% 100% 100% 100% 100% 100%
KERNEL32 RtlZeroMemory 96.5% 99% 100% 99% 100% 100%
KERNEL32 HeapAlloc 96.5% 99% 100% 99% 100% 100%
KERNEL32 GetCommandLineW 96.2% 98% 100% 99% 100% 100%
KERNEL32 lstrlenW 96.2% 98% 100% 99% 100% 100%
KERNEL32 GetModuleHandleA 96.2% 99% 100% 99% 100% 100%
KERNEL32 GetProcAddress 96.2% 99% 100% 99% 100% 100%
KERNEL32 LoadLibraryA 95.6% 99% 100% 95% 99% 100%
KERNEL32 CreateProcessA 99.4% 99% 93% 98% 99% 96%
KERNEL32 WinExec 99.4% 99% 93% 98% 99% 96%
28
In Table , we see that no behavior in the top 4% of the class APT is much different in other classes. This is both expected and disheartening: Expected because Advanced Persistent Threats are persistent precisely because they blend in with normal behavior, and disheartening because it looks like no specific behavior of APTs is less common in other classes.
Bayesian Inference
We have now the most prevalent behaviors, given a class (these are the P(B|CApp), P(B|CWorm), P(B|CTrojan), P(B|CVirus), P(B|CDOS) and P(B|CAPT) ).
From the yellow highlights, we pick 11 candidate behaviors as potential discriminators. We list them below:
ID Library Behavior B Prevalent Behavior in Class
0 KERNEL32 GetCurrentProcessId Application
1 KERNEL32 ExitThread Worm
2 KERNEL32 GetEnvironmentStringsA Worm, Trojan, Virus
3 ntdll RtlCreateHeap Worm, Trojan, Virus
4 NTOSKRNL NtAllocateVirtualMemory Worm, Trojan, Virus
5 KERNEL32 CreateFileA Virus
6 KERNEL32 lstrcpynA Virus
7 KERNEL32 FindFirstFileA Virus
8 KERNEL32 CreateProcessA DOSers
9 KERNEL32 WinExec DOSers
10 KERNEL32 _lclose DOSers
Table 10: Behavior used for testing class membership
The more interesting question remains: Given an observed behavior Bi, 0<=i< 10, what is the
most likely class Cj, j {App, Worm, Virus, Trojan, DOS, APT} the behavior characterizes?
This P(Cj|Bi) can be solved using Bayes‘s formula [22] for six classes and those twelve
behaviors. We proceed to solve it as an example for one behavior and the six classes, and then give the complete numerical results in a table.
Bayes‘s formula is
P(Cj |Bi) P(Bi |Cj) P(Cj)
P(B|Cy) P(Cy) y 0
5
Bi are the eleven behaviors and Cj are the 6 classes. The P(Bi|Cj) we get partially from the tables
29
Table . When we have zero probability of occurrence, we attribute that to sampling error and use
a very low probability value of 0.0001, as per best practices to not blow up the formula.
Behavior B P(B|CApp) P(B|CWorm) P(B|CTrojan) P(B|CVirus) P(B|CDOS) P(B|CAPT)
GetCurrentProcessId 1 0.23 33 0.06 0.68 0.47
ExitThread 0.46 1 0.43 0.47 0.42 0.48
GetEnvironmentStringsA 0.003 0.98 1 0.99 0.45 0.88
RtlCreateHeap 0.0046 0.98 1 0.99 0.45 0.88
NtAllocateVirtualMemory 0.0001 0.98 1 0.99 0.45 0.88
CreateFileA 0.076 0.86 0.83 0.92 0.37 0.88
lstrcpynA 0.038 0.87 0.88 0.91 0.4 0.87
FindFirstFileA 0.78 0.59 0.74 0.9 0.8 0.74
CreateProcessA 0.99 0.99 0.93 0.98 0.99 0.96
WinExec 0.99 0.99 0.93 0.98 0.99 0.96
_lclose 0.79 0.84 0.91 0.49 0.91 0.9
Table 11: Given a class of programs, the probabilities we saw a behavior
The probabilities P(Cj) – the probability of the classes - we get from the class frequencies of our 2000 or so samples from our aggregated Norman data. These are 0.17, 0.17, 0.24, 0.18, 0.13, and 0.11 for App, Worm, Virus, Trojan, DOS, and APT, respectively (see Table 1).
P(CApp) P(CWorm) P(CTrojan) P(CVirus) P(CDOS) P(CAPT)
0.17 0.17 0.24 0.18 0.13 0.11
Table 12: Class probabilities in our 2000 samples
Let‘s compute this, as an example, for behavior B3 in Table , RtlCreateHeap. The question we
proceed to answer as an example: If we execute something unknown and see RTLCreateHeap,
what is the probability that it belongs to one of the classes? We have for B3 and CApp :
P(CApp |B3)
P(B3|CApp) P(CApp)
P(B3 |Cy) P(Cy)
y 0 5
0.0046 0.17
0.0046 0.17 0.098 0.17 1 0.24 0.99 0.18 0.45 0.13 0.88 0.11 0.1%
We can compute this for all six classes in Table
Behavior B3 P(CApp|B3) P(CWorm|B3) P(CTrojan|B3) P(CVirus|B3) P(CDOS|B3) P(CAPT|B3)
RtlCreateHeap 0.1% 22.5% 32.4% 24.1% 7.9% 13.1%
30
We interpret this as seeing that behavior RtlCreateHeap is most strongly associated with class
Trojan. It is also interesting to note that RtlCreateHeap is almost never found in the class
Application. This is consistent with this API call being an undocumented function. [23] We now give the entire computation and highlight relevant results in yellow in Table
ID Behavior B P(C
App|BID) P(CWorm|BID) P(CTrojan|BID) P(CVirus|BID) P(CDOS|BID) P(CAPT|BID)
0 GetCurrentProcessId 2.1% 0.5% 95.7% 0.1% 1.1% 0.6%
1 ExitThread 14.4% 31.3% 19.0% 15.6% 10.0% 9.7%
2 GetEnvironmentStringsA 0.1% 22.5% 32.4% 24.1% 7. 9% 13.1%
3 RtlCreateHeap 0.1% 22.5% 32.4% 24.1% 7.9% 13.1%
4 NtAllocateVirtualMemory 0.1% 22.5% 32.4% 24.1% 7.9% 13.1%
5 CreateFileA 1.9% 21.9% 29.8% 24.8% 7.2% 14.5%
6 lstrcpynA 1.0% 21.8% 31.2% 24.2% 7.7% 14.1%
7 FindFirstFileA 17.5% 13.2% 23.4% 21.4% 13.7% 10.7%
8 CreateProcessA 17.3% 17.3% 23.0% 18.2% 13.3% 10.9%
9 WinExec 17.3% 17.3% 23.0% 18.2% 13.3% 10.9%
10 _lclose 16.8% 17.8% 27.3% 11.0% 14.8% 12.4%
31
Discussion
We find that of the 11 behaviors we chose to test from our 2000 samples of six classes, most behaviors are associated strongest with class Trojan with GetProcessID being very strongly
represented. Behavior ExitThread is seen most in class worms, also an interesting find, which
may be related to the propagation module of worms. We further note that for class Application behaviors 2,3,4,5 and 6 are rarely seen.
These are hopeful results. There were many other interesting items found by digging and
prodding around in our database, with a human eye, that we were unfortunately unable to capture with an automated or statistical measure. For instance, there appears to be behaviors that show consistency in the average of occurrences per software per class. This however is diluted by the looping we spoke of earlier. We will continue to attempt to work around this looping. We have seen that the looping seems to be more prevalent in malicious software and we hypothesize that this is related to non-malicious software having better conditions and cleaner exit strategies. We saw two slightly different types of looping. Sometimes there are a set of behaviors that appear to be aimlessly and infinitely looping. In other cases, there was one particular behavior,
FindNextFileA, which could either be a programming issue or could intentionally be searching through files.
Besides infinite looping, another trend consistent with particular classes was the use of foul language within function call parameters. This isn‘t to say it happens often, just that when it
does happen, it is more often than not, within a malicious class of software. We believe we can find other consistency within parameters and other types of interaction details.
We conclude that our procedure is a potentially viable method to test class association and for malicious software detection with observed behavior, with a few caveats. We did our inference for the behaviors picked for high prevalence in a class. We should repeat these experiments for rare behavior prevalence in classes in future work. We will create several sets of sample data for each class instead of working with large numbers. Also, we will update our database with newer malware. It was discovered that our non-malicious software samples were biased to Windows 32, and this most likely affected our counting data for the Application class. We need to include more independent applications. This is possibly in line with our
GetEnvironmentStringsA example mentioned much earlier and also in our analysis represented in the above tables. It is an interesting but strange fact that we see this behavior so prevalent amongst malicious software and not in non-malicious. Therefore it is also our conclusion that while many of these processes can be automated, before any behavior
32
33
CHAPTER 6 - FUTURE MALWARE
It is hard to gauge how much mileage signature-matching-based AV detection techniques still have in them in light of polymorphic and metamorphic threats. Some industry researchers are optimistic.
We briefly mention k-ary malware, a worrisome development, in this context, k-ary malware, of which at this time only laboratory or very trivial examples are known to exist, seem able to elude conventional deployed defenses in principle, not just in practice. [21]
This feat is accomplished by partitioning the malware‘s functionality spatio-temporally into k distinct parts, with each part containing merely an innocuous subset of the total instructions. In serial or parallel combination, they subsequently become active. Current AV models seem unable to detect this threat (or disinfect completely upon detection), which may be due to fundamental theoretical model assumptions. [21]
To understand the limitation of current approaches, one has to remember a simple explanation: You cannot make a good (as in justifiable) decision if you do not have all the information needed.
The notion of computability rests largely on the Turing thesis. Although the Church-Turing thesis refers explicitly to the computation of functions, this small but important caveat is not emphasized to the extent that it should be; instead it is understood to mean that Turing machines model all computation. Herein lies the flaw: not only are there some functions that cannot be computed by Turing machines, but more fundamentally, not all computable problems are function-based to begin with (Bilar08). Function-based or algorithmic (with loops)
computation requires the input to be specified at the start of the computation; it is a closed
transformation from input to output. This cannot take later triggers from the outside into account, as we saw with the brouhaha about Conficker in 2009.
In light of emerging malware, new models and methods are being developed. In the theoretical realm, this entails moving beyond Turing machine models premised on the strong Church-Turing
thesis (‗computation-as-functions‘) towards more expressive models premised on ‗Interactive