0 INTRODUCTION
Conditional-based maintenance (CBM) is a modern maintenance concept [1]. As an effective method to realize CBM, prognostics and health management (PHM) has become the focus of the research [2]. One typical example is the application of PHM in joint strike fight (JSR) F-35 [3]. To establish the appropriate PHM of equipment, it is first necessary to conduct the research of degradation feature extraction for prognostics [4]. The degradation experiment requires a long time and the vibration signals during the degradation are very complex [5]. However, features extracted by traditional methods [6] are normally based on the single monitoring signal. Tran et al. extracted features by the analysis of the monitoring signal in the time domain [7]. Zhao used the empirical mode decomposition (EMD) in vibration signal analysis and extracted the approximate entropy as the degradation feature [8]. Dong et al. chose the non-extensive wavelet feature scale entropy to be the feature for degradation evaluation [9]. In this situation, some important fault information may be lost. For example, it is known that the loose slipper fault is the typical failure mode of hydraulic pumps [10]. It is caused by the wear between the head of the piston and the hat of the slipper [11]. Finally, the interaction could be monitored on the pump shell in the form of strikes.
However, the strikes of the interaction are not always from only one direction [12]. Analysis based on a single vibration signal can hardly achieve the whole information needed for diagnosis and prognosis. As a result, multi-direction vibration signals are required for processing. Additionally, vibrations of hydraulic pumps caused by the striking from pistons are directly influenced by the coupling effect [13]. It seems to be extremely difficult to effectively extract obvious fault information. To solve this issue, a modified method is required to fuse multi-direction signals of the hydraulic pump to extract the degradation features more effectively.
The traditional fusion algorithms for multiple signals include the weighted fusion algorithm [14], the Kalman filtering algorithm [15] and the wavelet analysis fusion algorithm [16]. Based on the analysis of these methods [17], it is known that some important fault information may be lost due to the inherent disadvantages during signal processing [18]. As a novel fusion algorithm, composite spectrum (CS) can calculate the correlative relations between neighbouring signals for information fusion [19]. Considering the structural characters of hydraulic pumps, some modifications must be made to extract the sensitive features effectively [20]. First, the complex computation caused by the multiplication the CS algorithm must be reduced. On this basis,
The Application of LCS and Information Entropy
as a Novel Fusion Algorithm for Degradation Feature Extraction
Wang, H. – Sun, J. – Duan, X. – Shan, G. – Yang, W.Haotian Wang1 – Jian Sun2,* – Xiusheng Duan1 – Ganlin Shan1 – Wen Yang2 1 Mechanical Engineering College, China
2 Luoyang Electronic Equipment Test Center of China, China
Feature extraction is significant for the prognostics and health management (PHM) of hydraulic pumps. In this paper, a novel fusion algorithm is proposed based on local characteristic-scale decomposition (LCD), composite spectrum (LCS). and information entropy. To make full use of feature information, the LCS is proposed based on the modification of traditional composite spectral algorithm. LCS high-order power entropy and high-order singular entropy, which are relatively defined in Shannon entropy (SE) and Tsallis entropy (TE), are extracted as initial features. Furthermore, the method of feature fusion is presented to modify the features’ conciseness and to improve the performance. Results of the analysis in the experiment indicate that the proposed method is available, and the fused feature is effective in evaluating the pump degradation process.
Keywords: degradation feature extraction, information fusion, LCS, information entropy, hydraulic pump.
Highlights
• A novel fusion algorithm based on LCS and information entropy for the degradation feature extraction of hydraulic pumps is proposed.
• The fusion method based on information entropy is proposed to make fusion of initial features.
an appropriate method is required for CS fusion to obtain detailed components from the original signals, which contain sensitive feature information. An LCD algorithm is an efficient nonlinear signal processing
method [21]. The feature information in the original
signal can be detailed into various intrinsic scale components (ISCs) [22]. The sensitive information is relatively easy to be achieved for CS fusion. Therefore, based upon the modification of the earlier CS, the LCD composite spectrum (LCS) algorithm is proposed for the fusion of various vibration signals to extract sensitive degradation features.
Features extracted by various methods can reveal fault information in different aspects to improve completeness. However, it may also increase information redundancy degree and even result in dimensional disaster [23]. Common methods to solve this problem include decreasing dimensions by simplifying signal features [24]. The typical algorithms are principal component analysis (PCA) and the locality-preserving projection (LPP). PCA performs better only with linear data. If the high-dimensional data needed processing is nonlinear, the PCA’s ability for feature dimensionality reduction would be limited [25]. LPP is a widely used manifold learning algorithm. Based on the Laplace mapping, LPP can deal with the nonlinear data [26]. However, LPP always requires many samples [27]. Furthermore, these dimensionally reduction methods may delete parts of features directly, leading to the loss of sensitive information. As analysed, the basis for feature dimensionality reduction is to evaluate the correlations between various vectors [28]. Correlation coefficient is one traditional factor [29]. Because of the structural character of hydraulic pump, the data of the extracted feature are nonlinear to a large extent. In this situation, the correlation coefficient can hardly evaluate the correlations. Based on information entropy theory, the relative entropy can reveal the correlation between nonlinear data by the analysis of the complexity [30]. Therefore, the feature fusion algorithm is proposed to make full use of the extracted features’ information and to improve features conciseness.
Consequently, the method for feature fusion using LCS and relative entropy is proposed. This article is organized as follows: In Section 0, the LCS algorithm is presented for multi-channel signal fusion; In Section 1, LCS high-order power entropy and the high-order singular entropy, which are relatively defined in SE and TE, are extracted as initial features; in Section 2, a feature fusion strategy based on relative entropy is put forward in detail and the originally extracted features
are fused into the required new feature; in Section 3, the experiment is presented and the results are verified by the application of the proposed method; in Section 4, some conclusions are drawn.
1 THE PROPOSED LCS FUSION ALGORITHM
1.1 Signals Decomposed by LCD
Assuming that x(t) denotes the original signal, the LCD algorithm is detailed as follows.
Step 1. Confirm the extremum point Xk of x(t)
and its correspondent time τk , k = 1, 2, ..., M.M is the
total number of all extremum points.
Step 2. Calculate Ak+1 (k = 2, 3, ..., K – 1) and Lk:
Ak Xk k k X X
k k k k
+ +
+
+
= + −
− −
1
1
2
2
τ τ
τ τ ( ), (1)
Lk =aAk+ −(1 a X) k, k=2 3, ,...,K−1. (2)
Step 3. Fit L1 ~ Lk by the cubic spline function and
acquire the baseline BL1(t). Separate the baseline. h t1( )=x t BL t( )− 1( ), (3)
if h1(t) meets the ISC condition [21], output
ISC1 = h1(t).
Step 4. Separate ISC1 from the original data and
get the new signal. Then repeat the steps until un(t) is
monotonous or a constant function. Get ISC1, ISC2,
…, ISCn and the trending component un(t) u tn( ).
1.2 Selection of ISCs
Normally, the correlation coefficient is applied for the reflection of the nonlinearity between variables, and the mutual information is used for the reflection of the linearity relations. In this paper, based on the SE, the mutual information I is defined:
I y y H y H y y
H y - p(y )lgp(y )dy
n i
i n
n
i i i i
( ,..., ) ( ) ( ,..., )
( )
1
1
1
= −
= =
∑
∫∫
, (4)
where, H(yi) is the entropy of yi. p(yi) is the probability
density function for pi. For the solution of joint
probability density function, the probability of the samples falling into multi-dimensional space can be used for approximate estimation.
signal is further decomposed by LCD and the ith ISC
component is marked as ISCi. The sensitive factor of
ISCi is εi , which is calculated by Eq. (5).
εi=I I1i- 2i, (5)
where, I1i denotes the mutual information between
ISCi and yf. I2i denotes the mutual information between
ISCi and ynor. Based upon the analysis above, εi can
evaluate the sensitive information contained in ISCi.
The higher the εi is, the more obvious the difference
between the mutual information I1i and I1i will be. This
means that the sensitive fault information contained in
the ISCi is supposed to be more. Therefore, the ISC
component with the highest εi will be selected from
each vibration signal.
1.3 LCS Algorithm
Based on the ns division of every ISC, the CS is
defined as [19]:
SCS fk XCSr f X f n
k CSr k r
n
s
s
( )= ( ) *( ) / ,
=
∑
1
(6)
where XCSr (fk) denotes the Fourier coefficient and
XCSr f
k
*
( ) denotes its complex conjugate in the rth
segment in all B signals. XCSr (fk) is defined by Eq. (7).
XCSr (fk)= (Sxr1 12 2γ x(f Sk) xr2 23 3γ x(fk)...SxrB−1γ(B−1)B Bx (fk))) ,
/( ) 1 B−1 (7)
where γ12, γ23, ..., γ(B–1)B, denote the coherences.
Sxr1 12 2γ x(f Sk), xr2 23 3γ x(fk),...,SxrB−1γ(B−1)B Bx (fk) are defined by Eq. (8).
Sxr1 12 2γ x (fk)=[X f1r( k)γ12X2r (fk)].
* (8)
The multiplication of the Fourier coefficient and the complex conjugate exists in CS. If Eq. (8) is combined with Eq. (7), terms like
Xr f X f X f X f
k r k r k r k
2 2 3 3
* *
( ) ( ), ( ) ( ), ... are achieved,
which can be merged together. This phenomenon leads to the increasing of the computation complexity. To solve this problem, Eq. (6) in LCS algorithm is redefined by Eq. (9).
S f X f X f X f
X f
CS k r k r k r k
r n
Br k
s
( ) ( ( ) ( ) ( )...
... (
=
= −
∑
1 122
2 23
2 3 1
1
γ γ
)) ( ) ( )) / .
/
γ B B Br
k B s
X f n
−1
2 1 (9)
Compared with Eq. (1), the computation of LCS algorithm is only around half of the earlier CS algorithm. Furthermore, the high sensitivity
information contained in the selected ISCs is introduced and further processed by LCS.
2 THE PROPOSED METHOD FOR DEGRADATION FEATURE EXTRACTION
2.1 Extraction of LCS high-Order Power Spectral Entropies
Information entropy is an effective factor to quantitatively reveal the uncertain information in the signal by putting up the contained characteristics. As indicated in our previous research in reference [31], the high order entropy is sensitive to non-symmetrical and nonlinear components and it could reveal the information which cannot be obtained by second-order statistical analysis. Therefore, the high-second-order entropy is used in this paper as the LCS spectrum analysis factor. It can describe the degradation trend. SE is a kind of information entropy that is defined
in logarithmic form. For a system which contains Q
microstates, the SE is defined by Eq. (10)[32].
SE Bolt pi pi
i Q
= −
=
∑
ln( ),1
(10)
where Bolt is the Boltzmann constant, pi means the
occurrence probability of the ith status. SE is usually
used to reveal the property of the scope system and it can reflect the general trend. However, the factual system may be more or less correlated in time and space, and SE can hardly reveal all the inner characteristics of the system. Being the generalization of SE, TE is able to reveal the non-scope information which cannot be obtained by SE. TE is defined by Eq. (11) [32].
TE Bolt piq q
i Q
= − − −
=
∑
(1 ) / (1 ),
1
(11)
where q is the non-scope parameter. The common
settled value of q is 3. Compared with SE, the values of TE range only from 0 to 1. However, there may be the correlations in time and space or certain degradation stages. TE is required to be the supplement of SE. As a result, to reveal the performance degradation of hydraulic pumps effectively and sensitively, the Shannon LCS power spectral entropy (SLPE) and Tsallis LCS power spectral entropy (TLPE) are both selected to be the features.
Based on reference [31], taking the three-channel vibration signals as example, the procedures are detailed as follows.
① LCD is applied in each of the three vibration
② Divide each ISC into N parts and then carry out Fourier transform on each part and obtain
X iij, =1 2 3, , , j=1,...,N.
③ Calculate the composite spectrum SCF( fk):
SCS fk X fj X f X f N
k j k j k
j N
( )=( ( ) ( ) ( ))/ / .
=
∑
1 122 2 23 2 3 1 1 3
γ γ (12)
④ Make standard procession on the obtained SCF( fk) and the result is {u(t), t = 1, 2, …, N}. Calculate the triple correlation of DCT coefficients.
b Y k Y
k
i i i
k s s k s s ( , ) ( ) ... ...( ( ) ( ) λ λ µ λ λ
1 2 2 1 1
2 2 1 2 2 2 1 1 1 = + + =− =−
∑
∑
))Y( )i (λ λ k k ),
1+ 2+ +1 2 (13)
where Y(i) is the DCT coefficient, μ = fk / N, s1 and
s2 are the 3-order accumulation range, λ1 and λ2
are positive and the sum should not be more than half of the sampling frequency fs.
⑤ Calculate the proportion of each coefficient:
pk bk bl
l N
=
=
∑
( ,λ λ1 2) /2 ( ,λ λ1 2) ,2
1
(14)
where K means number of the frequency bands.
⑥ Calculate SLPE and TLPE:
SLPE Bolt pk pk K
k K
= −
=
∑
( ln ) / ln ,
1
(15)
TLPE Bolt pkq q
k K
= − − −
=
∑
(1 ) / (1 ).
1
(16)
Based on the analysis, it can be seen that LCS high-order power spectral entropies (SLPE and TLPE) are sensitive to the total energy changes theoretically.
2.2 Extraction of LCS High-Order Singular Spectral Entropies
As another effective spectrum parameter, singular spectral entropy is able to reveal complexity of signal components. Compared with power spectral entropy, it tends to be more sensitive to response energy changing [33]. The first four calculation steps of LCS high order singular entropy are the same as LCS high-order power spectral entropy, and the following steps are:
⑤ Calculate the DCT high order estimation matrix
B.
B bi N
i N
( ,λ λ1 2) ( ,λ λ1 2) / .
1
=
=
∑
(17)⑥ Make singular values decomposition on U and
calculate the proportion of each:
U=EDW, (18)
where E is V×O matrix, D is O×O matrix and
D= diag(x1, x2, …, xO). W is O×T matrix, and O is
the order of U.
pu xu xo o O = =
∑
/ . 1 (19)⑦ Calculate LCS high-order singular entropies
respectively defined in SE and TE, which is marked as SLSE and TLSE:
SLSE Bolt pu pu
u O
= −
=
∑
ln ,1
(20)
TLSE Bolt puq q
u O
= − − −
=
∑
(1 ) / (1 ).
1
(21)
LCS high-order singular entropies (SLSE and TLSE) are able to reveal distributions of various mode components in composite spectrum sensitively. If the degradation degree is lighter, distributions of different mode components are in balance and the signal complexity will be higher and, consequently, the entropies will be higher.
2.3 The Proposed Features Fusion Algorithm
The main purpose of features’ fusion is to improve the completeness and conciseness. As a typical evaluating factor, the traditional definition for relative entropy is shown in Eq. (22)[34]:
I y yn H yi H y yn
i n
( ,...,1 ) ( ) ( ,...,1 ),
1
= −
=
∑
(22)where I represents for the relative entropy of vector y1, …, yn, H(yi) is the SE of each vector.
Assume that the features data collection extracted from various degradation stages after normalization is X = [X1, ..., Xn, ..., XN], where N is the number
of features. Xn is the vector of the nth feature, and
Xn=[ ,...,s1n smn T] , where
s
mn is the nth element of the
mth sample.
Step 1. For the extracted N features, calculate I (Xn1, Xn2) between two arbitrary feature vectors:
I(X Xn1, n2)=H(Xn1)+H(Xn2)−H(Xn n1 2), (23)
where, Xn1n2 is the new reconstructed feature by the
fusion of Xn1 and Xn2. smn n1 2 is the element of Xn1n2, which is defined as:
smn n p s p p p s p p
mn mn mn mn mn mn mn mn
1 2= 1 1 1+ 2 + 2 2 1+ 2
/ ( ) / ( ). (24)
Step 2. Choose Xnx and Xny with the maximum
Inxny and delete these two feature vectors. Then add
the new fused feature Xnxny into X instead. Then the
Step 3. Repeat the steps above until dimension X becomes 2.
Step 4. Carry out the final fusion of the only two features in X. The final achieved feature is the fused one needed for use.
Based on the gradual fusion strategy, all extracted features are finally fused into only one new feature, effectively improving the concision of computation.
3 EXPERIMENTAL VALIDATION
3.1 Experimental Rig
To verify the proposed method, an experiment was conducted on the test-bed shown in Fig. 1. Three-channel vibration signals were sampled.
x y z
Fig. 1. Installation of the vibration sensors
According to the technical documentation from the pump manufacturer, the volumetric efficiency (VE) is applied to evaluate the degradation performance. When VE is less than 80 %, the pump is confirmed to be failed. In this experiment, VE was less
than 80 % when the total time was 582 h 15 min 17 s.
After disassembly, the piston was verified to occur the loose slipper failure, as seen in Fig. 2.
Fig. 2. The failure of loose slipper
3.2 Results and Analysis
The whole degradation processes are roughly divided, as shown in Table 1.
Table 1. Various degradation stages
VE Operating time Degradation state Mark
95 % to 100 % 0 to 532 h 55 min 11 s normal
94 % to 95 % 532 h 55 min 12 s to 549 h 54 min 46 s initial failure F1
92.5 % to 94 % 549 h 54 min 47 s to 562 h 0 min 25 s developmentslow F2
90 % to 92.5 % 562 h 0 min 26 s to
572 h 49 min 33 s weak failure F3
85 % to 90 % 572 h 49 min 34 s to 579 h 26 min 52 s
accelerated
degradation F4
80 % to 85 % 579 h 26 min 53 s to 582 h 15 min 17 s
loose slipper
formation F5
a)
b)
c)
One sample of the F1 to F5 period is taken. {xF1, xF2, …, xF5} is used to denote the five samples.
To simplify the data processing, the initial 1 s of the 10 s sampled data are used for analysis. Every signal
contains 5200 points. xF4 is applied as a detailed
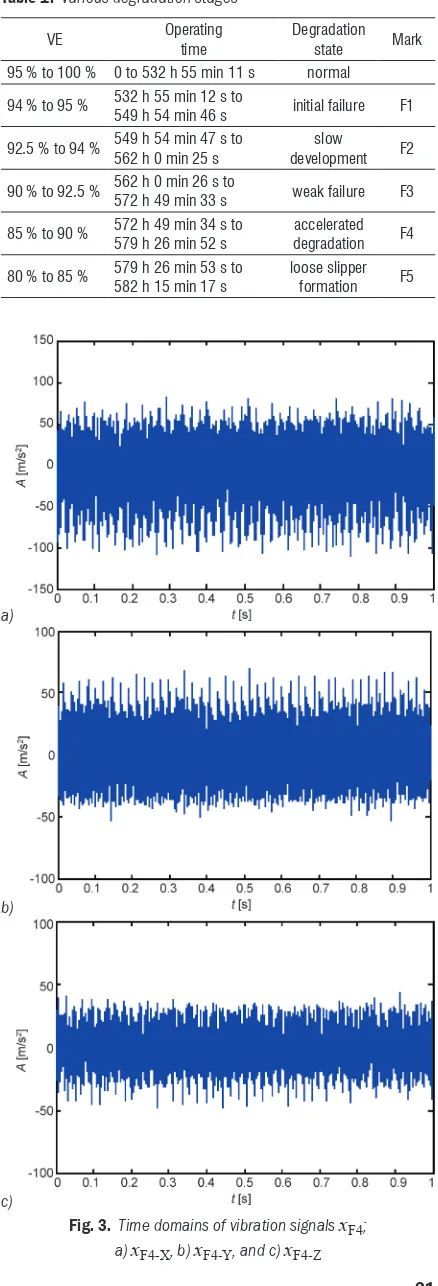
example for analysis. The time domain is shown in Fig. 3.
In Fig. 3, we can see that these original signals can hardly provide enough complete feature information and the influences by noises and other disturbances are obvious. Based on the LCD algorithm, each signal has been decomposed and 10ISCs remained. After selection, the 6th ISC of xF4-X,
the 7th ISC of xF4-Y and the 4th ISC of xF4-Z remained.
These are equally divided into segments. After Fourier
transform, the coefficients Xij are achieved.
Furthermore, SCS( fk) can be calculated by Eq. (12).
3.2.1 DCS Power Spectral Entropy
Based on the procedures presented, the following result
can be obtained: SLPE = 3.863 and TLPE = 0.725.
Similarly, SLPE and TLPE of the remaining four stages can also be obtained. Data are considered to be one group of results. Then, SLPE and TLPE of the other nine samples in F1 to F5 are calculated. Results are shown in Figs. 4 and 5.
1 2 3 4 5 6 7 8 9 10
3 3.5 4 4.5 5 5.5
Groups
SL
PE
F1 F2 F3 F4 F5
Fig. 4. SLPE in F1 to F5 degradation stages
1 2 3 4 5 6 7 8 9 10
0.5 0.6 0.7 0.8 0.9 1
Groups
T
LP
E
F1 F2 F3 F4 F5
Fig. 5. TLPE in F1 to F5 degradation stages
Fig. 4 shows SLPE in various degradation stages. With the aggravation, SLPE tends to be reduced. This reveals the tracking ability of degradation changing. However, crossovers exist in neighbouring curves obviously, meaning that the distinguish ability of SLPE still needs to be improved. Fig. 5 shows the TLPE in various degradation stages. The crossover and overlapping of neighbouring curves become less, which reveals the complementary of TE to SE.
3.2.2 LCS High-Order Singular Spectral Entropy
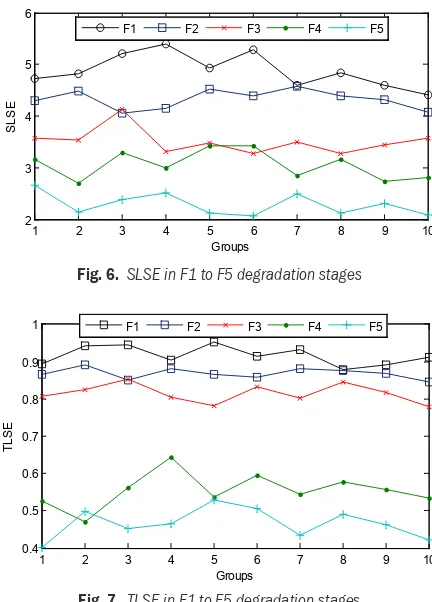
Based on the procedures presented, the result can be obtained that: SLSE = 3.227 and TLSE = 0.521. Finally, totally 10 groups of results are achieved, which are shown in Figs. 6 and 7.
1 2 3 4 5 6 7 8 9 10
2 3 4 5 6
Groups
SL
SE
F1 F2 F3 F4 F5
Fig. 6. SLSE in F1 to F5 degradation stages
1 2 3 4 5 6 7 8 9 10
0.4 0.5 0.6 0.7 0.8 0.9 1
Groups
TLS
E
F1 F2 F3 F4 F5
Fig. 7. TLSE in F1 to F5 degradation stages
3.2.3 Fusion of Features
The fusion of the ten groups of SLPE, TLPE, SLSE, TLSE in F1 to F5 are carried out, and the results are shown in Fig. 8.
1 2 3 4 5 6 7 8 9 10
0.4 0.5 0.6 0.7 0.8 0.9 1
Groups
Fus
ed F
eat
ur
e
F1 F2 F3 F4 F5
Fig. 8. Fusion feature in F1 to F5 degradation stages
3.2.4 Analysis and Comparison of Experimental Results
The double sample Z test [35] is applied for quantitative evaluation. Its computation is explained by:
Z= X1−X2 X n + X n
2 1
2 2
1 2
(µ µ ), (25)
where X1 and X2 denote sample sets of degradation
feature X in various degradation stages. X and μX2 respectively mean the average and variance of X. n is the number of samples. In comparison, the wavelet algorithm is used to process the three-channel signals. The amplitude and power of the characteristic frequencies of the constructed signal are extracted as
the traditional features, which are marked as TF-1 and TF-2. Sensitivity is calculated. and results are shown in Table 2.
In Table 2, it can be seen that the traditional features TF-1 and TF-2, based on the wavelet fusion algorithm, could roughly describe the degradation. However, limited by the disadvantages of wavelet transform, the sensitivity of TF-1 and 2 are the lowest. Compared with 1 and TF-2, the performances of four features extracted by the proposed LCS fusion algorithm are improved. According to the sensitivity of various double samples, the extracted features are complementary to each other. However, some obviously redundant information still remains. Compared with the initial four features, the fused feature keeps the better performances of original features. Sensitivity to each double sample and the mean sensitivity of the fused feature are all the highest. Furthermore, there is only one feature after fusion, so that the conciseness would be greatly improved. This feature’s fusion can effectively avoid contradiction disturbances by overloading the feature’s information during the prognostic policy-decision stage.
Furthermore, the support vector machine (SVM) is applied for verifying the identification performance of the features. The four extracted features, the fused feature based on LPP algorithm [26] and the fused feature based on the proposed algorithm are made comparison. 30 samples of each stages of F1 to F5 have been used. There are a total of 150 values for each feature. The SVM identification results are shown in Table 3.
Table 2. Sensitivity of various features
Double Samples Sensitivity
SLPE TLPE SLSE TLSE TF-1 TF-2 Fused feature
(F1, F2) 10.17 6.38 14.28 12.35 6.38 8.26 17.32
(F2, F3) 12.94 20.58 11.87 15.21 10.94 12.37 24.26
(F3, F4) 8.28 13.15 10.94 24.19 11.27 12.02 25.33
(F4, F5) 19.56 26.31 22.42 19.07 18.95 17.59 28.59
Mean sensitivity 12.74 16.61 14.88 17.70 11.89 12.56 23.88
Table 3. Degradation stages identification accuracy of various features
F1 [%] F2 [%] F3 [%] F4 [%] F5 [%] Total accuracy
SLPE 76.7 86.7 73.3 76.7 70 76.7
TLPE 73.3 90 76.7 70 83.3 78.7
SLSE 93.3 86.7 70 66.7 80 79.3
TLSE 76.7 83.3 80 80 83.3 80.6
Fused feature (LPP) 86.7 86.7 83.3 80 86.7 84.6
Table 3 shows the result of the degradation stage identification with various features. As analysed previously, the sensitivity of SLPE to degradation is not very high. Therefore, the identification accuracy of SLPE to various degradation stages is the lowest. The accuracy of TLSE is the best of the four extracted features. However, the total accuracy of SLPE, TLPE, SLSE, and TLSE are close, ranging from 76 % to 80 %. Based on the LPP algorithm, the accuracy of the fused feature is improved to 84.6 %. Limited by the disadvantages, the identification of some stages has not changed so much before or after fusion. The proposed relative entropy fusion algorithm can make full use of the extracted feature information. Consequently, the identification accuracy of the fused feature to each stage and the total accuracy are all the highest. This means that the fused feature can evaluate various degradation stages of hydraulic pumps.
Above all, the comparison results show that the presented LCS algorithm gains the ability to extract more sensitive features. Meanwhile, unlike the traditional feature dimension reduction method, the relative entropy algorithm can make full use of each feature’s information, so that the performance and concision of the fused feature will be both improved.
4 CONCLUSIONS
A novel fusion algorithm for extracting degradation feature is proposed here. Following the application in the degradation experiment, major conclusions are drawn, as follows:
1. LCS method for vibration signals fusion is presented to take advantages of fault information. LCS order power spectral entropy and high-order singular entropy defined in SE and TE are extracted as initial features.
2. The fusion method based on information entropy is proposed to make fusion of the initial features. The concision and performance are both effectively improved.
3. Experimental results showsthat the fused feature performances much better describe the degradation of hydraulic pump effectively.
5 ACKNOWLEDGEMENTS
This project is supported by National Natural Science Foundation of China (Grant No. 51305454). We are grateful to the Luoyang electronic equipment test centre of China for their support to our experiment. Furthermore, sincere appreciation is expressed to all anonymous contributors.
8 REFERENCES
[1] Ahmad, R., Kamaruddin, S. (2012). An overview of time-based and condition-based maintenance in industrial application.
Computers & Industrial Engineering, vol. 63, no. 1, p. 135-149, DOI:10.1016/j.cie.2012.02.002.
[2] Coraddu, A., Oneto, L., Ghio, A., Savio, S., Figari, M., Anguita, D. (2015). Machine learning for wear forecasting of naval assets for condition-based maintenance applications. International Conference on Electrical Systems for Aircraft, Railway, Ship Propulsion and Road Vehicles, p. 1-5, DOI:10.1109/ ESARS.2015.7101499.
[3] Lee, J., Wu, F., Zhao, W., Ghaffari, M., Liao, L., Siegel, D. (2014). Prognostics and health management design for rotary machinery systems-reviews, methodology and applications.
Mechanical Systems and Signal Processing, vol. 45, no. 1-2, p. 314-334, DOI: 10.1016/j.ymssp.2013.06.004.
[4] Dong, S.J., Luo. T.H. (2013). Bearing degradation process prediction based on the PCA and optimized LS-SVM model,
Measurement, vol. 46, no. 9, p. 3143-3152, DOI:10.1016/j. measurement.2013.06.038.
[5] Zhu, X. Zhang, Y., Zhu, Y. (2013). Bearing performance degradation assessment based on the rough support vector data description. Mechanical Systems and Signal Processing, vol. 34, no. 1, p. 203-207, DOI:10.1016/j.ymssp.2012.08.008.
[6] Wang, Y., Kang, S., Jiang, Y., Yang, G., Song, L., Mikulovich, V.I. (2012). Classification of fault location and the degree of performance degradation of a rolling bearing based on an improved hyper-sphere-structured multi-class support vector machine. Mechanical Systems and Signal Processing, vol. 29, p. 404-414, DOI:10.1016/j.ymssp.2011.11.015.
[7] Tran, V.T., Pham, H.T., Bo-Suk Yang, B.-S., Nguyen, T.T. (2012). Machine performance degradation assessment and remaining useful life prediction using proportional hazard model and support vector machine. Mechanical Systems and Signal Processing, vol. 32, p. 320-330, DOI:10.1016/j. ymssp.2012.02.015.
[8] Zhao, S.F., Liang, L., Xu, G.H., Wang, J., Zhang, W.M. (2013). Quantitative diagnosis of a spall-like fault of a rolling element bearing by empirical mode decomposition and the approximate entropy method. Mechanical Systems and Signal Processing, vol. 40, no. 1, p. 154-177, DOI:10.1016/j.ymssp.2013.04.006.
[9] Dong, S.J., Tang, B.P., Chen, R.X. (2013). Bearing running state recognition based on non-extensive wavelet feature scale entropy and support vector machine.
Measurement, vol. 46, no. 10, p. 4189-4199, DOI:10.1016/j. measurement.2013.07.011.
[10] Sun, J., Li, H., Xu, B. (2016). Degradation feature extraction of the hydraulic pump based on high-frequency harmonic local characteristic-scale decomposition sub-signal separation and discrete cosine transform high-order singular entropy.
Advances in Mechanical Engineering, vol. 8, no. 7, p. 1-12,
DOI:10.1177/1687814016659601.
[11] Wang, J.P., Hu, H.T. (2006). Vibration-based fault diagnosis of pump using fuzzy technique. Measurement, vol. 39, no. 2, p. 176-185, DOI:10.1016/j.measurement.2005.07.015.
transform composite spectrum fusion algorithm and its application on hydraulic pumps. Measurement, vol. 94, p. 794-805, DOI:10.1016/j.measurement.2016.09.024.
[13] Du, J., Wang, S.P., Zhang, H.Y. (2013). Layered clustering multi-fault diagnosis for hydraulic piston pump. Mechanical Systems and Signal Processing, vol. 36, no. 2, p. 487-504,
DOI:10.1016/j.ymssp.2012.10.020.
[14] Angelov, P., Yager, R. (2013). Density-based averaging - A new operator for data fusion. Information Science, vol. 222, p. 163-174, DOI:10.1016/j.ins.2012.08.006.
[15] Rodger, J.A. (2012). Toward reducing failure risk in an integrated vehicle health maintenance system: A fuzzy multi-sensor data fusion Kalman filter approach for IVHMS. Expert Systems with Applications, vol. 39, no. 10, p. 9821-9836,
DOI:10.1016/j.eswa.2012.02.171.
[16] Geng, H., Liang, Y., Liu, Y.R., Alsaadi, F.E. (2018). Bias estimation for asynchronous multi-rate multi-sensor fusion with unknown inputs. Information Fusion, vol. 39, no. 1, p. 139-153, DOI:10.1016/j.inffus.2017.03.002.
[17] Wei, C.M., Blum, R.S. (2010). Theoretical analysis of correlation-based quality measures for weighted averaging image fusion. Information Fusion, vol. 11, no. 4, p. 301-309,
DOI:10.1016/j.inffus.2009.10.006.
[18] Yang, W.B., Li, S.Y. (2014). A switch-mode information fusion filter based on ISRUKF for autonomous navigation of spacecraft. Information Fusion, vol. 18, no. 1, p. 33-42,
DOI:10.1016/j.inffus.2013.04.012.
[19] Elbhbah, K., Sinha, J.K. (2013). Vibration-based condition monitoring of rotating machines using a machine composite spectrum. Journal of Sound and Vibration, vol. 332, no. 11, p. 2831-2845, DOI:10.1016/j.jsv.2012.12.024.
[20] Yunusa-Kaltungo, A., Sinha, J.K., Elbhbah, K. (2014). An improved data fusion technique for faults diagnosis in rotating machines. Measurement, vol. 58, no. 1, p. 27-32,
DOI:10.1016/j.measurement.2014.08.017.
[21] Jinde, Z., Junsheng, C., Yu, Y. (2013). A rolling bearing fault diagnosis approach based on LCD and fuzzy entropy.
Mechanism and Machine Theory, vol. 70, no. 1, p. 441-453,
DOI:10.1016/j.mechmachtheory.2013.08.014.
[22] Junsheng, C., Yi, Y., Yu, Y. (2012). Local characteristic-scale decomposition method and its application to gear fault diagnosis. Journal of Mechanical Engineering, vol. 48, no. 9, p. 45-49, DOI:10.3901/JME.2012.09.064.
[23] Zhu, K.H., Song, X.G., Xue, D.X. (2014). A roller bearing fault diagnosis method based on hierarchical entropy and support vector machine with particle swarm optimization algorithm. Measurement, vol. 47, p. 669-675, DOI:10.1016/j. measurement.2013.09.019.
[24] Li, H.J., Xie, X.P. (2015). Gear fault pattern recognition based on kernel feature fuzzy clustering and fuzzy association entropy. Chinese Journal of Scientific Instrument, vol. 36, no. 4, p. 849-854.
[25] Gharavian, M.H. Almas Ganj, F., Ohadi, A.R., Heidari Bafroui, H. (2013). Comparison of FDA-based and PCA based features in fault diagnosis of automobile gearboxes. Neurocomputing, vol. 121, no. 1, p. 150-159, DOI:10.1016/j.neucom.2013.04.033.
[26] Deng, X.G., Tian, X.M. (2013). Sparse kernel locality preserving projection and its application in nonlinear process fault detection. Chinese Journal of Chemical Engineering, vol. 21, no. 2, p. 163-170, DOI:10.1016/S1004-9541(13)60454-1.
[27] Dornaika, F., Assoum, A. (2013). Enhanced and parameterless locality preserving projections for face recognition.
Neurocomputing, vol. 99, no. 1, p. 448-457, DOI:10.1016/j. neucom.2012.07.016.
[28] Krawczak, M., Szkatula, G. (2014). An approach to dimensionality reduction in time series. Information Sciences, vol. 260, no. 1, p. 15-36, DOI:10.1016/j.ins.2013.10.037.
[29] Kristoufek, L. (2014). Measuring correlations between non-stationary series with DCCA coefficient. Physica A: Statistical Mechanics and its Applications, vol. 402, p. 291-298,
DOI:10.1016/j.physa.2014.01.058.
[30] Zarinbal, M., Fazel Zarandi, M.H., Turksen, I.B. (2014). Relative entropy fuzzy c-means clustering. Information Sciences, vol. 260, p. 74-97, DOI:10.1016/j.ins.2013.11.004.
[31] Sun, J., Li, H.R., Xu, B.H. (2016). Degradation feature extraction of the hydraulic pump based on high-frequency harmonic local characteristic-scale decomposition sub-signal separation and discrete cosine transform high-order singular entropy. Advances in Mechanical Engineering, vol. 8, no. 7, p. 1-12, DOI:10.1177/1687814016659601.
[32] Rufeil Fiori, E., Plastino, A. (2013). A Shannon-Tsallis transformation. Physica A: Statistical Mechanics and its Applications, vol. 392, no. 8, p. 1742-1749, DOI:10.1016/j. physa.2012.12.037.
[33] Caraiani, P. (2014). The predictive power of singular value decomposition entropy for stock market dynamics. Physica A: Statistical Mechanics and its Application, vol. 393, p. 571-578, DOI:10.1016/j.physa.2013.08.071.
[34] Zarinbal, M., Fazel Zarandi, M.H., Turksen, I.B. (2014). Relative entropy fuzzy c-means clustering. Information Science, vol. 260, no. 1, p. 74-97, DOI:10.1016/j.ins.2013.11.004.