Vol. 4, No. 5 (2014): 750-760 Research Article
Open Access
I
ISSSSNN::22332200--66881100
In vitro
antioxidant activity of various extracts
and/or fractions of
Erythroxylon monogynum
Rupesh S Kanhere
1*, K. Ravindra Reddy
2and K.N Jayveera
31 Department of Pharmacology, P Ramy Reddy college of Pharmacy. Kadapa, Andhra Pradesh, India. 2 Professor and Principal, CES college of Pharmacy. Karnool, Andhra Pradesh, India.
3 Director, International Science-Tech Research Institute, Anantapur, Andhra Pradesh, India.
* Corresponding author: Rupesh S Kanhere; e-mail: rupeshkanhere@rediffmail.com
ABSTRACT
Free radicals play an important role in the development of tissue damage and pathological events in living organism. There is a compelling evidence indicates that increased consumption of antioxidants from fruits and vegetables reduces the risk of diseases associated with oxidative stress. In our present study aqueous and ethanolic extract of leaves of Erythroxylon monogynum have been evaluated for in vitro antioxidant activity. Among both extract, ethanolic extract showed potent antioxidant activity. Hence this ethanolic extract was further fractionated using various solvent systems (Pet ether – Chloroform - Ethyl acetate – n Butanol) and evaluated for antioxidant potential. DPPH assay, reducing power and H2O2 scavenging assay have been used to evaluate antioxidant
potential. Ascorbic acid was used as reference compound for all the assays. All the analysis was made with the use of UV-Visible spectrophotometer. The results of all assays showed that extracts / fractions of Erythroxylon monogynum leaves possess significant free radical scavenging and reducing power properties. Chloroform fraction separated from crude ethanolic extract was found to possess more superior antioxidant potential among all tested fractions in invitro assays. Hence, it can be concluded that the Erythroxylon monogynum leaves could be pharmacologically exploited for oxidative stress related disorders.
Keywords:
Antioxidant,Erythroxylon monogynum, DPPH, Reducing power assay, H2O2 scavenging.INTRODUCTION
Oxidation is the chemical process by which an atom, molecules or ion robs another of one or more of its electrons. Chemicals exhibiting this tendency for stealing electron are referred to as oxidizing agents. The most familiar oxidizing agent is oxygen itself. Oxidation reactions may involve highly reactive molecules called free radicals. In simple words, free radicals are molecules that have lost an electron and try to replace it by reacting with other molecules. It act as electron acceptors and essentially “steal” electrons from other molecules. Free radicals referred to as oxidizing agents and they tend to cause other molecules to donate their electrons [1].
The most common cellular free radicals are superoxide radical (O2-*), hydroxyl radical (OH*), and nitric oxide
(NO*) [2, 3]. Other molecules, such as hydrogen peroxide (H2O2) and peroxynitrate (ONOO*) are not
free radicals but can lead to their generation through various chemical reactions. Free radicals and related molecules are often classified together as reactive oxygen species (ROS) and reactive nitrogen species (RNS) to signify their ability to promote oxidative changes within the cell [3]. The phenomenon of oxidative modification is called as oxidative stress.
Oxidative stress has been reported to be linked with several diseases like diabetes, atherosclerosis, cancer, and tissue damage in rheumatoid arthritis [4, 5]. Antioxidants are vital substances which possess the ability to protect the body from damage caused by free radical induced oxidative stress [6]. In simple term, Antioxidants are exogenous (natural or synthetic) or endogenous compounds acting in several ways including removal of O2, scavenging reactive
endogenous antioxidant defenses. The protective efficacy of antioxidants depends on the type of ROS that is generated, the place of generation and the severity of the damage [1, 7].
At present most of the antioxidants are manufactured synthetically. They belong to the class of synthetic antioxidants. The main disadvantage with the synthetic antioxidants is the side effects when taken in vivo [8]. A strict governmental rule regarding the safety of the food and drug has necessitated the search for alternatives natural antioxidants [9]. The growing interest in the antioxidant properties of the natural phytochemical from plant source derives from their strong activity and low toxicity compared with those of synthetic phenolics antioxidant such as BHT (butylated hydroxytoluene), BHA (butylated hydroxyanisole), and propyl gallate [10].
Recently, there have been great efforts to find safe and potent natural antioxidants from various plant sources. Plants are the potential source of natural antioxidants. Natural antioxidants or phytochemical antioxidants are the secondary metabolites of plants [11]. Carotenoids, alkaloids, flavonoids, cinnamic acids, benzoic acids, folic acid, ascorbic acid, tocopherols, tocotrienols etc., are some of the antioxidants produced by the plant for their sustenance. Beta-carotene, ascorbic acid and alpha tocopherol are the widely used antioxidants [12].
The plant, Erythroxylon monogynum is reported for presence of various phytochemicals like alkaloids and
flavonoids, 3α-(3′, 4′, 5′-Trimethoxybenzoyloxy) tropane. Due to presence of these phytochemicals, various parts of plants are claimed to have medicinal benefits in various disorders such as diaphoretic, Stomachic, Diuretic and anti-bacterial and curing psoriasis [13, 14].
However, effect of Erythroxylon monogynum or its phytoconstituents have not reported for antioxidant effect. Therefore, the objectives of this study were to evaluate Erythroxylon monogynum as a source of natural antioxidants using different extracting solvents to determine their antioxidant capacities in various
invitro models. Three methods namely DPPH radical assay, reducing power assay and H2O2 scavenging assay
were used to find out and compare antioxidant potential of various extract and fractions of
Erythroxylon monogynum.
MATERIALS AND METHODS
Collection of Plant materialFresh leaves of Erythroxylon monogynum were obtained from local area of Kadapa and authenticated by Botanist; S.V University, Tirupathi, (A.P), India. The specimen voucher of same is kept in department of pharmacology; PRRM College of Pharmacy; Kadapa.
Extraction and fractionation of Plant material
The collected plant material of Erythroxylon monogynum was washed thoroughly in water, and air
dried for two weeks at 35-40° C temperature. The 500 gm of air dried and coarsely powdered material of plants were extracted with two solvents i.e water and 95% of ethanol by cold maceration method for 24 and 72 hrs respectively. Then the extract was filtered with muslin cloth and filtrate was evaporated under reduced pressure and vacuum dried. This yielded a brownish and greenish residue of 25 % and 22% W/W extract respectively with reference to dry starting material. Further alcoholic extract was fractioned with non-polar solvents to polar solvents system (Pet ether – Chloroform - Ethyl acetate – n Butanol).
Aqueous extract (Aq EM), Alcoholic / Ethanolic extract (Et EM), Pet ether fraction (PetE EM), Chloroform fraction (Chl EM), Ethyl acetate fraction (Etace EM) and n-Butanol fraction (nBut EM) were subjected for invitro
antioxidant assay.
Chemicals
1'-Diphenyl-2-picryl-hydrazyl (DPPH) was procured from Sigma-Aldrich. Ascorbic acid, Potassium Ferricyanide, Trichloro acetic acid, Ferric chloride and hydrogen peroxide were obtained from either Fluka Chemicals or Merck Chemicals. All other materials used were analytical grade.
Evaluation of Antioxidant activity by in vitro techniques
DPPH assay (1, 1-diphenyl-2-picrylhydrazyl)
The effect of extracts on DPPH radical was estimated by Elusiyan et al. [15] with minor modification. In brief, 1 mL of DPPH in methanol (0.3 mM) was added to 2.5 ml of various concentrations of extracts and fraction (5 µg/ml – 500 µg/ml). The mixture was vortexed for 15 sec and left to stand at 370C for 30 min. Thirty minutes
later, the absorbance was measured at 517 nm. All determinations were performed in triplicate. Ascorbic acid at various concentrations (5 µg/ml – 500 µg/ml) was used as standard. MeOH (2.5ml) plus DPPH solution was used as control. Lower the absorbance of the reaction mixture indicates higher free radical scavenging activity. The capability to scavenge the DPPH radical was calculated in terms of % inhibition using the following equation.
% Inhibition = [Abs Control – Abs Sample]/Abs Control X 100
IC50 value for reference and all test compounds were
determined by using Graph pad prism analysing tool.
Reducing power assay
Reducing power assay was performed as per Arulpriya et.al [16]. Various concentrations (5 µg/ml – 500 µg/ml) of the plant extracts and fractions in 1.0 ml of de-ionized water were mixed with phosphate buffer (0.2 M, pH 6.6) (2.5 ml) and 1% w/v potassium ferricyanide (2.5 ml) and incubated at 500C for 20 min.
solution (2.5 ml) was mixed with distilled water (2.5 ml) and a freshly prepared 0.1% ferric chloride solution (0.5 ml). The absorbance was measured at 700 nm. A control was prepared without adding extract. Ascorbic acid at various concentrations (5 µg/ml – 500 µg/ml) was used as standard. All determinations were performed in triplicate. Increased absorbance of the reaction mixture indicates increase in reducing power.
A sample
% increase in Reducing Power = - 1 X 100 A Control
Where Asample is absorbance of test solution; A control is
absorbance of Control.
Hydrogen Peroxide Scavenging Capacity
The ability of the Erythroxylon monogynum extracts and fractions to scavenge hydrogen peroxide was determined according to the method of Reddy et al [17]. A solution of hydrogen peroxide (40 mM) was prepared in phosphate buffer (pH 7.4). Various concentrations (5 µg/ml – 500 µg/ml) of the plant extracts in distilled water were added to a hydrogen peroxide solution (0.6 mL, 40mM). Absorbance of hydrogen peroxide at 230 nm was determined 10 minutes later against a blank solution containing the phosphate buffer without hydrogen peroxide. Ascorbic acid at various concentrations (5 µg/ml – 500 µg/ml) was used as standard. All determination was performed in triplicate.
The percentage of H2O2 scavenging by samples and
standard compound was calculated using the following formula:
% Scavenged [H2O2] = [(AC – AS)/AC] x 100
Where AC is the absorbance of the control and AS is the
absorbance in the presence of the sample.
Statistical Analysis
All data are presented as means ± SD for at least three replications for each prepared sample. % Coefficient of variant (CV) for each assay is represented in order to express the precision and repeatability of test results. % CV less than 15 are accepted. Statistical analysis, plots, linear regression fits were carried using Graph Pad Prism 5.01.
RESULTS AND DISCUSSION
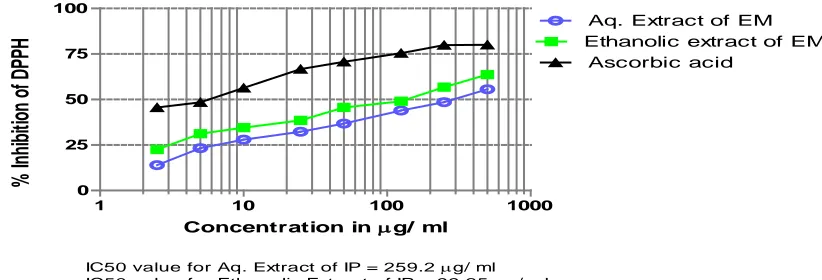
DPPH assayDPPH has been widely used to evaluate the free radical scavenging effectiveness of various antioxidant substances. The DPPH radical-scavenging capacity was reported after 30 min reaction time for all samples evaluated. The parameter used to measure the radical scavenging activity of extracts and fractions evaluated is IC50 value, defined as the concentration of antioxidant
required for 50% scavenging of DPPH radicals in this specified time period. The smaller IC50 value represents
the higher antioxidant activity of the plant extract/fraction. The IC50 value of various plant
extracts/fractions and positive controls were shown in Tables 1 and 2 as well as Figures 1 and 2.
Among both tested extract of Erythroxylon monogynum, ethanolic extract was found to be more active. IC50
value for DPPH scavenging for the aqueous and ethanolic extract was found to be 259.2 and 99.25 µg/ml, while IC50 for the reference compound was
found to be 4.46 µg/ml.
When ethanolic extract of Erythroxylon monogynum
was further fractionated, only chloroform fraction (IC 50 = 105.8 µg/ml) and pet ether fraction (IC 50 = 117.7
µg/ml) was found with comparable scavenging activity as ethanolic extract. Other fractions like ethyl acetate (IC 50 = 221.4 µg/ml) and n- butanol fraction (IC 50 =
419.9 µg/ml) were found to have low DPPH scavenging activity.
1 10 100 1000
0 25 50 75 100
Aq. Extract of EM Ethanolic extract of EM
Ascorbic acid
IC50 value for Aq. Extract of IP = 259.2µg/ ml
IC50 value for Ethanolic Extract of IP = 99.25µg/ ml
IC50 value for Ascorbic Acid = 4.46 µg/ ml
%
Inhi
bi
tion of
D
PP
H
Result of DPPH Assay Aq. Extract Vs Et. Extract of Exythroxylon Monogynum
Concentration inµg/ ml
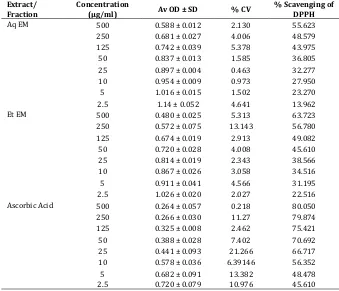
Table 1. Scavenging activity on 2,2-diphenyl-1-picrylhidrazyl (DPPH) radical (Aqueous Extract (Aq EM) Vs Ethanolic extract (Et EM)
Extract/
Fraction Concentration (µg/ml) Av OD ± SD % CV % Scavenging of DPPH
Aq EM 500 0.588 ± 0.012 2.130 55.623 250 0.681 ± 0.027 4.006 48.579 125 0.742 ± 0.039 5.378 43.975 50 0.837 ± 0.013 1.585 36.805 25 0.897 ± 0.004 0.463 32.277 10 0.954 ± 0.009 0.973 27.950 5 1.016 ± 0.015 1.502 23.270 2.5 1.14 ± 0.052 4.641 13.962 Et EM 500 0.480 ± 0.025 5.313 63.723 250 0.572 ± 0.075 13.143 56.780 125 0.674 ± 0.019 2.913 49.082 50 0.720 ± 0.028 4.008 45.610 25 0.814 ± 0.019 2.343 38.566 10 0.867 ± 0.026 3.058 34.516 5 0.911 ± 0.041 4.566 31.195 2.5 1.026 ± 0.020 2.027 22.516 Ascorbic Acid 500 0.264 ± 0.057 0.218 80.050 250 0.266 ± 0.030 11.27 79.874 125 0.325 ± 0.008 2.462 75.421 50 0.388 ± 0.028 7.402 70.692 25 0.441 ± 0.093 21.266 66.717 10 0.578 ± 0.036 6.39146 56.352 5 0.682 ± 0.091 13.382 48.478 2.5 0.720 ± 0.079 10.976 45.610
1 10 100 1000
0 25 50 75 100
PetE fraction of EM Chl fraction of EM
Et Ace. fraction of EM
IC50 value for Pet ether fraction of EM = 117.7µg/ ml IC50 value for Chloroform fraction of EM = 105.8µg/ ml IC50 value for Ethyl acetate fraction of EM = 221.4µg/ ml IC50 value for n-Butenol fraction of EM = 419.9µg/ ml IC50 value for Ascorbic Acid = 5.22µg/ ml
%
I
nhi
bi
ti
on of
D
P
P
H
Result of DPPH Assay: Various fractions of Erythroxylon monogynum
Ascorbic acid n-But fraction of EM
Concentration inµg/ ml
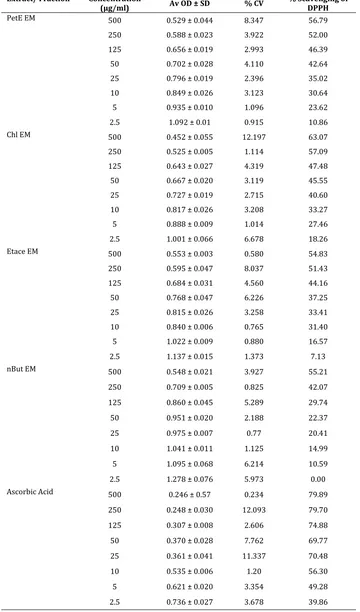
Table 2. Scavenging activity on 2,2-diphenyl-1-picrylhidrazyl (DPPH) radical (Various Fractions of Ethanolic extract and positive control)
Extract/ Fraction Concentration
(µg/ml) Av OD ± SD % CV % Scavenging of DPPH
PetE EM 500 0.529 ± 0.044 8.347 56.79 250 0.588 ± 0.023 3.922 52.00 125 0.656 ± 0.019 2.993 46.39 50 0.702 ± 0.028 4.110 42.64 25 0.796 ± 0.019 2.396 35.02 10 0.849 ± 0.026 3.123 30.64 5 0.935 ± 0.010 1.096 23.62 2.5 1.092 ± 0.01 0.915 10.86 Chl EM 500 0.452 ± 0.055 12.197 63.07 250 0.525 ± 0.005 1.114 57.09 125 0.643 ± 0.027 4.319 47.48 50 0.667 ± 0.020 3.119 45.55 25 0.727 ± 0.019 2.715 40.60 10 0.817 ± 0.026 3.208 33.27 5 0.888 ± 0.009 1.014 27.46 2.5 1.001 ± 0.066 6.678 18.26 Etace EM 500 0.553 ± 0.003 0.580 54.83 250 0.595 ± 0.047 8.037 51.43 125 0.684 ± 0.031 4.560 44.16 50 0.768 ± 0.047 6.226 37.25 25 0.815 ± 0.026 3.258 33.41 10 0.840 ± 0.006 0.765 31.40 5 1.022 ± 0.009 0.880 16.57 2.5 1.137 ± 0.015 1.373 7.13 nBut EM 500 0.548 ± 0.021 3.927 55.21
250 0.709 ± 0.005 0.825 42.07 125 0.860 ± 0.045 5.289 29.74 50 0.951 ± 0.020 2.188 22.37 25 0.975 ± 0.007 0.77 20.41 10 1.041 ± 0.011 1.125 14.99 5 1.095 ± 0.068 6.214 10.59 2.5 1.278 ± 0.076 5.973 0.00 Ascorbic Acid 500 0.246 ± 0.57 0.234 79.89
250 0.248 ± 0.030 12.093 79.70 125 0.307 ± 0.008 2.606 74.88 50 0.370 ± 0.028 7.762 69.77 25 0.361 ± 0.041 11.337 70.48 10 0.535 ± 0.006 1.20 56.30 5 0.621 ± 0.020 3.354 49.28 2.5 0.736 ± 0.027 3.678 39.86
Reducing Power assay
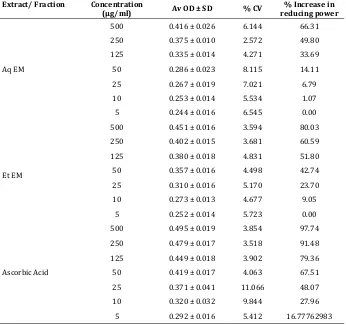
The reducing power is based on ability of the sample to reduce ferric cyanide to ferro cyanide. The formation of Fe 2+ ions is measured at 700 nm. A higher absorbance at 700nm indicates a higher reducing power. The
extract showed reducing power of 66.31 % while ethnanolic extract showed reducing power of 80.02 %. It clearly indicates high antioxidant potential of ethanolic extract. Among all fractions, reducing power of chloroform fraction and n-butanolic fraction of
Erythroxylon monogynum were found to be with similar reducing power as ethanolic extract. Other fraction like ethyl acetate fraction and Pet ether fraction of
Erythroxylon monogynum were found with poor reducing power. At 500 µg/ml concentration, the relative reducing power of the fractions of Erythroxylon monogynum was as follows Chl EM > nBut EM > Etace EM > PetE EM. Ascorbic acid was used as reference compound, showed reducing power (at 500 µg/ml) of 97 – 98 % in both set experiments.
Table 3. Reducing power capacity of Aqueous Extract and Ethanolic extract of Erythroxylon monogynum
Extract/ Fraction Concentration
(µg/ml) Av OD ± SD % CV reducing power % Increase in
Aq EM
500 0.416 ± 0.026 6.144 66.31 250 0.375 ± 0.010 2.572 49.80 125 0.335 ± 0.014 4.271 33.69 50 0.286 ± 0.023 8.115 14.11 25 0.267 ± 0.019 7.021 6.79 10 0.253 ± 0.014 5.534 1.07 5 0.244 ± 0.016 6.545 0.00
Et EM
500 0.451 ± 0.016 3.594 80.03 250 0.402 ± 0.015 3.681 60.59 125 0.380 ± 0.018 4.831 51.80 50 0.357 ± 0.016 4.498 42.74 25 0.310 ± 0.016 5.170 23.70 10 0.273 ± 0.013 4.677 9.05
5 0.252 ± 0.014 5.723 0.00
Ascorbic Acid
500 0.495 ± 0.019 3.854 97.74 250 0.479 ± 0.017 3.518 91.48 125 0.449 ± 0.018 3.902 79.36 50 0.419 ± 0.017 4.063 67.51 25 0.371 ± 0.041 11.066 48.07 10 0.320 ± 0.032 9.844 27.96
5 0.292 ± 0.016 5.412 16.77762983
Result of Reducing power assay: Aq Extract vs Ethanolic extract of Erythroxylon Monogynum.
Aq EM Et EM Ascorbic Acid
0 20 40 60 80 100
500 250 100 50 25 10 5
Concentration inµg/ ml
%
I
nc
re
a
s
e
i
n R
e
duc
ing P
ow
e
r
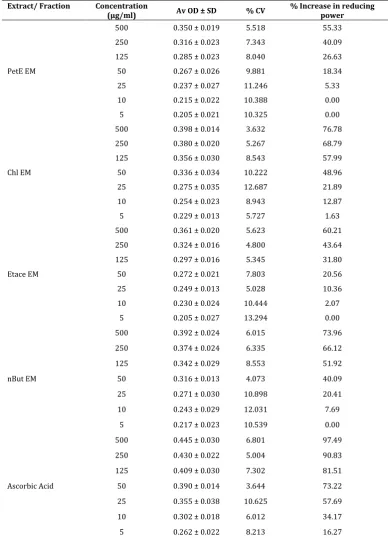
Table 4. Reducing power capacity of Various Fractions of Erythroxylon monogynum and positive control.
Extract/ Fraction Concentration
(µg/ml) Av OD ± SD % CV % Increase in reducing power
PetE EM
500 0.350 ± 0.019 5.518 55.33 250 0.316 ± 0.023 7.343 40.09 125 0.285 ± 0.023 8.040 26.63 50 0.267 ± 0.026 9.881 18.34 25 0.237 ± 0.027 11.246 5.33 10 0.215 ± 0.022 10.388 0.00 5 0.205 ± 0.021 10.325 0.00
Chl EM
500 0.398 ± 0.014 3.632 76.78 250 0.380 ± 0.020 5.267 68.79 125 0.356 ± 0.030 8.543 57.99 50 0.336 ± 0.034 10.222 48.96 25 0.275 ± 0.035 12.687 21.89 10 0.254 ± 0.023 8.943 12.87 5 0.229 ± 0.013 5.727 1.63
Etace EM
500 0.361 ± 0.020 5.623 60.21 250 0.324 ± 0.016 4.800 43.64 125 0.297 ± 0.016 5.345 31.80 50 0.272 ± 0.021 7.803 20.56 25 0.249 ± 0.013 5.028 10.36 10 0.230 ± 0.024 10.444 2.07
5 0.205 ± 0.027 13.294 0.00
nBut EM
500 0.392 ± 0.024 6.015 73.96 250 0.374 ± 0.024 6.335 66.12 125 0.342 ± 0.029 8.553 51.92 50 0.316 ± 0.013 4.073 40.09 25 0.271 ± 0.030 10.898 20.41 10 0.243 ± 0.029 12.031 7.69
5 0.217 ± 0.023 10.539 0.00
Ascorbic Acid
500 0.445 ± 0.030 6.801 97.49 250 0.430 ± 0.022 5.004 90.83 125 0.409 ± 0.030 7.302 81.51 50 0.390 ± 0.014 3.644 73.22 25 0.355 ± 0.038 10.625 57.69 10 0.302 ± 0.018 6.012 34.17 5 0.262 ± 0.022 8.213 16.27
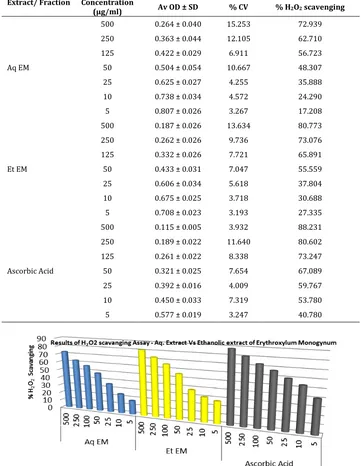
Hydrogen Peroxide Scavenging Capacity
The compound having antioxidant potential will cause the oxidation of hydrogen peroxide, which will result in to reduction of the absorbance of hydrogen peroxide at 230 nm. The results were represented in % H2O2
scavenging capacity and showed in Table 5, 6 as well as figure 5, 6.
Percentage H2O2 scavenging capacity of aqueous
extract, ethanolic extract and ascorbic acid at 500 µg/ml was found to be 72.93 %, 80.77 % and 88.23 % respectively.
Ethanolic extract of Erythroxylon monogynum was further fractionated and tested for H2O2 scavenging
capacity. Only chloroform fraction was found with superior scavenging activity than ethanolic extract. Other fractions like n butanol, pet ether and ethyl acetate fraction were found comparable H2O2 scavenging activity. Percentage H2O2 scavenging
Re sult of Re ducing powe r assay: All fractions of Erythroxylon monogynum
500 250 100 50 25 10 5
0 25 50 75 100
PetE fraction of EM Chl fraction of EM Et Ace. fraction of EM n-But fraction of EM Ascorbic acid
Concentration inµg/ ml
%
I
nc
re
a
s
e
i
n R
e
duc
ing P
ow
e
r
Figure 4. Reducing power capacity of Various Fractions of Erythroxylon monogynum and positive control.
Table 5. % H2O2 scavenging capacity of Aqueous Extract and Ethanolic extract of Erythroxylon monogynum
Extract/ Fraction Concentration
(µg/ml) Av OD ± SD % CV % H2O2 scavenging
Aq EM
500 0.264 ± 0.040 15.253 72.939 250 0.363 ± 0.044 12.105 62.710 125 0.422 ± 0.029 6.911 56.723 50 0.504 ± 0.054 10.667 48.307 25 0.625 ± 0.027 4.255 35.888 10 0.738 ± 0.034 4.572 24.290 5 0.807 ± 0.026 3.267 17.208
Et EM
500 0.187 ± 0.026 13.634 80.773 250 0.262 ± 0.026 9.736 73.076 125 0.332 ± 0.026 7.721 65.891 50 0.433 ± 0.031 7.047 55.559 25 0.606 ± 0.034 5.618 37.804 10 0.675 ± 0.025 3.718 30.688 5 0.708 ± 0.023 3.193 27.335
Ascorbic Acid
500 0.115 ± 0.005 3.932 88.231 250 0.189 ± 0.022 11.640 80.602 125 0.261 ± 0.022 8.338 73.247 50 0.321 ± 0.025 7.654 67.089 25 0.392 ± 0.016 4.009 59.767 10 0.450 ± 0.033 7.319 53.780 5 0.577 ± 0.019 3.247 40.780
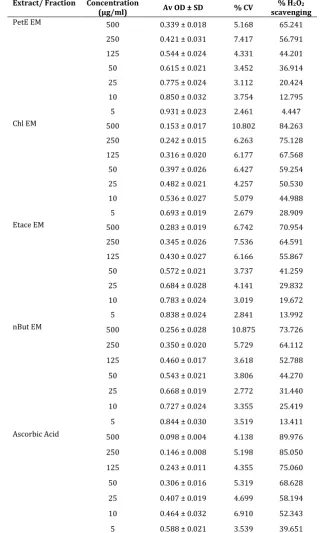
Table 6. % H2O2 scavenging capacity of Various Fractions of Erythroxylon monogynum and positive control.
Extract/ Fraction Concentration
(µg/ml) Av OD ± SD % CV scavenging % H2O2
PetE EM 500 0.339 ± 0.018 5.168 65.241 250 0.421 ± 0.031 7.417 56.791 125 0.544 ± 0.024 4.331 44.201 50 0.615 ± 0.021 3.452 36.914 25 0.775 ± 0.024 3.112 20.424 10 0.850 ± 0.032 3.754 12.795 5 0.931 ± 0.023 2.461 4.447 Chl EM 500 0.153 ± 0.017 10.802 84.263
250 0.242 ± 0.015 6.263 75.128 125 0.316 ± 0.020 6.177 67.568 50 0.397 ± 0.026 6.427 59.254 25 0.482 ± 0.021 4.257 50.530 10 0.536 ± 0.027 5.079 44.988 5 0.693 ± 0.019 2.679 28.909 Etace EM 500 0.283 ± 0.019 6.742 70.954 250 0.345 ± 0.026 7.536 64.591 125 0.430 ± 0.027 6.166 55.867 50 0.572 ± 0.021 3.737 41.259 25 0.684 ± 0.028 4.141 29.832 10 0.783 ± 0.024 3.019 19.672 5 0.838 ± 0.024 2.841 13.992 nBut EM 500 0.256 ± 0.028 10.875 73.726
250 0.350 ± 0.020 5.729 64.112 125 0.460 ± 0.017 3.618 52.788 50 0.543 ± 0.021 3.806 44.270 25 0.668 ± 0.019 2.772 31.440 10 0.727 ± 0.024 3.355 25.419 5 0.844 ± 0.030 3.519 13.411 Ascorbic Acid 500 0.098 ± 0.004 4.138 89.976
250 0.146 ± 0.008 5.198 85.050 125 0.243 ± 0.011 4.355 75.060 50 0.306 ± 0.016 5.319 68.628 25 0.407 ± 0.019 4.699 58.194 10 0.464 ± 0.032 6.910 52.343 5 0.588 ± 0.021 3.539 39.651
Discussion
Free radicals play an important role in the development of tissue damage and pathological events in living organism. The free radicals are released due to the oxidative stress which causes the various diseases like CNS disorders, cardiovascular disease, diabetes and obesity. There is a compelling evidence indicates that increased consumption of antioxidants from fruits and vegetables reduces the risk of diseases associated with oxidative stress [18,19] and may contribute to improvement in quality of life by delaying the onset of
various diseases. Ever growing research in herbal drugs from Indian system of medicine suggests that beneficial effect herbs or its phytoconstitiuents as antioxidants in
in vitro and in vivo. The present results demonstrate that crude extract and its various fractions separated from ethanolic extract of Erythroxylon monogynum
possess free radical scavenging and antioxidant capacity tested in in vitro. Free radical scavenging capacity of extracts and various fractions were investigated by DPPH, reducing power assay and H2O2
capacity of the alcoholic and aqueous demonstrates effect polyvalent phytophore and its scavenging capacity in in vitro assays. Interestingly, ethanolic extract of Erythroxylon monogynum showed high capacity to scavenge various radical than its aqueous
extract. This finding direct us to fractionate alcoholic extract using various solvents and analyze the free radical capacity assays.
The results from reducing power assay shows that fractions separated by chloroform as well as by n -butanol form crude ethanolic extract have superior antioxidant potency and thus contain free radical quenching compounds, which act as primary radical scavengers that react with ferric cyanide in reducing
power assay. Similarly in H2O2 scavenging assay,
chloroform fraction was found with greater antioxidant activity indicating presence of compounds responsible for H2O2 scavenging by electron donating ability. This
explains the capacity of the compounds present in various fractions towards various in vitro free radical assays [20]. The results of these assays have direct correlation with the results obtained from DPPH assay as reflected in the ability to show efficient quenching of DPPH*. Interestingly, In DPPH assay, along with chloroform fraction, pet ether fraction was also found with less IC50 value indicates presence of more potent
compounds with antioxidant property. In all the assays Chloroform fraction consistently showed enhanced antioxidant activity.
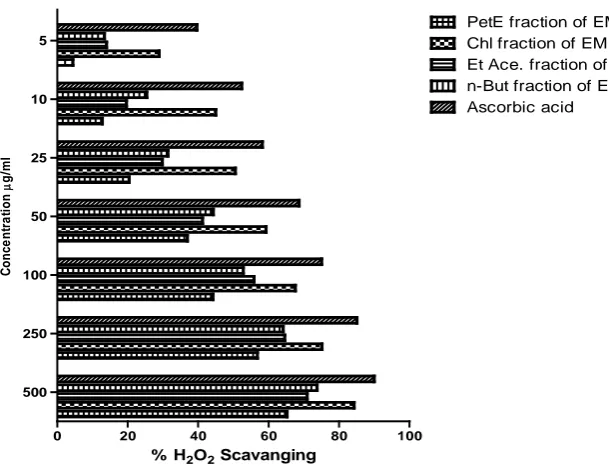
Result of H2O2 Scavanging assay: All fractions of Erythroxylon monogynum
0 20 40 60 80 100
500 250 100 50 25 10 5
PetE fraction of EM Chl fraction of EM Et Ace. fraction of EM n-But fraction of EM Ascorbic acid
% H2O2 Scavanging
C
onc
e
nt
ra
ti
on
µ
g/
m
l
Figure 6. % H2O2 scavenging capacity of Various Fractions of Erythroxylon monogynum and positive control.
CONCLUSION
Results indicate the free radical scavenging potential of aqueous and ethanolic extract of Erythroxylon monogynum. Chloroform fraction separated from crude ethanolic extract was found to possess more superior antioxidant potential among all tested fraction in
invitro assays.
REFERENCES
1. Halliwell B. (1997). Antioxidants: the basics - what they are and how to evaluate them. Advances in Pharmacology.38: 3-20
2. Jenner P., Olnaw C.W. (1996). Oxidative stress and the pathogenesis of Parkinson’s disease. Neurology. 47: S161-S176.
3. Simonian N.A., Coyle J.T. (1996). Oxidative stress in neurodegenerative diseases. Annual Review of Pharmacology and Toxicology. 36, 83-106.
4. McDonald S., Prenzler P.D., Antolovich M. and Robards K. (2001). Phenolic content and antioxidant activity of olive extracts. Food Chemistry. 73: 73 – 84.
5. Jang, H.D, Chang K.S., Huang YS., Hsu C.L., Lee S.H. and Su MS. (2007). Principal phenolic phytochemicals and antioxidant
activities of three Chinese medicinal plants. Food Chemistry. 103: 749–756.
6. Ozsoy N., Can A., Yanardag R. and Akev N. (2008). Antioxidant activity of Smilax excelsa L. leaf extracts. Food Chemistry. 110: 571–583.
7. Halliwell, B. (1994). Free radicals, antioxidants, and human disease: curiosity, cause or consequence? The Lancet. 344, 721-724.
8. Chen C., Pearson A. M., & Gray J. I. (1992). Effects of synthetic antioxidants (BHA, BHT and PG) on the mutagenicity of IQ-like compounds. Food Chemistry. 43, 177-183.
9. Yingming P., Ping L., Hengshan W. & Min L. (2004). Antioxidant activities of several chinese medicinal herbs. Food Chemistry. 88, 347-350
10. Caillet S., Salmieri S., and Lacroix, M. (2006). Evaluation of free radical-scavenging properties of commercial grape phenol extracts by a fast colorimetris method. Food Chemistry. 95: 1-6.
11. Walton N. J. & Brown D. E. (1999). Chemicals from plants: Perspectives on plant secondary products. London: Imperial College press.
12. Mccall M. R. & Frei, B. (1999). Can antioxidant vitamins materially reduce oxidative damage in humans?. Free radical Biology and Medicine. 26: 1034-1053.
14. Madhava Chetty K, Sivaji K and Tulasi Rao K. (2008) Flowering plants of Chittoor District of Andhra Pradesh. 1st edition,158.
15. Elusiyan CA, Ani NC, Adewunmi CO and OlugbadeTA. (2011). Distribution of Iridiod glucosides and anti- oxidant compounds in Spathodea Campanulata parts. Afr J Tradit Complement Altern Med. 8 (1):27-33
16. Arulpriya P, Lalitha P., and Hemalatha S. (2010). In vitro antioxidant testing of the extracts of Samanea saman (Jacq.)Merr . Der Chemica Sinica. 1 (2):73-79
17. Reddy Y, Jayaveera KN, Kumar GS, Govindarajulu YM and Aruma Kumari K. (2012). Phytochemical and Antioxidant Activities of Different Solvent Extracts of Plant Aerva Tomentosa. Journal of Pharmacy and Chemistry. Vol.6 Issue.4 24-32.
18. Meydani M., Lipman R.D., Han S.N. (1998). The effect of long-term dietary supplementation with antioxidants. Annals of New York Academy of Science, 854, 352-360.
19. Defeng Wu and Arthur Cederbaum. (2003). Alcohol, Oxidative Stress, and Free Radical Damage. Alcohol Research & Health. Vol. 27, No. 4.
20. Huang D., Ou B., Prior R.L.(2005). The chemistry behind Antioxidant capacity Assays. Journal of Agricultural and Food Chemistry. 53, 1841-1856.
*****
© 2014; AIZEON Publishers; All Rights Reserved