68
ISSN: 2250 – 2688Received: 28/08/2016 Revised: 08/09/2016 Accepted: 14/09/2016
Neelkant Prasad, Roshan Issarani, Badri Prakash Nagori
Department of Pharmaceutics, Pharmacy Wing, Lachoo Memorial College of Science and Technology, Sector- A, Shastri Nagar, Jodhpur, Rajasthan, India- 342003
Amar Deep Singh Dr. K. N. Modi Institute of Pharmaceutical Education and Research,
Modinagar, U. P., India- 201204
Correspondence Neelkant Prasad
Department of Pharmaceutics, Pharmacy Wing, Lachoo Memorial College of Science and Technology, Sector- A, Shastri Nagar, Jodhpur, Rajasthan, India- 342003
E mail: [email protected]
Development and Validation of UV Spectrophotometric Method
for Detection of Glibenclamide during Dissolution in Alkaline
Borate Buffer pH 9.5
Neelkant Prasad, Roshan Issarani, Badri Prakash Nagori and Amar Deep
Singh
ABSTRACT
This article describes the development of UV spectrophotometric method for detection of glibenclamide during its dissolution in alkaline borate buffer pH 9.5 because no official UV spectrophotometric method is described for this drug and no such method has been developed for estimating the drug in this medium. A stock solution of 20 g/ml was prepared. Various aliquots of the stock solution were transferred to a series of 10 ml capacity volumetric flasks so as to prepare various dilutions between the ranges of 2-12 g/ml. To each dilution 0.1 ml of concentrated hydrochloric acid was added and a calibration curve was formed at 229.5 nm between absorbance on Y- axis and concentration on X- axis. The linearity range was found to be between 2.0 to 12.0 g/ml. The limit of detection (LOD) and limit of quantification (LOQ) were found to be 0.23 g/ml and 0.71 g/ml respectively. The repeatability, interday and intraday precision (measured in terms of percent relative standard deviation, %RSD) was always less than 0.94%. The accuracy of the developed method were measured by recovery studies and was found to be between 100.39%±1.03% and 102.94%±1.46%. Thus, the developed method is specific, accurate and precise as validated according to recommendations by ICH guidelines.
Key Words: Alkaline borate buffer, Dissolution, Glibenclamide, pH, UV spectrophotometric
.
1. INTRODUCTION
Glibenclamide (1-{4-[2-(5-chloro-2-methoxybenzamido)ethyl}benzenesulphonyl}-3-cyclohexyl
urea), also known as glyburide, is an antidiabetic drug belonging to sulfonylurea class, used in the treatment of type II diabetes mellitus.1, 2 This drug is highly water insoluble, slightly soluble in alcohol and is soluble in dilute solutions of alkali hydroxides.3 The dissolution medium for the micronized drug, recommended by USFDA, is 0.05 M alkaline borate buffer pH 9.5 for non-micronized drug and 0.05 M phosphate buffer pH 7.5 for non-micronized drug.4 Literature data report several methods for determination of Glibenclamide during dissolution like HPLC5, UV-Visible spectrophotometry6, derivative UV spectrophotometry7 using phosphate buffer pH7.4 and estimating the samples at about 228 nm, but no UV method is reported for sample estimation from dissolution of glibenclamide in alkaline borate buffer pH 9.5. HPLC separations with UV detection and simple UV spectrophotometric detection are usually not suitable for detection of the drug during dissolution because the absorption of the samples, at various time intervals, of dissolution of single dose of glibenclamide is too small (less than 0.100) at its reported wavelength of maximum absorbance (max) i.e. 300nm to consider its linear relation with the concentration
(Lambert-Beer law).8 Our study reveals that glibenclamide shows two absorption maxima in phosphate buffer pH 7.4 one at 300 nm wavelength of very low absorption intensity and other of relatively high absorption intensity at 229.5 nm wavelength. But in alkaline borate buffer pH 9.5 it shows only absorption maximum at 300 nm wavelength that is not detectable at low concentrations and do not show the absorption maximum at 229.5 nm.
69
During further studies, it has been found that on addition of 0.1 ml concentrated hydrochloric acid to 10 ml solution of glibenclamide in alkaline borate buffer pH 9.5, the drug shows another absorption maximum of high intensity at 229.5 nm wavelength at which absorption shows a linear relationship with concentration. Addition of a lesser volume or concentration of hydrochloric acid leads to non-linear relationship possibly due to shortage of hydrochloric acid for completing the reaction with glibenclamide molecules present in the solutions.2. MATERIALS AND METHODS
2.1 Drug and chemicals used
Glibenclamide was a gift sample from Sun Pharmaceuticals Limited, Silvassa, India. All other chemicals and reagents were procured from CDH, New Delhi and were of analytical reagent grade.
2.2 Preparation of stock solution
A stock solution of 20 g/ml was prepared. 50 mg of glibenclamide was accurately weighed and transferred to a 50 ml capacity volumetric flask. The drug was then dissolved in ethanol and the final volume was made up to the mark. 2.0 ml of this solution was then transferred to a 100 ml capacity volumetric flask and final volume was made up to the mark with alkaline borate buffer pH 9.5.
2.3 Preparation of blank solution
A blank solution was prepared similarly as the stock solution avoiding the drug substance in the solution.
2.4 Preparation of the calibration curve
Various dilutions were prepared between the range 2
g/ml and 12 g/ml (final volume 10 ml) at an interval of 2 g/ml from the stock solution. To each dilution 0.1 ml of concentrated hydrochloric acid was added. Addition of this specified amount of hydrochloric acid to dilutions more than 12 g/ml lead to come out of glibenclamide from the solution possibly due to its limited solubility at such a low pH attained by the solution after addition of concentrated hydrochloric acid because glibenclamide is reported to be dissolved in dilute alkali solutions. The concentrated hydrochloric acid was also added to the blank solution in the similar ratio. The three out of these dilutions were scanned against the appropriate blank to determine the max of the solution and was
found to be 229.5 nm. The standard curve was then prepared by plotting absorbance versus concentration plot against the prepared blank solution at 229.5 nm.
2.5 Validation
The method was validated according to recommendations of ICH guidelines Q2 (R1), 2005.9
2.6 Specificity
Glibenclamide solutions (4.8, 6 and 7.2 g/ml) were prepared separately in the selected medium with and without common excipients i.e. magnesium stearate, starch and microcrystalline cellulose, and 0.1 ml concentrated hydrochloric acid was added. All the solutions were scanned between 400 nm to 200 nm and checked for any change in absorbance at wavelength of detection i.e. 229.5 nm.
2.7 Linearity
The linearity of the calibration curves prepared was determined using linear regression analysis.
2.8 Precision
Repeatability was determined by analyzing different levels of drug concentrations from independent stock solutions (n=6). Intraday and interday variations in estimation were determined to assess intermediate precision of the proposed method. Different levels 80%, 100% and 120% of drug concentrations in six replicates were analyzed three times in a day for intraday variation. The same method was followed for three different days to study interday variation. The precision was determined as percent relative standard deviation.
2.9 Accuracy
The accuracy studies were performed at three levels i.e. 80%, 100% and 120% by adding known amounts of the drug to a known concentration of the standard and analyzing the drug content (standard addition method).
2.10 Limit of detection and limit of quantification
The limit of detection (LOD) and limit of quantification (LOQ) of the drugs by proposed method were determined using calibration standards. The LOD and LOQ were calculated as per equations 1 and 2 respectively, (ICH Guidelines Q2 (R1), 2005).
3.3
SD
InterceptLOD
Slope
---1int
10
SD
erceptLOQ
Slope
70
where “SDintercept” is standard deviation of the intercept ofregression line and “Slope” is the slope of calibration curve.
2.11 Robustness
For evaluation of the method robustness, some parameters were deliberately changed like reagent (hydrochloric acid) amount.
3. RESULTS AND DISCUSSION
The spectrophotometric determination of glibenclamide was studied using UV spectrophotometer (Pharmspec UV 1800, Shimadzu Japan).
The UV absorption spectrum of glibenclamide in the selected medium showed a maximum at 300 nm (Figure 1) and after addition of the specified amount of concentrated hydrochloric acid it showed a very prominent absorption maximum at 229.5 nm and leaving the other one at 300 nm in the original spectrum as such (Figure 1). In presence of hydrochloric acid and water glibenclamide undergoes degradation to a major degradation
product,5-chloro-2-methoxy-N-2- (4-sulfamoylphenyl) ethyl]
benzamide (I), and to a minor product, 1-cyclohexyl-3-[[4-(2-aminoethyl)-phenyl]sulfonyl]urea (II) and the maxima at 229.5 nm was due to the product (I).10 The calibration curve was prepared at 229.5 nm.
Optimum experimental conditions: The optimization was carefully studied to achieve complete reaction, highest sensitivity and maximum absorbance. The reaction conditions were found through preliminary experiments studying the conditions such as temperature, volume and concentration of hydrochloric acid. 0.1 ml of concentrated hydrochloric acid was found suitable for the reaction and the lower amounts and the diluted acid was found insufficient for completing the reaction. Room temperature was found sufficient. The most important is that all this reaction is zero time consuming and the solutions can be quantitate immediately after addition of concentrated hydrochloric acid to the dilutions.
The calibration curve was prepared at 229.5 nm and is shown in Figure 2, and various regression parameters are given in Table No. 1.
The Beer’s law was obeyed and validated from 2-12 µg/ml. For concentration more than 12 g/ml, on addition of the specified amount of the concentrate hydrochloric acid the drug was precipitated out from the solution possibly due to the limited solubility of glibenclamide in acidic conditions (pH). The linear
regression equation was found to be A=0.034C+0.007 (r=0.999, n=6) (Table No. 1), where A is the absorbance, and C is the concentration in µg/ml, A is the absorbance and r is the correlation coefficient.
The validity of the method for specificity, repeatability, precision and accuracy according to recommendations were tested (ICH Guidelines Q2 (R1), 2005). The results are presented in Table No. 2-6.
Figure 1: Overlain spectra of glibenclamide in alkaline borate buffer pH 9.5 before and after addition of concentrated hydrochloric acid
71
Table No. 1: Regression parameters for calibration curve of glibenclamide
No. Parameter Value
1 Analytical wavelengths (nm) 229.5
2 Linearity range (g/ml) 02-12
3 Regression equation (A = aC+b)a
Slope (a) Intercept (b)
A=0.034C+0.007 0.034
0.007
4 SD of intercept (n = 6) 2.40×10⁻³
5 Correlation coefficient 0.999
aA= Absorbance and C= Concentration
Table No. 2: Specificity studies for the developed analytical method for glibenclamide
Concentration taken (µg/ml)
Absorbance* for Absorbance difference
(Ac-At)
%Absorbance difference (w. r. t. Ac)
Solution of pure drug (Ac)
Solution of drug and excipients (At)
4.8 0.172±0.001 0.173±0.002 -0.001 0.58
6 0.212±0.001 0.213±0.001 -0.001 0.47
7.2 0.253±0.002 0.253±0.002 0.000 0.00
*Mean±SD of 6 replicate determinations
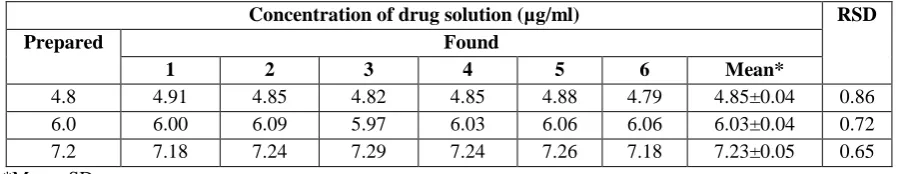
Table No. 3: Repeatability studies for the developed analytical method for glibenclamide
Concentration of drug solution (µg/ml) RSD
Prepared Found
1 2 3 4 5 6 Mean*
4.8 4.91 4.85 4.82 4.85 4.88 4.79 4.85±0.04 0.86
6.0 6.00 6.09 5.97 6.03 6.06 6.06 6.03±0.04 0.72
7.2 7.18 7.24 7.29 7.24 7.26 7.18 7.23±0.05 0.65
*Mean±SD
Table No. 4: Intraday precision of developed analytical method for glibenclamide
Concentration of drug solution (µg/ml) RSD
Taken Found
t1** t2** t3** Mean*
4.8 4.85±0.04 4.88±0.04 4.83±0.04 4.85±0.05 0.94
6.0 6.03±0.04 6.04±0.03 6.04±0.03 6.04±0.03 0.56
7.2 7.23±0.05 7.23±0.04 7.23±0.05 7.23±0.04 0.61
72
Table No. 5: Interday precision of developed analytical method for glibenclamide
Concentration of drug solution (µg/ml) RSD
Taken Found
Day 1** Day 2** Day 3** Mean*
4.8 4.85±0.04 4.80±0.03 4.83±0.04 4.83±0.04 0.91
6.0 6.03±0.04 6.06±0.04 6.04±0.03 6.04±0.04 0.63
7.2 7.23±0.05 7.22±0.04 7.25±0.02 7.24±0.05 0.65
*Mean±SD of 18 determinations (6 replicate determinations every day for 3 days), **Mean±SD of 6 replicate determinations
Table No. 6: Accuracy studies for the developed analytical method for glibenclamide
Cs (µg/ml) Ca (µg/ml) Ct* (µg/ml) %Recovery*#
3
1.8 (80%) 4.88±0.03 102.94±1.46
3.0 (100%) 6.04±0.03 100.39±1.03
4.2 (120%) 7.25±0.06 100.49±1.31
Cs= Concentration of standard solution, Ca= Concentration of sample solution added and Ct= Total concentration found,
#% Recovery= [(Ct−Cs)/Ca]x100, *Mean±SD of 6 replicate determinations
There was observed no difference in the wavelength/s of study. The method was found to be specific as indicated by less than 0.58% difference in absorbance of pure and mixed (with common excipients) standard solutions (at 4.8 g/ml, 6.0 g/ml and 7.2 g/ml) of glibenclamide (Table No. 2).
The low values of RSD (0.37%-0.66%, Table No. 3-5) indicated that the developed method was repeatable and precise.
The accuracy was performed by recovery studies (Table No. 6). The percent recovery of the added known amounts of the glibenclamide to a known concentration of the sample was found to be 100.39%±1.03%-102.94%±1.46% (Table No. 6).
The limit of detection (LOD) and limit of quantification (LOQ) of the drugs by proposed method were found to be 0.23 µg/ml and 0.71 µg/ml respectively.
The developed method was also found to be robust as well as rugged.
4. CONCLUSION
The proposed method has been proved to be simple, precise, rapid and reliable. The method was validated by evaluation of the validation parameters as described in the ICH2QB guideline for
specificity, linearity, LOD values, LOQ values, inter- and intra-day precision, and accuracy which were obtained during the validation studies and were found to be within acceptable limits.
Moreover, the method is fast with respect to analysis time as compared to sophisticated chromatographic techniques. No pH adjustment, no expensive instrumentation and no expensive and toxic organic solvents are required.
The method can be successfully employed for glibenclamide quantification in all types of pharmaceutical formulations and liquid samples.
5. ACKNOWLEDGEMENTS
The authors are thankful to Sun Pharmaceuticals Limited, Silvassa, India for providing the gift sample of glibenclamide
REFERENCES
1. O’Neil JM, Obenchain JR, Budavari S. (2001). Glyburide (Monograph No. 4491). In: The Merck Index, 13th Ed. (pp. 798). N J: Merck Research Laboratories, A division of Merck & Co. Inc., Whitehouse Station, N J. 2. Davis SN. (2006). Insulin, oral hypoglycemic agents, and the pharmacology of
73
Goodman and Gilman's The Pharmacological Basis of Therapeutics, 11th Ed. (pp. 1634). New Delhi: McGraw Hill Publishing Division.3. Anonymous. (1996). Glibenclamide. In: Indian Pharmacopoeia1996, 4th Ed. Vol. I. (pp. 347). New Delhi: The Indian Pharmacopoeia Commission, Central Indian Pharmacopoeia Laboratory, Govt. of India, Ministry of health & family welfare, Controller of publications.
4. FDA Dissolution methods, List of all drugs in the database, Glyburide. http://www.accessdata.fda.gov/scripts/cder/dissolution/dsp_SearchResults_Dis solutions.cfm?PrintAll=1 (Accessed on 17/06/2012)
5. Dressman JB, Lo¨benberg R, Kra¨mer J, Shah VP, Amidon GL. Dissolution testing as a prognostic tool for oral drug absorption: dissolution behavior of glibenclamide. Pharmaceutical Research. 2000; 17(4): 439-444.
6. Hindustan A A, Meghana M, Navya K, Mallika B, Aaslesha A, Srilatha V, Chitta SK. Designing and evaluation of glibenclamide azadirachta indica mucilage based controlled release matrix tablets. Der Pharmacia Lettre. 2010; 2(1): 117-121.
7. Gianotto EADS, Arentis RP, Lara-Filho MJ, Filho ACSC, Fregonezi-Neri MM. Dissolution test for glibenclamide tablets. Quim. Nova. 2007; 30(5): 1218-1221.
8. Davidson AG. (1997). UV-Visible spectrophotometry. In: Backett AH, Stenlake JB (Eds) Practical pharmaceutical chemistry, Part 2, 4th Ed., 1st Indian Ed. (pp. 309). New Delhi: CBS Publishers and Distributors Pvt. Ltd. 9. ICH Guidelines Q2(R1). Validation of analytical procedures: text and
methodology. ICH Harmonised Tripartite Guidelines, adopted, November 2005.