SHEAR STRENGTH OF LEAN DUPLEX STAINLESS
STEEL COMPRESSION FLANGE GIRDERS
*Abdelrahim K. Dessouki, **Mona M. Fawzy
*Prof., Department of Structural Engineering, Faculty of Engineering,, Ain Shams University, Cairo, Egypt
** 2Assistant Prof., Department of Structural Engineering, Higher institute of Engineering, Cairo, Egypt
ABSTRACT
The objective of this research is to study the shear capacity of hollow tubular compression flange plate girders formed of lean duplex stainless steel. The compression and tension flanges are formed from tubular and flat plate, respectively. A combination between the advantages of both hollow shaped compression flange and lean duplex stainless steel is proposed. The main parameters considered are compression flange dimensions, web plate slenderness, and aspect ratio of the web. The analytical study includes finite element models using ANSYS program taking geometric and material nonlinearities into consideration. These models are verified against the results obtained from previous researches. Two failure mechanisms are observed: shear or flexural. The results show that decreasing aspect ratio of the web increases the shear resistance of the hollow tubular compression flange plate girders. Also, web plate slenderness is directly proportional to shear load of hollow tubular compression flange plate girders.
Keywords: Lean duplex; Shear capacity; Finite element analysis; Stainless steel; Hollow tubular compression
flange plate girders; Web panel; Analytical study
INTRODUCTION
selection of optimum dimensions for the steel HTFP girders have been presented. It is noticed that shear resistance of stainless steel plate girders or steel tubular hollow flanges have been previously investigated by Saliba and Garder [7], in addition to other references [9], [7], [1], [4], [6], [14] and [18]. Both numerical and experimental tests have been conducted. Attention has been paid to the effect of including stiffeners, both transverse and longitudinal.
The use of duplex stainless steel material combines well the advantages of both austenitic and carbon steel materials. The duplex grades offer a combination of higher strength than austenitic in addition to a great majority of carbon steels with similar or superior corrosion resistance. However, high nickel prices have more recently led to a demand for lean duplexes with low nickel content, such as grade EN 1.4162. A finite element modeling for full-size lean duplex stainless steel plate girders has been completed by Hassanein [9]. Parametric studies regarding number of transversely stiffened I-section plate girders showing the effect of flange width-to-web depth ratio, flange-to-web thickness ratio and web plate slenderness have been completed. The current paper reports a theoretical series of models to investigate the shear behavior and strength of compression HTFP girders formed of lean duplex grade EN 1.4162 stainless steel. This work seeks to build a basis for the shear behavior of stainless steel compression HTFP girders. Hence, the effect of different parameters such as compression flange depth (Df), web plate slenderness (hw/tw) and aspect ratio of the web (a/hw) are
taken into consideration. It is worth to mention that EN1993-1-4 (2006) does not provide shear resistance for such girders which necessitates providing a formula suitable for those girders.
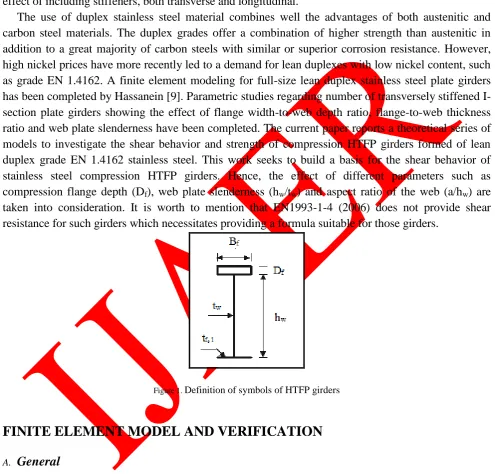
Figure 1. Definition of symbols of HTFP girders
FINITE ELEMENT MODEL AND VERIFICATION
A. General
In order to analyze the shear behavior of lean duplex stainless steel compression HTFP girders, a numerical analysis is conducted. Finite element full size models incorporating all material properties and dimensions are developed using ANSYS [2] computer package. The finite element model details are described in the following subsections.
The following parameters are covered:
Span length; 9, 12 and 15 meters (m).
Compression flange depth (Df); 100, 200 and 300 millimeters (mm).
Aspect ratio of the web panel (a/hw); 0.5, 1 and 2.
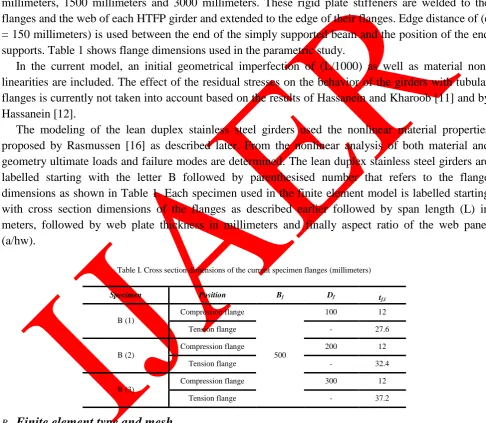
The height of the web is fixed to 1500 millimeters for the whole finite element models. The compression and tension flanges for each girder have the same cross-sectional areas as listed in table 1. This was guaranteed by fixing the width (Bf) of both flanges to 500 millimeters. The thickness of
the flat tension flange (tf,l) is then calculated to give the same cross-sectional area of the HTFP
compression flange as listed in table 1.
The webs of the girders are stiffened transversely each distance (a) with the values of 750 millimeters, 1500 millimeters and 3000 millimeters. These rigid plate stiffeners are welded to the flanges and the web of each HTFP girder and extended to the edge of their flanges. Edge distance of (e = 150 millimeters) is used between the end of the simply supported beam and the position of the end supports. Table 1 shows flange dimensions used in the parametric study.
In the current model, an initial geometrical imperfection of (L/1000) as well as material non-linearities are included. The effect of the residual stresses on the behavior of the girders with tubular flanges is currently not taken into account based on the results of Hassanein and Kharoob [11] and by Hassanein [12].
The modeling of the lean duplex stainless steel girders used the nonlinear material properties proposed by Rasmussen [16] as described later. From the nonlinear analysis of both material and geometry ultimate loads and failure modes are determined. The lean duplex stainless steel girders are labelled starting with the letter B followed by parenthesised number that refers to the flange dimensions as shown in Table 1. Each specimen used in the finite element model is labelled starting with cross section dimensions of the flanges as described earlier followed by span length (L) in meters, followed by web plate thickness in millimeters and finally aspect ratio of the web panel (a/hw).
Table I. Cross section dimensions of the current specimen flanges (millimeters)
Specimen Position Bf Df tf,l
B (1)
Compression flange
500
100 12
Tension flange - 27.6
B (2)
Compression flange 200 12
Tension flange - 32.4
B (3)
Compression flange 300 12
Tension flange - 37.2
B. Finite element type and mesh
Wherever Times is specified, Times Roman or Times New Roman may be used. Avoid using bit-mapped fonts if possible. True-Type 1 or Open Type fonts are preferred. Please embed symbol fonts, as well, for math, etc.
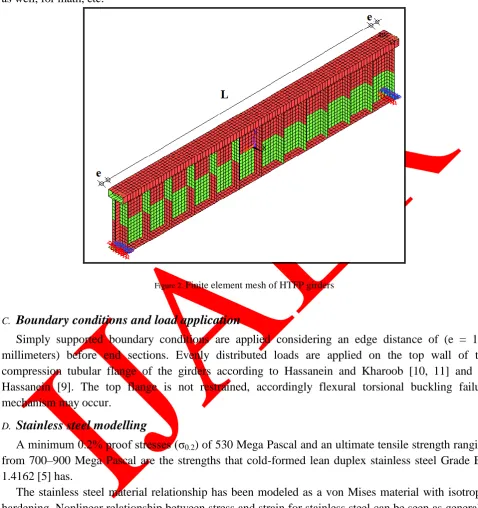
Figure 2. Finite element mesh of HTFP girders
C. Boundary conditions and load application
Simply supported boundary conditions are applied considering an edge distance of (e = 150 millimeters) before end sections. Evenly distributed loads are applied on the top wall of the compression tubular flange of the girders according to Hassanein and Kharoob [10, 11] and by Hassanein [9]. The top flange is not restrained, accordingly flexural torsional buckling failure mechanism may occur.
D. Stainless steel modelling
A minimum 0.2% proof stresses (σ0.2) of 530 Mega Pascal and an ultimate tensile strength ranging
from 700–900 Mega Pascal are the strengths that cold-formed lean duplex stainless steel Grade EN 1.4162 [5] has.
The stainless steel material relationship has been modeled as a von Mises material with isotropic hardening. Nonlinear relationship between stress and strain for stainless steel can be seen as generally represented the Ramberg–Osgood equation by Rasmussen [16] and as used in Hassanein [9] as given below
ɛ =
ο E
σ
+ 0.002 (
ο σ
σ
In ―(1)‖, n is called the nonlinearity index which indicates of the nonlinearity of the stress strain behavior, with lower n values indicating a greater degree of nonlinearity. The grades of stainless steel differ in their degrees of nonlinearity. Increasing the value of n converges the material behavior to the elasto-plastic behavior of carbon steel (elastic-perfectly plastic behavior for n =∞), while low n values have higher hardening behavior.
Equation (1) gives good agreement with experimental stress strain data up to the 0.2% proof stress (σ0.2); however, the formulation generally overestimates the corresponding stresses for higher strains
as shown in Hassanein [9]. That necessitates developing two stage versions of expressing the full-range stress strain material behavior of stainless steel. For this purpose, Rasmussen (2003) proposed the use of an expression for the complete stress strain curve for stainless steel alloys. Equation (2) involves the conventional Ramberg– Osgood parameters (n, E0, σ0.2) as well as the ultimate tensile
strength (σu) and strain (ɛu). Good agreement between stress strain curves with tests over the full range
of strains up to the ultimate tensile strain is observed. Consequently, ―(2)‖is used in the current investigation to generate the stress strain curve of the lean duplex stainless steel material Grade EN 1.4162. ɛ 0.2 0.2 m 0.2 u 0.2 u 0.2 0.2 0.2 n 0.2 σ σ for ε ) σ -σ σ -σ ( ε E σ -σ σ σ for ) σ σ ( 0.002 E σ 0
(2)
In the equations, E0 is the initial modulus of elasticity (e.g. 200 Gega Pascal), E0.2 is the tangent
modulus of the stress strain curve at the 0.2% proof stress and given as ―(3)‖
n/e 0.002 1 E0
Where, e is the non-dimensional proof stress given as e = σ0.2/E0.
The material behavior provided by ANSYS is a multilinear stress strain curve. Elastic behavior is represented in the first part of the multilinear curve up to the proportional limit stress with measured Young‘s modulus E0 = 200 Gega Pascal, and Poisson‘s ratio was taken as 0.3. The proportional limit
was found to be σ0.01= 300 Gega Pascal.
E. Finite element model verification
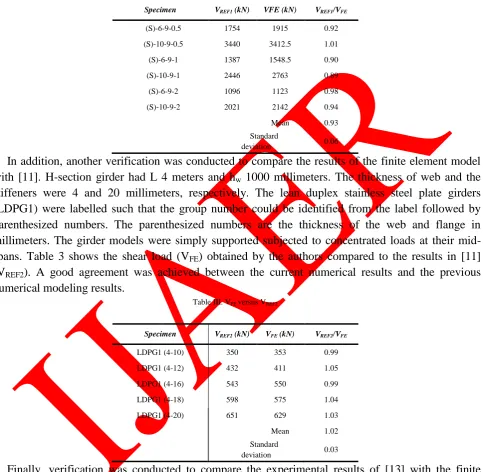
Before studying the behavior of HTFP girders, it is essential to validate the numerical model. Unfortunately, there are still no experimental results on these girders with slender webs in literature. Reference [10] proposed a simply supported HTFP girder with L 9 meters and hw 1500 millimeters. Df, Bf, thickness of the compression flange, and the stiffeners were 101.6, 508, 12.7 and 20
millimeters, respectively. tf,l was 29.2 millimeters, while two values of tw were used 6 and 10
millimeters. Three a/hw were used 0.5, 1 and 2 respectively. Loading was distributed evenly on the top
hardening was used to simulate the steel material. Table 2 presents the shear load (VFE) in Kilo newton
(kN) obtained numerically and compared to the results contained in [10] (VREF1). The steel girders (S)
are labelled starting with tw in millimeters then L in meters, and finally (a/hw). Table II.VFE versus VREF1
Specimen VREF1 (kN) VFE (kN) VREF1/VFE
(S)-6-9-0.5 1754 1915 0.92
(S)-10-9-0.5 3440 3412.5 1.01
(S)-6-9-1 1387 1548.5 0.90
(S)-10-9-1 2446 2763 0.89
(S)-6-9-2 1096 1123 0.98
(S)-10-9-2 2021 2142 0.94
Mean 0.93
Standard
deviation 0.06
In addition, another verification was conducted to compare the results of the finite element model with [11]. H-section girder had L 4 meters and hw 1000 millimeters. The thickness of web and the
stiffeners were 4 and 20 millimeters, respectively. The lean duplex stainless steel plate girders (LDPG1) were labelled such that the group number could be identified from the label followed by parenthesized numbers. The parenthesized numbers are the thickness of the web and flange in millimeters. The girder models were simply supported subjected to concentrated loads at their mid-spans. Table 3 shows the shear load (VFE) obtained by the authors compared to the results in [11]
(VREF2). A good agreement was achieved between the current numerical results and the previous
numerical modeling results.
Table III. VFE versus VREF2
Specimen VREF2 (kN) VFE (kN) VREF2/VFE
LDPG1 (4-10) 350 353 0.99
LDPG1 (4-12) 432 411 1.05
LDPG1 (4-16) 543 550 0.99
LDPG1 (4-18) 598 575 1.04
LDPG1 (4-20) 651 629 1.03
Mean 1.02
Standard
deviation 0.03
Finally, verification was conducted to compare the experimental results of [13] with the finite element model. Cold-formed lean duplex stainless steel members at axial compression were cut to a specified length of either 550 or 1550 millimeters. Both ends of the specimens were milled flat and then welded to 20 millimeters thick steel end plates for the specimens to be connected to the roller hinged end bearings. The label C2 indicates cross section with dimensions (millimeters) ―50x50x1.5‖. The letter ―L‖ indicates the length of the specimen in millimeters. The label C3 indicates (millimeters) ―50x50x2.5‖. Finally, label C5 indicates (millimeters) ―100x50x2.5‖. Table 4 shows the test strength of the specimens (TestYuner) obtained by [13] compared to the authors results (FE1). A good agreement
Table IV. TestYuner versus FE1
Specimen TestYuner
(kN) FE1 (kN)
FE1/
TestYuner
C2L550 139.3 156 1.12
C2L1550 65.4 70 1.07
C3L550 302.1 276 0.91
C5L550 372.3 404.3 1.09
C5L1550 193.7 195 1.01
Mean 1.04
Standard deviation 0.08
RESULTS AND DISCUSSIONS
In this section, the finite element results of the current models are provided. Discussion of the results is then made. Three different flange cross sections are used for upper and lower flanges. It is worth to mention that girders with same flange cross section dimensions but different web thicknesses approximately have same value of plastic moment resistance (MP). Meanwhile, different plastic shear
resistances (VP) correspond to different web thicknesses assuming that they are based on the web only.
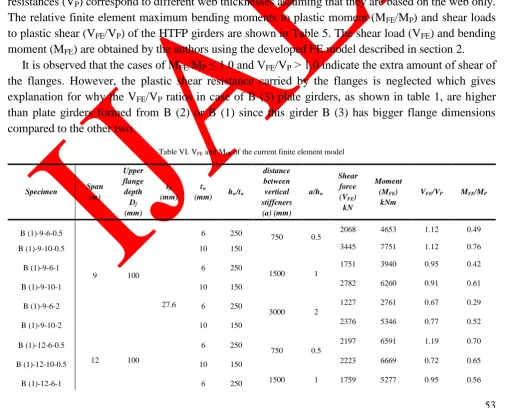
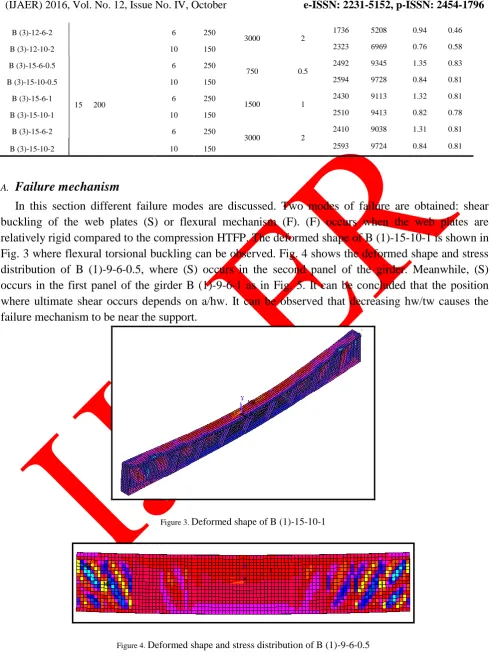
The relative finite element maximum bending moments to plastic moment (MFE/MP) and shear loads
to plastic shear (VFE/VP) of the HTFP girders are shown in Table 5. The shear load (VFE) and bending
moment (MFE) are obtained by the authors using the developed FE model described in section 2.
It is observed that the cases of MFE/MP ≤ 1.0 and VFE/VP ˃ 1.0 indicate the extra amount of shear of
the flanges. However, the plastic shear resistance carried by the flanges is neglected which gives explanation for why the VFE/VP ratios in case of B (3) plate girders, as shown in table 1, are higher
than plate girders formed from B (2) or B (1) since this girder B (3) has bigger flange dimensions compared to the other two.
Table VI. VFE and MFE of the current finite element model
Specimen Span (m) Upper flange depth Df (mm) tfl (mm) tw
(mm) hw/tw
distance between vertical stiffeners (a) (mm) a/hw Shear force (VFE)
kN
Moment (MFE)
kNm
VFE/VP MFE/MP
B (1)-9-6-0.5
9 100
27.6
6 250 750 0.5 2068 4653 1.12 0.49
B (1)-9-10-0.5 10 150 3445 7751 1.12 0.76
B (1)-9-6-1 6 250
1500 1
1751 3940 0.95 0.42
B (1)-9-10-1 10 150 2782 6260 0.91 0.61
B (1)-9-6-2 6 250
3000 2
1227 2761 0.67 0.29
B (1)-9-10-2 10 150 2376 5346 0.77 0.52
B (1)-12-6-0.5
12 100
6 250
750 0.5
2197 6591 1.19 0.70
B (1)-12-10-0.5 10 150 2223 6669 0.72 0.65
B (1)-12-10-1 10 150 1919 5757 0.62 0.56
B (1)-12-6-2 6 250
3000 2
1310 3930 0.71 0.42
B (1)-12-10-2 10 150 1671 5013 0.54 0.49
B (1)-15-6-0.5
15 100
6 250
750 0.5
1420 5325 0.77 0.56
B (1)-15-10-0.5 10 150 1500 5625 0.49 0.55
B (1)-15-6-1 6 250
1500 1
1318 4943 0.71 0.52
B (1)-15-10-1 10 150 1350 5063 0.44 0.49
B (1)-15-6-2 6 250
3000 2
931 3491 0.50 0.37
B (1)-15-10-2 10 150 1168 4380 0.38 0.43
B (2)-9-6-0.5
9 200
32.44
6 250
750 0.5
2872 6462 1.56 0.58
B (2)-9-10-0.5 10 150 4216 9486 1.37 0.79
B (2)-9-6-1 6 250
1500 1
2327 5236 1.26 0.47
B (2)-9-10-1 10 150 3517 7913 1.14 0.66
B (2)-9-6-2 6 250
3000 2
1594 3587 0.84 0.32
B (2)-9-10-2 10 150 2390 5378 0.78 0.45
B (2)-12-6-0.5
12 200
6 250
750 0.5
2423 7269 1.31 0.65
B (2)-12-10-0.5 10 150 2654 7962 0.86 0.66
B (2)-12-6-1 6 250
1500 1
2250 6750 1.39 0.60
B (2)-12-10-1 10 150 2573 7719 0.84 0.64
B (2)-12-6-2 6 250
3000 2
1476 4428 0.80 0.40
B (2)-12-10-2 10 150 2203 6609 0.72 0.55
B (2)-15-6-0.5
15 200
6 250
750 0.5
2105 7894 1.14 0.70
B (2)-15-10-0.5 10 150 2277 8539 0.74 0.71
B (2)-15-6-1 6 250
1500 1
1726 6473 0.94 0.58
B (2)-15-10-1 10 150 1853 6949 0.60 0.58
B (2)-15-6-2 6 250
3000 2
1479 5546 0.80 0.49
B (2)-15-10-2 10 150 1604 6015 0.52 0.50
B (3)-9-6-0.5
9 200
37.2
6 250
750 0.5
3081 6932 1.67 0.62
B (3)-9-10-0.5 10 150 4548 10233 1.48 0.85
B (3)-9-6-1 6 250
1500 1
2492 5607 1.35 0.50
B (3)-9-10-1 10 150 3862 8690 1.26 0.72
B (3)-9-6-2 6 250
3000 2
1747 3931 0.95 0.35
B (3)-9-10-2 10 150 3402 7655 1.11 0.64
B (3)-12-6-0.5
12 200
6 250
750 0.5
2147 6441 1.16 0.57
B (3)-12-10-0.5 10 150 3417 10251 1.11 0.85
B (3)-12-6-1 6 250
1500 1
2514 7542 1.60 0.67
B (3)-12-6-2 6 250
3000 2
1736 5208 0.94 0.46
B (3)-12-10-2 10 150 2323 6969 0.76 0.58
B (3)-15-6-0.5
15 200
6 250
750 0.5
2492 9345 1.35 0.83
B (3)-15-10-0.5 10 150 2594 9728 0.84 0.81
B (3)-15-6-1 6 250
1500 1
2430 9113 1.32 0.81
B (3)-15-10-1 10 150 2510 9413 0.82 0.78
B (3)-15-6-2 6 250
3000 2
2410 9038 1.31 0.81
B (3)-15-10-2 10 150 2593 9724 0.84 0.81
A. Failure mechanism
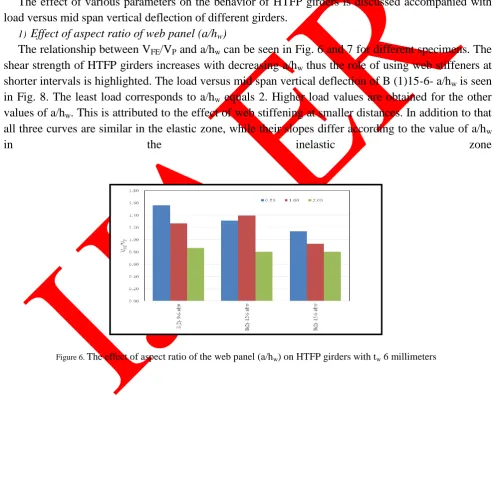
In this section different failure modes are discussed. Two modes of failure are obtained: shear buckling of the web plates (S) or flexural mechanism (F). (F) occurs when the web plates are relatively rigid compared to the compression HTFP. The deformed shape of B (1)-15-10-1 is shown in Fig. 3 where flexural torsional buckling can be observed. Fig. 4 shows the deformed shape and stress distribution of B (1)-9-6-0.5, where (S) occurs in the second panel of the girder. Meanwhile, (S) occurs in the first panel of the girder B (1)-9-6-1 as in Fig. 5. It can be concluded that the position where ultimate shear occurs depends on a/hw. It can be observed that decreasing hw/tw causes the failure mechanism to be near the support.
Figure 3. Deformed shape of B (1)-15-10-1
Figure 5. Deformed shape and stress distribution of B (1)-9-6-1
B. Behavior of girders
The effect of various parameters on the behavior of HTFP girders is discussed accompanied with load versus mid span vertical deflection of different girders.
1)Effect of aspect ratio of web panel (a/hw)
The relationship between VFE/VP and a/hw can be seen in Fig. 6 and 7 for different specimens. The
shear strength of HTFP girders increases with decreasing a/hw thus the role of using web stiffeners at
shorter intervals is highlighted. The load versus mid span vertical deflection of B (1)15-6- a/hw is seen
in Fig. 8. The least load corresponds to a/hw equals 2. Higher load values are obtained for the other
values of a/hw. This is attributed to the effect of web stiffening at smaller distances. In addition to that
all three curves are similar in the elastic zone, while their slopes differ according to the value of a/hw
in the inelastic zone
Figure 7. The effect of aspect ratio of the web panel (a/hw) on HTFP girders with tw 10 millimeters
0 5 10 15 20 25 30 35 40 45
0 500 1000 1500 2000 2500 3000
L
o
a
d
(
k
N
/m
')
Mid Span Vertical Deflection (mm) a/hw = 2 a/hw = 1 a/hw = 0.5
d e m o d e m o d e m o d e m o d e m o
d e m o d e m o d e m o d e m o d e m o
d e m o d e m o d e m o d e m o d e m o
d e m o d e m o d e m o d e m o d e m o
d e m o d e m o d e m o d e m o d e m o
d e m o d e m o d e m o d e m o d e m o
d e m o d e m o d e m o d e m o d e m o
Figure 8. Load versus mid span vertical deflection curve of B (1)-15-6- a/hw
2)Effect of web plate slenderness (hw/tw)
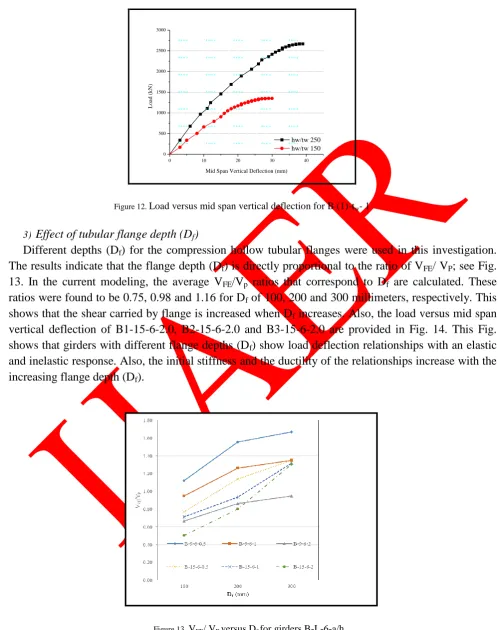
The influence of hw/tw on the behavior of HTFP girders is discussed in this part. There is no doubt
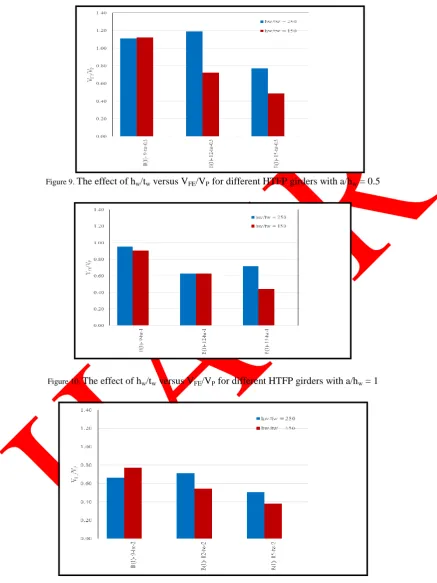
that increasing web thickness enhances the shear resistance of the girders. Meanwhile, the effect of hw/tw is discussed versus VFE/VP. Accordingly, Fig. 9 to 11 show the values of VFE/VP that correspond
to hw/tw for the same specimen with different a/hw. It is concluded from the figs. that for most cases
VFE/VP increases with higher hw/tw, i.e. more slender webs. This can be explained by saying that
calculating the value of VP depends entirely on the web while excluding the effect of flanges in shear resistance; so more slender webs have lower VP. As can be seen in Fig. 11 only one specimen with L 9
meters shows higher values of VFE/VP with smaller hw/tw. Fig. 12 shows the load versus mid span
Figure 9. The effect of hw/tw versus VFE/VP for different HTFP girders with a/hw = 0.5
Figure 10. The effect of hw/tw versus VFE/VP for different HTFP girders with a/hw = 1
0 10 20 30 40 0
500 1000 1500 2000 2500 3000
L
o
a
d
(
k
N
)
Mid Span Vertical Deflection (mm)
hw/tw 250 hw/tw 150
d e m o d e m o d e m o d e m o d e m o
d e m o d e m o d e m o d e m o d e m o
d e m o d e m o d e m o d e m o d e m o
d e m o d e m o d e m o d e m o d e m o
d e m o d e m o d e m o d e m o d e m o
d e m o d e m o d e m o d e m o d e m o
d e m o d e m o d e m o d e m o d e m o
Figure 12. Load versus mid span vertical deflection for B (1)-tw- 1
3)Effect of tubular flange depth (Df)
Different depths (Df) for the compression hollow tubular flanges were used in this investigation.
The results indicate that the flange depth (Df) is directly proportional to the ratio of VFE/ VP; see Fig.
13. In the current modeling, the average VFE/Vp ratios that correspond to Df are calculated. These
ratios were found to be 0.75, 0.98 and 1.16 for Df of 100, 200 and 300 millimeters, respectively. This
shows that the shear carried by flange is increased when Df increases. Also, the load versus mid span
vertical deflection of B1-15-6-2.0, B2-15-6-2.0 and B3-15-6-2.0 are provided in Fig. 14. This Fig. shows that girders with different flange depths (Df) show load deflection relationships with an elastic
and inelastic response. Also, the initial stiffness and the ductility of the relationships increase with the increasing flange depth (Df).
0 5 10 15 20 25 30 35 40 45 50 55 60 0 200 400 600 800 1000 1200 1400 1600 1800 2000 2200 2400 2600 L o a d ( k N /m ')
Mid Span Vertical Deflection (mm) B1-15-6-2 B2-15-6-2 B3-15-6-2
d e m o d e m o d e m o d e m o d e m o
d e m o d e m o d e m o d e m o d e m o
d e m o d e m o d e m o d e m o d e m o
d e m o d e m o d e m o d e m o d e m o
d e m o d e m o d e m o d e m o d e m o
d e m o d e m o d e m o d e m o d e m o
d e m o d e m o d e m o d e m o d e m o
Figure 14. Loadversus mid span vertical deflectionof B-15-6-2
CONCLUSIONS
This paper discusses the shear behavior of HTFP girders made of lean duplex stainless steel. The main purpose of this discussion is to add data to literature as currently there is none available. This paper aims to benefit from HTFP girders that are made of lean duplex stainless steel Grade EN 1.4162, which has high tensile strength and low nickel content, therefore lower price than ordinary stainless steel. Finite element models using ANSYS are composed considering both geometric and material nonlinearities. The main conclusions are:
Two failure modes are observed: shear or flexural. When the web is relatively rigid, flexural torsional buckling occurs and vice versa.
The position of shear failure depends upon aspect ratio of the web panel (a/hw), while
decreasing hw/tw causes the failure mechanism to be near the support.
The VFE/VP values for the HTFP girders decrease with increasing the girders‘ a/hw ratios.
Most values of VFE/VP increase with lower hw/tw, i.e. more slender webs because the value
of VP depends entirely on the web only without considering the effect of flanges in shear
resistance; so more slender webs have lower VP.
Increasing the flange depth (Df) is directly proportional to the ratio VFE/VP because the
contribution of the shear carried by the flange is increased when Df increases.
REFERENCES
[1] Alinia MM, Maryam Shakiba, and HR. Habashi, ‗‘Shear failure characteristics of steel plate
girders,‘‘ Thin Walled Structures, vol. 47, (2009), pp. 1498–1506.
[2] ANSYS, 2009. Finite element program, Swanson Analysis System, Inc., Release. 12: 1.
[3] C. Lee Sung and Chai H. Yoo, ‗‘Experimental study on ultimate shear strength of web panels,‘‘
[4] Dong J. and Richard Sause, ‗‘Flexural strength of tubular flange girders,‘‘ Journal of
Constructional Steel Research, vol. 65, (2009), pp. 622–630
[5] EN 1993-1-4 (2006), Eurocode 3: Design of Steel Structures, Part 1-4: General rules,
Supplementary rules for stainless steel, European Committee for Standardization CEN, Europe.
[6] Estrada I. and E. Real, ‗‘General behavior and effect of rigid and non-rigid end post in stainless
steel plate girders loaded in shear. Part I: Experimental study.‘‘ Journal of Constructional Steel Research, vol. 63, (2007), pp. 970 -984.
[7] Estrada I., E. Real and E. Mirambell,‘‘ Shear resistance in stainless steel plate girders with
transverse and longitudinal stiffening,‘‘ Journal of constructional steel research, vol. 65, (2009), pp. 622-630.
[8] Gardner L. and DA, ‗‘Nethercot Experiments on stainless steel hollow sections—part 1: material
and cross-sectional behavior.‘‘ Journal of Constructional Steel Research, vol. 60, (2004), pp. 1291–318.
[9] Hassanein M.F., ‗‘Finite element investigation of shear failure of lean duplex stainless steel plate
girders,‘‘ Thin-Walled Structures, vol. 49, (2011), pp. 964-973.
[10] Hassanein M.F. and O.F. Kharoob, ‗‘Shear capacity of stiffened plate girders with compression
tubular flanges and slender webs.‘‘ Thin-Walled Structures, vol. 70, (2013), pp. 81-92.
[11] Hassanein M.F. and O.F. Kharoob, ‗‘An extended evaluation for the shear behavior of hollow
tubular flange plate girders.‘‘ Thin-Walled Structures, vol. 56, (2012). 88-102.
[12] Hassanein M.F., O.F. Kharoob and A.M. El Hadidy,‘‘ Lateral–torsional buckling of hollow
tubular flange plate girders with slender stiffened webs.‘‘ Thin-Walled Structures, vol. 65, (2013), pp. 49-61.
[13] Huang Yuner and Ben Young Experimental investigation of cold-formed lean duplex stainless
steel beam-columns. Thin Walled Structures, vol. 76, (2014), pp. 105-117.
[14] Kim BG. And R. Sause, ‗‘High performance steel girders with tubular flanges, ATLSS Report
No. 05-15, Thesis Lehigh University, Pennsylvania
[15] Kvedaras A., G. Šau, A. Komka and E. Jarmolajeva (2015). Analysis of behavior for
hollow/solid concrete-filled CHS steel beams. Steel and Composite Structures, An Int‘l Journal, 19.
[16] Rasmussen KJR, ‗‘Full range stress–strain curves for stainless steel alloys.‘‘ Journal of
Constructional Steel Research, vol. 59, (2003), pp. 47–61.
[17] Saliba N., E. Real, and L. Garder. ‗‘Shear design recommendations for stainless steel plates.‘‘
Engineering Structures, vol. 59, (2014), pp. 220-228.
[18] Smith A, ―Design of HPS Bridge Girders with Tubular Flanges‖, (2001), Thesis Lehigh
Figure 1. Definition of symbols of HTFP girders
Table I. Cross section dimensions of the current specimen flanges (millimeters)
Specimen Position Bf Df tf,l
B (1)
Compression flange
500
100 12
Tension flange - 27.6
B (2)
Compression flange 200 12
Tension flange - 32.4
B (3)
Compression flange 300 12
Tension flange - 37.2
Figure 2. Finite element mesh of HTFP girders
Specimen VREF1 (kN) VFE (kN) VREF1/VFE
(S)-6-9-0.5 1754 1915 0.92
(S)-10-9-0.5 3440 3412.5 1.01
(S)-6-9-1 1387 1548.5 0.90
(S)-10-9-1 2446 2763 0.89
(S)-6-9-2 1096 1123 0.98
(S)-10-9-2 2021 2142 0.94
Mean 0.93
Standard
deviation 0.06
Table III. VFE versus VREF2
Specimen VREF2 (kN) VFE (kN) VREF2/VFE
LDPG1 (4-10) 350 353 0.99
LDPG1 (4-12) 432 411 1.05
LDPG1 (4-16) 543 550 0.99
LDPG1 (4-18) 598 575 1.04
LDPG1 (4-20) 651 629 1.03
Mean 1.02
Standard
deviation 0.03
Table IV. TestYuner versus FE1
Specimen TestYuner
(kN) FE1 (kN)
FE1/
TestYuner
C2L550 139.3 156 1.12
C2L1550 65.4 70 1.07
C3L550 302.1 276 0.91
C5L550 372.3 404.3 1.09
C5L1550 193.7 195 1.01
Mean 1.04
Standard deviation 0.08
Table VI. VFE and MFE of the current finite element model
Specimen Span (m) Upper flange depth Df (mm) tfl (mm) tw
(mm) hw/tw
distance between vertical stiffeners (a) (mm) a/hw Shear force (VFE)
kN
Moment (MFE)
kNm
VFE/VP MFE/MP
B (1)-9-6-0.5
9 100 27.6
6 250 750 0.5 2068 4653 1.12 0.49
B (1)-9-10-0.5 10 150 3445 7751 1.12 0.76
B (1)-9-6-1 6 250
1500 1
1751 3940 0.95 0.42
B (1)-9-10-1 10 150 2782 6260 0.91 0.61
B (1)-9-10-2 10 150 2376 5346 0.77 0.52
B (1)-12-6-0.5
12 100
6 250
750 0.5
2197 6591 1.19 0.70
B (1)-12-10-0.5 10 150 2223 6669 0.72 0.65
B (1)-12-6-1 6 250
1500 1
1759 5277 0.95 0.56
B (1)-12-10-1 10 150 1919 5757 0.62 0.56
B (1)-12-6-2 6 250
3000 2
1310 3930 0.71 0.42
B (1)-12-10-2 10 150 1671 5013 0.54 0.49
B (1)-15-6-0.5
15 100
6 250
750 0.5
1420 5325 0.77 0.56
B (1)-15-10-0.5 10 150 1500 5625 0.49 0.55
B (1)-15-6-1 6 250
1500 1
1318 4943 0.71 0.52
B (1)-15-10-1 10 150 1350 5063 0.44 0.49
B (1)-15-6-2 6 250
3000 2
931 3491 0.50 0.37
B (1)-15-10-2 10 150 1168 4380 0.38 0.43
Figure 3. Deformed shape of B (1)-15-10-1
Figure 5. Deformed shape and stress distribution of B (1)-9-6-1
Figure 6. The effect of aspect ratio of the web panel (a/hw) on HTFP girders with tw 6 millimeters
0 5 10 15 20 25 30 35 40 45 0
500 1000 1500 2000 2500 3000
L
o
a
d
(
k
N
/m
')
Mid Span Vertical Deflection (mm) a/hw = 2 a/hw = 1 a/hw = 0.5
d e m o d e m o d e m o d e m o d e m o
d e m o d e m o d e m o d e m o d e m o
d e m o d e m o d e m o d e m o d e m o
d e m o d e m o d e m o d e m o d e m o
d e m o d e m o d e m o d e m o d e m o
d e m o d e m o d e m o d e m o d e m o
d e m o d e m o d e m o d e m o d e m o
Figure 8. Load versus mid span vertical deflection curve of B (1)-15-6- a/hw
Figure 9. The effect of hw/tw versus VFE/VP for different HTFP girders with a/hw = 0.5
Figure 11. The effect of hw/tw versus VFE/VP for different HTFP girders with a/hw = 2
0 10 20 30 40
0 500 1000 1500 2000 2500 3000
L
o
a
d
(
k
N
)
Mid Span Vertical Deflection (mm)
hw/tw 250 hw/tw 150
d e m o d e m o d e m o d e m o d e m o
d e m o d e m o d e m o d e m o d e m o
d e m o d e m o d e m o d e m o d e m o
d e m o d e m o d e m o d e m o d e m o
d e m o d e m o d e m o d e m o d e m o
d e m o d e m o d e m o d e m o d e m o
d e m o d e m o d e m o d e m o d e m o
Figure 13. VFE/ VP versus Df for girders B-L-6-a/hw
0 5 10 15 20 25 30 35 40 45 50 55 60 0
200 400 600 800 1000 1200 1400 1600 1800 2000 2200 2400 2600
L
o
a
d
(
k
N
/m
')
Mid Span Vertical Deflection (mm) B1-15-6-2 B2-15-6-2 B3-15-6-2
d e m o d e m o d e m o d e m o d e m o
d e m o d e m o d e m o d e m o d e m o
d e m o d e m o d e m o d e m o d e m o
d e m o d e m o d e m o d e m o d e m o
d e m o d e m o d e m o d e m o d e m o
d e m o d e m o d e m o d e m o d e m o
d e m o d e m o d e m o d e m o d e m o