Vol. 7, No. 1, 2014, 53-58
ISSN: 2279-087X (P), 2279-0888(online) Published on 9 September 2014
www.researchmathsci.org
53
A Triangular Fuzzy Model for Assessing
Problem Solving Skills
Michael Gr. Voskoglou
Professor Emeritus of Mathematical Sciences School of Technological Applications
Graduate Technological Educational Institute of Patras, Greece E-mail: [email protected], [email protected]
URL: http://eclass.teipat.gr/eclass/corses/523102 Received 15 July 2014; accepted 20 August 2014
Abstract. We apply a Triangular Fuzzy Model (TFM) for assessing students’ problem solving skills. The TFM is a variation of a special form of the Centre of Gravity (COG) defuzzification technique that we have used in earlier papers for assessing students’ performance in several mathematical tasks. The main idea of the TFM is the replacement of the rectangles appearing in the graph of the COG technique by isosceles triangles sharing common parts. In this way we cover the ambiguous cases of students’ scores being in the limits between two successive grades (e.g. between A and B). A classroom experiment is also presented illustrating our results in practice.
Keywords: Fuzzy Sets, Centre of Gravity defuzzification technique, Triangular Fuzzy Model, Problem Solving.
AMS Mathematics Subject Classification (2010): 03E72 1. Introduction
In 1999 Voskoglou developed a fuzzy model for the description of the learning process [8] and later [9] he used the total uncertainty of the corresponding fuzzy system for assessing the students’ skills in learning mathematics. Meanwhile Subbotin et al. [2], based on Voskoglou’s fuzzy model, adopted properly the widely used in Fuzzy Mathematics Center of Gravity (COG) defuzzification technique to provide an alternative measure for the assessment of students’ learning skills. Since then, both Voskoglou and Subbotin, either collaborating or independently to each other, utilized the COG technique in assessing other students’ competencies (e.g. see [3], [6], [10-13], etc) as well as the Bridge player’s performance [14] and in testing the effectiveness of a CBR system [4].
Michael Gr. Voskoglou
54
succeeds to cover the ambiguous cases of students’ scores being at the limits of two successive grades (e.g. A and B, B and C, etc). It is a very common approach in such cases to divide the interval of the specific grades in three parts and to assign the corresponding grade using + and - . For example, 80 – 82 = B-, 83 – 86 = B, 87 – 89 = B+. However, this consideration does not reflect the common situation, where the teacher is not sure about the grading of the students whose performance could be assessed as marginal between and close to two adjacent grades; for example, something like between 81 and 79 percent. The TFM fits this situation.
This paper aims at using the TFM in obtaining a fuzzy measure of students’ Problem Solving (PS) skills. The text is organized as follows: In section 2 we develop the TFM using a scale of five grades (A, B, C, D and F) instead of three grades (A, B, C-F) used in [5] and [7]. In this way the fuzzy measure obtained becomes more accurate. In section 3 we present a classroom experiment performed recently with students of the Graduate Technological Educational Institute (T. E. I.) of Western Greece illustrating our results in practice. Finally, section 4 is devoted to conclusions and discussion about our plans for further research on the subject.
For general facts on fuzzy sets we refer to the book [1].
2. The triangular fuzzy model
Let U= {A, B, C, D, F} be the set of students’ grades A= excellent, B = very good, C = good, D = satisfactory and F = less than satisfactory. In applying the COG as an assessment method, we represent the student group under assessment as a fuzzy set in U and we associate to each x in U an interval of the OX axis. Then, we construct the graph of the corresponding membership function, which in this case is a bar graph consisting of five rectangles with one side lying on the OX axis (e.g. see Figure 3 of [12]) and we calculate, using the well known from Mechanics formulas, the coordinates (Xc, Yc) of the
COG of the level’s section lying between this graph and the OX axis (defuzzification of our data). Further, using elementary algebraic inequalities we determine the area (a triangle) where the COG lies and by elementary geometric observations we obtain a criterion about the student group’s performance (for details see, for example, section 3 of [12]).
As said above, in applying the TFM instead of the COG method, we replace the rectangles appearing in the graph of the COG method by triangles. Therefore, we shall have five such triangles in the resulting scheme, each one corresponding to a students’ grade (F, D, C, B and A respectively). Without loss of generality and for making our calculations easier we consider isosceles triangles with bases of length 10 units lying on the OX axis. The height to the base of each triangle is equal to the percentage of students’ of the group under assessment who achieved the corresponding grade. We allow for any two adjacent triangles to have 30% of their bases belonging to both of them. In this way, we cover the situation of uncertainty in assessing marginal students’ scores, as we have described above.
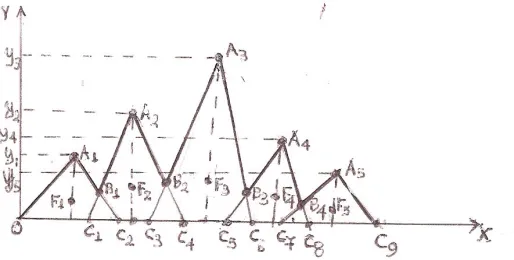
The resulting scheme is presented in Figure 1. The student group under assessment can be represented again, as in the COG method, as a fuzzy set in U, whose membership function y=m(x) has as graph the line OA1B1A2B2A3 B3A4 B4A5C9. It is easy to calculate
55
the straight line segments A1C2, C1A2, B2 is the intersection of C3A3, A2C4 and so on..
Therefore, it is straightforward to determine the analytic form of y=m(x) consisting of 10 branches, corresponding to the equations of the straight lines OA1, A1B1, B1A2, A2B2,
B2A3, A3B3, B3A4, A4B4, B4A5 and A5C9 in the intervals [0, 5), [5, b1), [b1, 12), [12, b2),
[b2, 19), [19, b3), [b3, 26), [26. b4), [b4, 33) and [33, 38] respectively.
However, in applying the TFM the use of the analytic form of y = m(x) is not needed (in contrast to the COG method) for the calculation of the COG of the resulting level’s area. In fact, since the marginal cases of students’ grades should be considered as common parts for any pair of the adjacent triangles, it is logical to not subtract the areas of the intersections from the area of the corresponding level’s section, although in this way we count them twice; e.g. placing the ambiguous cases B+ and A- in both regions B and A. In other words, the COG method, which calculates the coordinates of the COG of the area between the graph of the membership function (line OA1B1A2B2A3 B3A4
B4A5C9) and the OX axis (see Figure 1), thus considering the areas of the “common”
triangles C1B1C2, C3B2C4, C5B3C6 and C7B4C8 only once, is not the proper one to be
applied in the above situation.
Figure 1: The membership function’s graph of TFM
Indeed, in this case it is reasonable to represent each one of the five triangles OA1C2,
C1A2C4, C3A3C6, C5A4C8 and C7A5C9 of Figure 1 by their centers of gravities Fi, i=1, 2, 3,
4, 5 and to consider the entire level’s section as the system of these points-centers. More explicitly, the steps of the whole construction of the TFM are the following:
1. Let y1, y2 , y3, y4, y5 be the percentages of the students in the group getting F, D,
C, B, and A grades respectively, then y1 + y2 + y3 + y4 + y5 = 1 (100%).
2. We consider the isosceles triangles with bases having lengths of 10 units each and their heights y1, y2, y3, y4, y5 in the way that has been illustrated in Figure 1.
Each pair of adjacent triangles has common parts in the base with length 3 units. 3. We calculate the coordinates ( ,
i i
c c
x y ) of the COGFi, i=1,2,3, of each triangle as
Michael Gr. Voskoglou
56
taking also into account that the triangles are isosceles, that 1
3
i
c i
y = y . Also,
since the triangles’ bases have a length of 10 units, we observe that xci=7i-2.
4. We consider the system of the centers Fi, i=1, 2, 3, 4, 5 and we calculate the
coordinates (Xc, Yc) of the COG F of the whole level’s area considered in Figure
1 from the following formulas, derived from the commonly used in such cases definition:
Xc =
5 1 1 i i c i S x S =
∑
, Yc =5 1 1 i i c i S y S =
∑
(1).In the above formulas (1) S denotes the whole area of the considered level’s area and Si, i= 1, 2, 3, 4, 5 denote the areas of the corresponding triangles. Therefore Si = 5yi and
S= 5 1 i i S =
∑
=5 5 1 i i y =∑
=5. Thus, from formulas (1) we finally getXc=
5 5
1 1
1
5 (7 2) 7 2 5i i i i
y i iy
= =
− = −
∑
∑
and Yc=5 5
2
1 1
1 1 1
5 ( )
5i i 3 i 5i i
y y y
= =
=
∑
∑
(2).But, for i, j=1, 2, 3, 4, 5, we have that 0≤(yi –yj) 2
=yi 2
+yj 2
-2yiyj,therefore yi 2
+yj
2 ≥
2yiyj,
with the equality holding if, and only if, yi=yj. Therefore 1 = (
5 1 i i y =
∑
)2= 5 2 1 i i y =∑
+ +2 5 , 1, i j i j i j y y = ≠∑
≤ 5 2 1 i i y =∑
+ 5 2 2 , 1,( i j )
i j i j y y = ≠ +
∑
= 55 2 1 i i y =
∑
, or5 2 1 i i y =
∑
≥ 15 (3), with the equality
holding if, and only if, y1 = y2 = y3 = y4 = y5 =
1 5.
In the case of equality the first of formulas (2) gives that Xc = 7(
1 5+
2 5+
3 5 +
4 5+
5 5)
–2 = 15. Further, combining the inequality (3) with the second of formulas (2) one finds that Yc
1 25
≥ Therefore the unique minimum for Yc corresponds to the COG Fm (15,
1 25).
The ideal case is when y1=y2=y3= y4=0 and y5=1. Then from formulas (2) we get
that Xc = 33 and Yc = 1
5.Therefore the COG in this case is the point Fi (33, 1
5). On the other hand, the worst case is when y1=1 and y2= y3 = y4= y5=0. Then from formulas (2),
we find that the COG is the point Fw (5, 1
5
). Therefore the “area” where the COG Fc lies
isthe triangle Fw Fm Fi . Then, applying an argument analogous to that applied with
respect to Figure 4 in section 3 of [12] we obtain the following criterion for comparing the student groups’ performances:
• Among two or more groups the group with the greater Xc performs better.
• If two or more groups have the same Xc ≥ 15, then the group with the greater Yc
performs better.
• If two or more groups have the same Xc < 15, then the group with the lower Yc
57
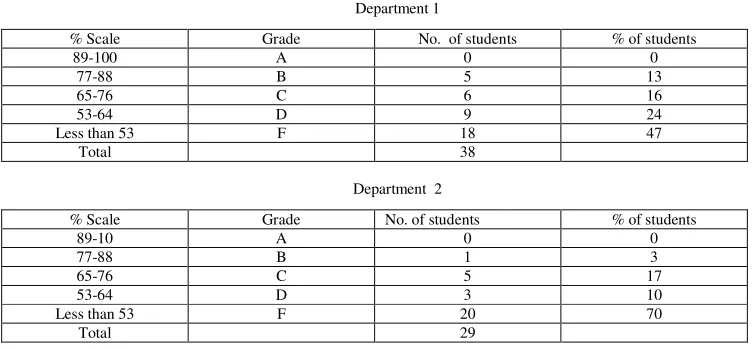
The three problems presented in the Appendix of [12] were given for solution to the students of two different Departments of the School of Technological Applications (prospective engineers) of the Graduate T. E. I. of Western Greece as a test for assessing their progress in the mathematics course of their first term of studies. The results of their performance are shown in Table 1 below:
Table 1: The test’s data Department 1
% Scale Grade No. of students % of students
89-100 A 0 0
77-88 B 5 13
65-76 C 6 16
53-64 D 9 24
Less than 53 F 18 47
Total 38
Department 2
% Scale Grade No. of students % of students
89-10 A 0 0
77-88 B 1 3
65-76 C 5 17
53-64 D 3 10
Less than 53 F 20 70
Total 29
Then the first of formulas (2) gives that Xc = 7(0.47+2*0.24+3*0.16+4*0.13)-2=11.65
for the first and Xc = 7(0.7+2*0.1+3*0.17+ 4*0.03)-2=8.71 for the second Department.
Thus, according to the TFM the students of the first Department demonstrated a better total performance than the students of the second Department .
4. Discussion and conclusions
The methods of assessing a group’s performance usually applied in practice are based on principles of the bivalent logic (yes-no). However such methods probably are not the most suitable ones. On the contrary, fuzzy logic, due to its nature of including multiple values, offers a wider and richer field of resources for this purpose. This gave us the impulsion to introduce here an improved version of the TFM approach, which is a variation of the COG defuzzification technique fitting more properly to the ambiguous cases of students’ scores lying in the limits between two different grades. However, there is a need for more classroom experiments to be performed in future for obtaining safer statistical data. On the other hand, since the TFM approach is a general assessment method, our future plans for further research on the subject include also the effort to apply this approach in assessing the individuals’ performance in several other human activities.
REFERENCES
Michael Gr. Voskoglou
58
2. I.Ya.Subbotin, H.Badkoobehi, and N.N.Bilotckii, Application of fuzzy logic to learning assessment. Didactics of Mathematics: Problems and Investigations, 22, 38-41, Donetsk (2004).
3. I.Ya.Subbotin, H.Badkoobehi and N.N.Bilotskii, Fuzzy logic and learning assessment, Didactics of Mathematics: Problems and Investigations, 24 (2005) 112-118.
4. I.Ya.Subbotin and M.Gr.Voskoglou, Applications of fuzzy logic to Case-Based Reasoning, International Journal of Applications of Fuzzy Sets and Artificial Intelligence, 1 (2011) 7-18.
5. I.Ya.Subbotin and N.N.Bilotskii, Triangular fuzzy logic model for learning assessment, Didactics of Mathematics: Problems and Investigations, 41 (2014) 84-88.
6. I.Ya.Subbotin and M.Gr.Voskoglou, Language, mathematics and critical thinking: The cross influence and cross enrichment, Didactics of Mathematics: Problems and Investigations, 41 (2014) 89- 94.
7. I.Ya.Subbotin and M.Gr.Voskoglou, A Triangular Fuzzy Model for Assessing Students’ Critical Thinking Skills, International Journal of Applications of Fuzzy Sets and Artificial Intelligence, 4 (2014) 173-186.
8. M.Gr.Voskoglou, An Application of Fuzzy Sets to the Process of Learning, Heuristics and Didactics of Exact Sciences, 10 (1999) 9-13.
9. M.Gr.Voskoglou, Transition across levels in the process of learning: A fuzzy Model, International Journal 9of Modelling and Application, Univ. Blumenau, Brazil, 1 (2009) 37-44.
10. M.Gr.Voskoglou and I.Ya.Subbotin, Fuzzy models for analogical reasoning, International Journal of Applications of Fuzzy Sets and Artificial Intelligence, 2 (2012) 19-38.
11. M.Gr.Voskoglou, A Study on Fuzzy Systems, American Journal of Computational and Applied Mathematics, 2(5) (2012) 232-240.
12. M.Gr.Voskoglou, An Application of Fuzzy Logic to Computational Thinking, Advances of Pure and Applied Mathematics, 2(1) (2012) 18-32.
13. M.Gr.Voskoglou and I.Ya.Subbotin, Dealing with the fuzziness of human reasoning, International Journal of Appl0ications of Fuzzy Sets and Artificial Intelligence, 3 (2013) 91- 106.