w w w . i j m r e t . o r g I S S N : 2 4 5 6 - 5 6 2 8 Page 13
Adsorption study of Cu
2+ions from aqueous solution using
kaolinite and metakaolinite
Anguile Jean Jacques
1, Toung Eko Kevin
1, Tagne Guy Merlain
2, Kouotou
Daouda
2*, Ketcha Joseph Mbadcam
21
(Department of Chemistry, University of Science and Technique of Masuku, Gabon)
2
(Department of Inorganic Chemistry, Faculty of Science,University of Yaoundé I, Cameroon)
ABSTRACT
:
The adsorption potential of two samples of clays namely Kaolinite (KAO) and Metakaolinite(MKB) for the adsorption of Cu2+ ions from aqueous solution was investigated. The effects of pH, contact time,
adsorbent dosage and initial concentration of Cu2+ ions solution were studied on the adsorption feasibility onto
KAO and MKB. The maximum adsorption capacities of Cu2+ ions onto KAO and MKB were found to be 14.3
and 21.3 mg.g−1 respectively .The Dubinin-Kaganer-Radushkevich model’s revealed that, the Cu2+ ions
adsorption onto KAO and MKB was governed by physical adsorption and the equilibrium study obeyed the
Freundlich isotherm model. The kinetic investigation of Cu2+ ions adsorption onto KAO and MKB fitted well the
pseudo-first-order kinetic model.
KEYWORDS:Adsorption, clays, isotherms, kinetics, wastewaters,
I. INTRODUCTION
Due to their non-biodegradability and continual nature in wastewater, heavy metals have become a public health care. Their toxicity risk is still increased through accumulation in living organisms and following bioamplification in the food chain [1, 2]. Amongst heavy metals, Cu2+ ions are one of these widespread heavy metal ions to be followed up closely. It is well known that, Cu2+ ions is an essential metal in a the metabolism for some forms of life, thus, its accumulation in the human body causes some disorder such as brain skin, pancreas damage, heart diseases and central nervous system disorder. In the scientific literature, the Cu2+ ions are implicated in stomach and lung cancers due to its carcinogenic character, therefore, the World Health Organization (WHO), fixed the acceptable limit dose of Cu2+ ions in drinking water to 2.0 mg/L [3]. To limit its propagation, the adsorption of Cu2+ ions from wastewater is recommended before their rejection into the environment. To achieve this goal, the removal of Cu2+ ions from wastewater can be done using different techniques such as chemical coagulation, ion exchange, solvent extraction and adsorption. Among these above cited techniques, adsorption is the mostly appreciated due to its easier protocol, efficiency and low operation cost. And several adsorbents such as clays [4, 5] wheat shells [6], bagasse fly ash [7], modified goethite [8] and metakaolin-based geopolymer [9] have been successfully used for this purpose. A particular attention had been paid to clays which are available, cheaper and possessed interesting
chemical and mechanical properties. Additionally, clay minerals have shown various adsorption capacities for heavy metal ions [10]. Several studies have been reported on kaolinite clay for adsorption of heavy metals from aqueous solutions [4, 11]. In this present work, a natural kaolinite (KAO) and its thermal treatment form, metakaolinite (MKB) were proposed as potential adsorbents for the removal of Cu2+ ions from aqueous solution.
II. MATERIALS AND METHODS
2.1 PREPARATION OF ADSORBENT AND ADSORBATE
The metal salt of CuSO4.5H2O was obtained
w w w . i j m r e t . o r g I S S N : 2 4 5 6 - 5 6 2 8 Page 14 2.2 BATCH ADSORPTION PROCEDURE
The Cu2+ ions stock solution of 1000 mg/L was prepared then diluted to obtain the required concentrations ranging from 200 to 800 mg/L. The initial pH value of solution was adjusted using 0.1 N of the solutions of NaOH and HCl. For the batch experiment, 25mL of the aqueous solution of copper (II) ions in a 100mL conical flask with optimum amount of adsorbent and initial Cu2+ ions concentration was fulfilled by shaking for the desired contact time. The content of the conical flask was centrifuged for 30 min and the copper (II) ions concentration of the filtrate was analyzed using UV-spectrophotometer. The amount of Cu2+ ions adsorbed per unit mass of adsorbent (Qe, mg/g) was calculated using the following formula.
C
0Ce
Qe
xV
m
(1)
w
here, C0 and Ce (mg/g) are initial and equilibriumconcentration of Cu2+ ions respectively,
V (L) is the volume of the solution and m(g) is the adsorbent mass.
2.3 ADSORPTION KINETICS
In order to understand the mechanism of Cu2+ ions adsorption on the adsorbents studied, four kinetics models that were, the pseudo first-order, pseudo second- order, Elovich and intra particle diffusion were considered to interpret the experimental data of the adsorption. The pseudo first-order kinetic model equation [12] is represented in an integral form as:
ln (Qe–Qt)= ln(Qe) –K1t (2)
Where, Qe and Qt (mg/g) are the sorption capacities at equilibrium and at time t respectively, K1 (mg -1
min-1) is the rate constant of pseudo first-order kinetic model.
The pseudo second-order kinetic model [13] is expressed as:
2 2
1
t e e
t
t
Q
k Q
Q
(3)
Where, Qe and Qt (mg/g) are the sorption capacities at equilibrium and at time t respectively, k2(g.mg -1
.min-1) is the rate constant of pseudo-second order kinetic model.
The Elovich equation [14] is generally expressed as:
exp(
)
t tdQ
Q
dt
(4)Where, α (mg-1
.g.min-1) is the initial sorption rate , β (g.mg-1) is the desorption constant during any one experiment. The integrated and simplified equation is given by:
1
ln(
)
1
ln
t
Q
t
(5) The intraparticle diffusion kinetic model [15] can be written in the linear form as:
t
a
k
P
ln
idln
ln
(6)
Where, P is the percent removal of copper (II) ions at time t, Kid is the intraparticular diffusion rate
constant, a is a gradient whose value depends on the adsorption mechanism.
2.4 ADSORPTION ISOTHERMS
To evaluate the equilibrium adsorption data, three of the most widely used isotherms were chosen, namely the Freundlich, Dubinin-Kaganer-Raduskevich and Temkin isotherms. The general form of the Freundlich equation can be expressed by the Equation 7 as:
Qe = KfCe1/n (7)
Its linearized form is given by:
(8)
Where, Kf (mg/g (L/mg) 1/n) and n are the Freundlich
constants. The Dubinin-Kaganer-Raduskevich isotherm [16] is expressed by its linearized form Equation 9 below:
ln Qe = ln Qmax – βε2 (9)
Where, ε = RTln 1 + 1
𝐶𝑒 is called the Polanyi
Potential, Ea is the main energy of adsorption and gives information about the physical and chemical features of adsorption.
The Temkin isotherm is generally used in the linearized and rearranged form as Equation 10 and Equation 12 below:
Qe =B ln A+ B ln Ce (10)
Where, A (mg/L) is the equilibrium constant of binding corresponding to the maximum energy of binding, B (L/mg) is the constant related to the heat of adsorption. A plot of Qe versus ln Ce enables the determination of the isotherm constants A and B.
e f
e C
n K
Q ln 1ln
w w w . i j m r e t . o r g I S S N : 2 4 5 6 - 5 6 2 8 Page 15 III. RESULTS AND DISCUSSION
3.1 CHARACTERIZATION OF KAO AND MKB
The chemical composition of KAO and MKB adsorbents used in this study is summarized in Table 1. The analysis of Figure 1 clearly shows that the KAO sample is mainly composed of kaolinite mineral (K) as indicated from peaks existing at 2θ values of 12.46, 25, 31.56, 45.94 and 51.28 respectively. The XRD spectrum is matched with the JCPDS database file (PDF-01-089-6538). Whereas, the thermal treatment at 700 oC for 2 hrs decomposes the kaolinite structure into amorphous metakaolinite that has no diffraction patterns.
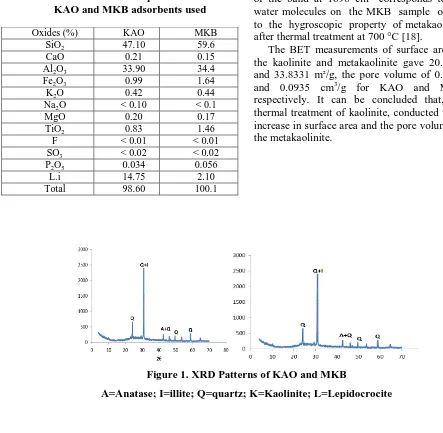
Table 1. The chemical composition of the KAO and MKB adsorbents used
Oxides (%) KAO MKB
SiO2 47.10 59.6
CaO 0.21 0.15
Al2O3 33.90 34.4
Fe2O3 0.99 1.64
K2O 0.42 0.44
Na2O < 0.10 < 0.1
MgO 0.20 0.17
TiO2 0.83 1.46
F < 0.01 < 0.01
SO3 < 0.02 < 0.02
P2O5 0.034 0.056
L.i 14.75 2.10
Total 98.60 100.1
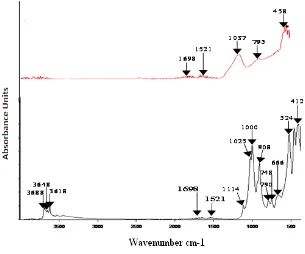
The FTIR spectroscopy analysis (Figure 2) shows a very strong and broad band at 3688-3620 cm−1 which corresponds to -OH stretching mode in the KAO [17].The characteristic sharp band at 908 cm−1 can be assigned to the Al−O−H bending vibration of kaolinite. The bands at 1114, 1025 and 1000 cm-1 on KAO sample correspond respectively to bending vibration of Si-O, Si-O-Si and Si-O-Al. For the MKB sample, the last band appears at 1037 cm -1
. The transformation of kaolinite to metakaolinite can be proved by the disappearance of the band at 3688-3620 cm-1 on KAO sample which corresponds to the dehydroxylation of kaolinite and the presence of the band at 1698 cm-1 corresponds to the water molecules on the MKB sample owing to the hygroscopic property of metakaolinite after thermal treatment at 700 °C [18].
The BET measurements of surface area of the kaolinite and metakaolinite gave 20.1819 and 33.8331 m²/g, the pore volume of 0.0814 and 0.0935 cm3/g for KAO and MKB respectively. It can be concluded that, the thermal treatment of kaolinite, conducted to an increase in surface area and the pore volume of the metakaolinite.
Figure 1. XRD Patterns of KAO and MKB
w w w . i j m r e t . o r g I S S N : 2 4 5 6 - 5 6 2 8 Page 16 Figure 2. FTIR spectra of KAO and MKB
3.2 BATCH ADSORPTION TESTS
3.2.1 EFFECT OF CONTACT TIME
The adsorption capacities of KAO and MKB were studied in the interval time of 10–150 min. The results
obtained showed that the equilibrium is reached after a contact time of 90 min both for KAO and MKB. From
the Figure 3, it can be seen that as the contact time increases the active sites on the two adsorbents were filled.
Figure 3. Effect of contact time on the adsorption of Cu2+ ions onto KAO and MKB
0 2 4 6 8 10 12 14 16 18
0 30 60 90 120 150
Qt
(mg/
g
)
t (min)
w w w . i j m r e t . o r g I S S N : 2 4 5 6 - 5 6 2 8 Page 17 3.2.2 EFFECT OF ADSORBENT DOSE
The uptake of Cu2+ ions on KAO and MKB was found to decrease while the adsorbent dose increases
(Figure 4). This can be explained by the fact that, as the amount of adsorbent increases, the total surface area
available for the adsorption of Cu2+ ionsreduces as a result of overlapping or aggregation of adsorption sites
[19].
Figure 4. The effect of absorbent dose on the adsorption of Cu2+ ions on KAO and MKB
3.2.3 EFFECT OF pH
The pH of aqueous solution is important to control parameters in adsorption efficiency [20, 21]. The pH value
of solution that changed with respect to the hydronium ions concentration influences the charges of sorbate and
adsorbent. The initial pH values of solution were varied from 2 to 4. The Cu2+ ions adsorption efficiency of KAO
and MKB are in the range of 30–50 % at strongly acidic conditions (Figure.5). This Incresing may be due to much
more number of hydronium (H3O+) ions than the number of hydroxylated Cu2+ ions which result in a hard
competition. Under such conditions, the clay surface interacts with water in an acidic medium forming complex
ions [22]. The complex ions with positive charge considerably prevent Cu2+ ions approaching the clay mineral
surface due to electrostatic repulsion and consequently the Cu2+ ions efficiency adsorption is reduced.
Figure 5. Effect of pH on Cu2+ ions adsorption on KAO and MKB
0 2 4 6 8 10 12 14
0 0.1 0.2 0.3 0.4 0.5
Q
e
(m
g/g)
mass (g)
KAO MKB
8 9 10 11 12 13 14 15 16 17 18
2 2.5 3 3.5 4
Q
e
(m
g/g)
KAO MKB
w w w . i j m r e t . o r g I S S N : 2 4 5 6 - 5 6 2 8 Page 18 3.2.4 EFFECT OF INITIAL Cu2+ CONCENTRATION
The Cu2+ ionsremoval efficiency (Figure 6) showed that the amount of Cu2+ ions adsorbed increases with
the increase in Cu2+ ions initial concentrations. This increase in Cu2+ ions concentration gradient was the driving force behind overcoming all mass transfer resistances of the copper, between the aqueous and
solid phase. It also led to an increase in the equilibrium sorption, until sorbent saturation was achieved.
Similar trend has been reported for adsorption capacity of tea ash, applied for fluoride removal [23].
Figure 6. Effect of initial concentration on Cu2+ ions adsorption on KAO and MKB
3.2.5 ADSORPTION KINETICS STUDIES
The straight-line plots of the various kinetic models are presented on Figure 7, Figure 8, Figure 9 and Figure
10, while the parameters for these models are given in Table 2. The values of R2 are closer to unity for the
pseudo-first-order model compared to the pseudo-second-order, Elovich and intra particle diffusion models.
Thus, the adsorption phenomenon of the Cu2+ ions adsorption on both materials followed the pseudo-first-order
model during the entire period of adsorption. This result is in contradiction with those found by others authors
who studied the removal of metal ions from aqueous solutions by natural geological materials [2, 4, 5, 14, 15].
Figure 7. Pseudo first order model’s plot on Cu2+ ions adsorption on KAO and MKB
0 5 10 15 20 25
500 600 700 800 900 1000
Q
e(m
g/g)
C0(mg/L)
MKB MKO
0 0.5 1 1.5 2 2.5
0 50 100 150 200
Ln
(Q
e
-Q
t)
t(min)
w w w . i j m r e t . o r g I S S N : 2 4 5 6 - 5 6 2 8 Page 19 Figure 8. Pseudo second order model’s plot on Cu2+ ions adsorption on KAO and MKB
Figure 9. Elovich model’s plot on Cu2+ ions adsorption on KAO and MKB
Figure 10. Intraparticle diffusion model’s plot on Cu2+ ions adsorption on KAO and MKB
3.2.6 ADSORPTION ISOTHERMS STUDIES
Values of K and n are calculated from the intercepts and slopes of the plots of lnQe versus lnCe for
Freundlich model. The term 1/n indicates the intensity of adsorption, in other words, the effectiveness of
0 2 4 6 8 10 12 14
0 50 100 150 200
t/Q
t
t(min)
KAO MKB
3 5 7 9 11 13 15 17
2 3 4 5 6
Q
t(m
g/g)
Lnt
KAO
MKB
1 1.2 1.4 1.6 1.8 2 2.2 2.4
2 3 4 5 6
Ln
R
Lnt
w w w . i j m r e t . o r g I S S N : 2 4 5 6 - 5 6 2 8 Page 20
adsorption. According to the Table 2, the adsorption is favorable, hence 1/n is less than unity. The
determination coefficients, R2, were used to compare the three isotherm models given by the figures 11, 12
and 13 below. As can be seen in Table 2, the Freundlich model showed a higher determination coefficient
than the D-K-R and Temkin models.
Figure 11. Freundlich model’s plot for adsorption of Cu2+ ions on KAO and MKB
Figure 12. Dubinin-Kaganer-Raduskevich model’s plot of Cu2+ ions on KAO and MKB.
Figure 13. Temkin model’s plot for adsorption of Cu2+ ions on KAO and MKB
1.83 1.84 1.85 1.86 1.87 1.88 1.89 1.9 1.91 1.92 1.93
6.2 6.4 6.6 6.8 7
Ln
Q
e
LnCe
KAO
MKB
1 1.5 2 2.5 3 3.5
6 10 14 18 22
Ln
(Q
e
)
ƹ2
KAO MKB
0 5 10 15 20 25
6.2 6.4 6.6 6.8 7
Q
e(
m
g/g)
Ln(Ce)
KAO
w w w . i j m r e t . o r g I S S N : 2 4 5 6 - 5 6 2 8 Page 21 Table 2: Kinetic models parameters of adsorption of Cu2+ ions onto KAO and MKB
Models Parameters Adsorbents
KAO MKB
Pseudo-first order Qexp (mg/g) 14.300 12.300
Qe (mg/g) 11.020 10.270
K1 (min-1) 0.016 0.015
R2 0.998 0.996
Pseudo-second order Qe(mg/g) 16.940 14.080
K2.10-3(g/mg.min) 2.040 3.190
R2 0.956 0.850
Elovich β (g/min) 0.270 0.260
α (mg/g.min) 1.268 1.120
R2 0.877 0.450
Intraparticle diffusion
Kid (min-1) 1.287 0.887
α -0.400 -0.479
R2 0.915 0.529
Ko 0.006 0.005
R2 0.732 0.279
IV. CONCLUSION
The thermal modification of KAO was confirmed
by FTIR spectroscopy, XRD and BET surface
analysis techniques. The best conditions of
adsorption were established, with respect to both pH
and contact time to saturate the available sites located
on the adsorbents surface. The pseudo-first-order
kinetic and Freundlich isotherm models precisely
explained the kinetic and equilibrium data
respectively. The adsorption quantities were 14.3
mg/g and 12.3 mg/g for KAO and MKB
respectivelyIn this study. Owing to the following
results obtained, KAO and MKB can be used as
adsorbents for the removal of Cu2+ ions from aqueous
solution
.
V. ACKNOWLEDGMENT
The authors thank gratefully all the members of the Research Unit: “Adsorption and Surface” of the
Applied Physical and Analytical Chemistry
Laboratory of the University of Yaoundé I for their
remarks and suggestions.
REFERENCES
[1] H.K. An, B.Y.Park, and D.S. Kim, Crab shell
for the removal of heavy metals from aqueous
solution, Water Research, 35(15), 2001,
3551–3556.
[2] M.J. Jiang, L. Xiao-ying, C., Xiao-Qiao, and
Zu-liang, Adsorption of Pb(II), Cd(II), Ni(II)
and Cu(II) onto natural kaolinite clay,
w w w . i j m r e t . o r g I S S N : 2 4 5 6 - 5 6 2 8 Page 22
[3] M.L.P. Dalida, A.F.V. Mariano, C.M.
Futalan, C.C. Kan, W.C. Tsai, and M.W.
Wan, Adsorptive removal of Cu(II) from
aqueous solutions using non-cross linked and
cross linked chitosan-coated bentonite beads,
Desalination. 275(1-3), 2011, 154–159.
[4] K.G. Bhattacharyya, and S.S. Gupta, Removal
of Cu(II) by natural and acid-activated clays:
An insight of adsorption isotherm, kinetic and
thermodynamics, Desalination, 272( 1-3),
2011, 66–75.
[5] C. Weng, C.Z. Tsai, S.H. Chu, and Y.Sharma,
Adsorption Characteristics of Copper (II) onto
Spent Activated Clay, Separation Purification
Technology. 54(2), 2007, 187–197.
[6] N. Basci, E.Kocadagistan, and
B.Kocadagistan, Biosorption of Copper (II)
ion from Aqueous Solutions by Wheat Shell,
Desalination, 164(2), 2004, 135-140.
[7] G V. Gupta, and I.Ali, Utilization of bagasse
fly ash (A Sugar Industry Waste) for the
removal of copper and zinc from wastewater,
Separation Purification Technology, 18(2),
2000, 131-140.
[8] W. Li, S. Zhang, and X.Shan, Surface
modification of goethite by phosphate for
enhancement of Cu and Cd Adsorption,
Colloids and Surfaces A: Physicochemical
Engineering Aspects, 293(1-3), 2007, 13–19.
[9] C T. Cheng, L.M. L.ee, M.S. Ko, T.H. Ueng,
S.F. Yang, The heavy metal adsorption
characteristics on metakaolin-based
geopolymer, Applied Clay Science, 56(1),
2012, 90–96.
[10] C.O. Jagbemi, M.H. Baek, and D.S. Kim,
Montmorillonite surface properties and
sorption characteristic for heavy metal
removal from aqueous solutions, Journal of
Hazardous Material, 166(1), 2009, 538–546.
[11] M. Arias, M.T. Barral, and J.C. Mejuto,
Enhancement of copper and cadmium
adsorption on kaolin by the presence of humic
acids, Chemosphere, 48(10), 2002, 1081–
1088.
[12] Y.S. Ho, Removal of metal ions from sodium
arsenate solutions using tree fern, Process
Safety and Environmental Protection, 81(5),
2003, 352–356.
[13] Y.S. Ho, Citation review of Lagergren kinetic
rate equation on adsorption reactions,
Scientometrics, 59(1), 2004, 171–177.
[14] G.M. Tagne, J.N. Ndi and K J.M.Ketcha,
Adsorption of Copper (II) Ions from Aqueous
Solution onto Synthetic Goethite and Two
Naturally Available Red Soils from
Yaoundé-Cameroon, British Biotechnology Journal,
3(3), 2013, 221-235.
[15] J.S. Essomba, J.N.Ndi, B.P.D. Belibi, G.M.
Tagne, and J.M. Ketcha, Adsorption of
cadmium (II) ions from aqueous solution onto
kaolinite and metakaolinite, Pure and Applied
Chemical Science , 2(1), 2014, 11-30.
[16] J.M. Ketcha, , S.Dogmo, , and D.Dingka’a,
Kinetic and Thermodynamic Studies of the
Adsorption of Nickel(II) Ion from Aqueous
Solution by Smectic Clay from Sagba-
Cameroon, International Journal cursus
Research, 4(5), 2012, 162-167.
[17] G. Fumba, J.S.Essomba, G.M.Tagne, J.N.Ndi,
B.D.P.Belibi, and J.M.Ketcha, Equilibrium
and Kinetic Adsorption Studies of Methyl
Orange from Aqueous Solutions Using
Kaolinite, Metakaolinite and Activated
Geopolymer as Low Cost Adsorbents.
Journal of Academia and Industrial Research,
w w w . i j m r e t . o r g I S S N : 2 4 5 6 - 5 6 2 8 Page 23
[18] K.H. Tchakoute, A. Elimbi, , J.A. Mbey,
S.C.Ngally, D.Njopwouo, The effect of adding
alumina-oxide to metakaolin and volcanic ash
on geopolymer products: A comparative study,
Construction Building and Materials, 35,
2012, 960-969.
[19] N.T. L.anganoa, K J.M.Ketcha, J.N.Ndi,
Kinetic and Equilibrium Modeling of the
Adsorption of Amaranth from Aqueous
Solution onto Smectite Clay, Research Journal
of Chemical Science, 4(2), 2014, 7-14.
[20] K.G. Bhattacharyya, and S.S. Gupta, Sorption
of Co(II) from aqueous medium on natural and
acid activated kaolinite and montmorillonite,
Separation Science and Technology, 42(15),
2007, 3391–3418 .
[21] G.K. Sarma, S.S. Gupta, and K.G.
Bhattacharyya, Methylene blue adsorption on natural and modified clays. Separation Science
and Technology, 46(10), 2011, 1602–1614.
[22] T. Mathialagan, and T.Viraraghavan,
Adsorption of cadmium from aqueous
solutions by perlite, Journal Hazardous
Material, 94(3), 2002, 291–303.
[23] N.K. Mondal, R.Bhaaumik, T. Baur,
B.A.Das, P.Roy, and J.K. Datta, Studies on defluoridation of water by tea ash: an
unconventional biosorbent, Chemical Science
Transactions, 1(2), 2012, 239–256.
Author Profile:
1. Anguile Jean Jacques, Associate Professor, Department of Chemistry, University of Science and Technique of Masuku, Gabon
2. Toung Eko Kevin, Msc. student, Department of Chemistry, University of Science and Technique of Masuku, Gabon
3. Tagne Guy Merlain, PhD student, Department of Inorganic Chemistry, Faculty of Science, University of Yaoundé I, Cameroon
4. Kouotou Daouda, Lecturer, Department of Inorganic Chemistry, Faculty of Science, University of Yaoundé I, Cameroon
5. Ketcha Joseph Mbadcam, Professor, Department of Inorganic Chemistry, Faculty of Science, University of Yaoundé I, Cameroon
Corresponding author: