UDC 316.77+613.2
DOI: 10.21668/health.risk/2018.4.13.eng
HOW TO EFFECTIVELY COMMUNICATE RISKS TO DIVERSE CONSUMERS
D. Petrova, R. Garcia-Retamero
Mind, Brain and Behavior Research Center, University of Granada, 36-38 Calle Real de Cartuja, Granada, 18071, Spain
The article outlines how to efficiently communicate risks described in numerical values to consumers. The issue is vital and its relevance is related to communication that applies numeric values is an essential part of informing consum-ers about hazards and advantages of food products; however, a lot of consumconsum-ers have difficulty perceiving digital infor-mation about risks due to various reasons. Consequently, such people assess risks inadequately and can't make well justi-fied decisions based on quantitative information. The authors explain that to remove numerical information and to re-place it with verbal description is not advisable as it doesn't allow to solve an issue of efficient risk communication. They also give examples that illustrate how wrong communication tactics can lead to risks aggravation or underestimation. The authors apply certain propositions to prove efficiency of tested risk communication formats, such as standard catego-ries, visual aids, conventional symbols, etc. It was detected that visual aids, or graphic images of information on risks, can eliminate a lot of problems and result in much better understanding of risks and decisions among diverse people. Such means are quite efficient when it comes to people with limited abilities related to perception of linguistic and nu-merical information, elderly people, highly educated people and population in general. The authors also give some posi-tive examples on how information was adapted for diverse consumers. They come to a conclusion that well-thought-out and transparent risk communication formats that incorporate natural cognitive strategies can make risk communications much easier. Better understanding, in its turn, often leads to conscious decision making by consumers and health-oriented decisions, intentions, and behavior.
Key words: consumer products, risk assessment, health risks, informing, risk communications.
One can attract customers' attention us-ing variable traditional and up-to-date com-munication channels. However, the challenge remains regarding how to communicate risk effectively to diverse audiences, especially when it comes to communicating numerical information. A growing body of research shows that many consumers have difficulty understanding numerical information about risk but such data are often an essential part in informing about risks. This paper dwells on various strategies that can help to improve risk communications regarding both individ-ual consumers and basic decision making (for example, risk comprehension and risk percep-tion). The research outlines formats that can either distort or improve perception and com-prehension. We recommend several tools that can help to reveal people who can get wrong comprehension about risks and suggest cer-tain approaches to creation of materials that
inform about risks and are adapted for a spe-cific audience.
Risk communications with numerical in-formation are an essential part of informing consumers about hazards or advantageous of food products. The increased data gathering and enhanced analytical capabilities of today make reliable risk assessment available and the results should be communicated to consumers. The spread of technology and the Internet gives us the opportunity to easily reach con-sumers through various traditional and modern communication channels. However, the chal-lenge remains regarding how to communicate risk effectively to diverse audiences. A grow-ing body of research shows that many con-sumers have low risk literacy – they have dif-ficulty understanding numerical information about risk. So, they can't make informed deci-sions based on numerical information. Thus, as per Galesic research [1], performed on
repre-Read online
__________________________
Petrova D., Garcia-Retamero R., 2018
Dafina Petrova – Candidate of Medical Science, postdoctoral researcher (e-mail: [email protected]; tel.: +34958245171; ORCID: https://orcid.org/0000-0002-0346-6776).
sentative national samplings, about a third of the United States and Germany citizens cannot perform basic probability operations such as transforming proportions to percentages; as a results, they do not know which risk is bigger: 1 in 100, 1 in 1000, or 1 in 10.
Avoiding numerical information and re-placing it with verbal labels is not a viable solu-tion to this problem. Research shows that using verbal labels to describe risks such as “rare”, “frequent”, or “common” results in very vari-able and often inaccurate interpretations by communication recipients [2]. Fortunately, re-search in risk communication has generated several important insights that can help us communicate risks to consumers in an effective and transparent way. In particular, research shows that low risk literacy is not necessarily caused by people’s cognitive limitations but is greatly influenced by a specific format of risk communication [3]. Here we briefly summarize several risk communication strategies that can help improve risk communication.
Avoid some risk communication for-mats and use recommended alternatives instead. Suppose that experts have detected salmonella in 3% of popular brand bagged salads currently on the market. When com-municating this risk to consumers, experts caution against using what has been termed the 1-out of-X format (i.e., 1 out of 33 salads on the market has been contaminated) [4]. Compared to other formats (percentages or proportions out of 100), the 1-out of-X format results on average in more worry and height-ened risk estimates, so it may unnecessarily scare consumers [5]. An alternative option would be to communicate the risk using per-centages. In this case, special attention should be paid to the reference class. To illustrate, research shows that if we communicate to consumers that “The risk of contaminated products is 3%”, about a third of consumers may mistakenly interpret this as for instance “3% of the leaves in each bagged salad are contaminated” [6]. In contrast, if we specify the reference class (i.e., 3% of bagged salad packages currently on the market are con-taminated) we would avoid this confusion.
The size of the reference class is also impor-tant, because it may convey information about the reliability of estimates (more reliable with larger sample sizes) or the total number of persons or units at risk.
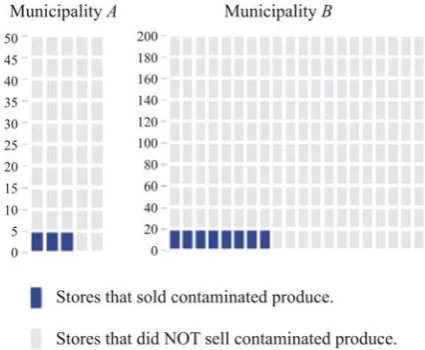
Special care should be taken also when comparing groups with different sizes. For instance, suppose that we communicate to consumers that contaminated salads have been found in 3 out of 50 stores in municipal-ity A and 8 out of 200 stores in municipalmunicipal-ity B. Research shows that up to half of commu-nication recipients may mistakenly infer that the risk is greater in municipality B (4%) than in municipality A (6%). This is because peo-ple often focus on the numerator in a fraction (3 vs. 8) and ignore or pay less attention to the denominator (the total number of stores in each municipality, 50 vs. 200) [7, 8]. To avoid confusion, experts recommend trans-forming the fractions using the same denomi-nator (6 in 100 stores in municipality A and 4 in 100 stores in municipality B). When that is not possible or desirable, visual aids can help (see Figure 1). The most popular visual aids used to communicate risk information include bar graphs, line graphs, and icon arrays.
square represents one store. Similar displays have been shown to facilitate risk compari-sons in different contexts [7, 8].
Figure 1. An example of icon arrays displaying the proportion of stores that may have sold contaminated produce in two municipalities
with a different number of stores.
Use validated screening tools to opti-mize risk communication. Visual aids are powerful tools but unfortunately, they are not equally effective for everyone. In particular, visual aids will help consumers as long as they have a moderate level of graph literacy that is a skill that allows them to extract data and meaning from graphical representations of quantitative information [11–13]. The effi-ciency of different risk communication strate-gies may also depend on the statistical nu-meracy of consumers, i.e., their ability to un-derstand and use mathematical expressions of probability [14]. Numeracy influences not only the extent to which consumers understand dif-ferent risk communication formats, but also their preference for receiving quantitative in-formation [15–17]. This suggests that tailoring information on the individual or average popu-lation level can increase risk communication efficiency (see [18] for an example from the medical domain). There are several validated tools that can help to adapt risk communica-tion to individual recipients or on average to the population level. The new Subjective Graph Literacy scale assesses people’s self-reported ability to process and use graphically
presented information [13]. In only one min-ute, it provides a reliable and valid assessment of consumers’ skills and risk communication preferences, making it especially efficient and user-friendly. There is also a more extensive scale measuring Objective Graph Literacy [11] that would be useful for more research-oriented applications. This scale uses test-like items and is a powerful predictor of perform-ance on diverse graph-related tasks in popula-tions with different cultural, educational, and demographic backgrounds [12].
Several measures of numeracy exist, in-cluding the Subjective Numeracy Scale [17] that is a useful addition to the Subjective Graph Literacy Scale. To measure objective numeracy with math-like questions one can choose among several instruments of varying length and difficulty [14, 19, 20]. For instance, the Berlin Numeracy Test (see riskliteracy.org) is among the most efficient stand-alone as-sessments of numeracy, risk literacy, and gen-eral decision making skill [21]. It provides a reliable assessment in 2–3 minutes and is suit-able for use with educated samplings from di-verse countries and cultures (e.g., college stu-dents, computer-literate adults, experts).
Conclusions. High level of education does not guarantee comprehension of risk communi-cations as even some highly educated, experi-enced professionals misunderstand important risk communications in their field of expertise [18, 22]. Subtle differences in risk communica-tion formats and misunderstanding of risk sta-tistics can have significant effects on compre-hension and subsequent decisions and behavior. Fortunately, there are solutions to the problem: well-designed, transparent risk communication formats that make use of people’s natural cog-nitive strategies can facilitate risk communica-tion. Improved comprehension in turn often leads to informed decision making by consum-ers and health-oriented decisions, intentions, and behavior [10, 23–25].
Funding. The research was not granted any sponsor support.
References
1. Galesic M., Garcia-Retamero R. Statistical numeracy for health: A cross-cultural comparison with probabilistic national samples. Archives of Internal Medicine, 2010, vol. 170, no. 5, pp. 462–468. DOI: 10.1001/archinternmed.2009.481
2. Lipkus I.M. Numeric, Verbal, and Visual Formats of Conveying Health Risks: Suggested Best Practices and Future Recommendations. Medical Decision Making, 2007, vol. 27, pp. 696–713.
3. Garcia-Retamero R., Galesic M. Transparent communication of health risks: Overcoming cultural differences. New York, Springer, 2013, 269 p. DOI: 10.1007/978-1-4614-4358-2
4. Sirota M., Juanchich M., Kostopoulou O., Hanak R. Decisive evidence on a smaller-than-you-think phenomenon: revisiting the “1-in-X” effect on subjective medical probabilities. Medical Decision Making, 2014, vol. 34, pp. 419–429.
5. Pighin S., Savadori L., Barilli E., Cremonesi L., Ferrari M., Bonnefon J. The 1-in-X Effect on the Subjective Assessment of Medical Probabilities. Medical Decision Making, 2011, vol. 31, pp. 721–729.
6. Gigerenzer G., Galesic M. Why do single event probabilities confuse patients? BMJ: British Medical Journal, 2012, vol. 344, рр. e245. DOI: 10.1136/bmj.e245
7. Garcia-Retamero R., Galesic M., Gigerenzer G. Do icon arrays help reduce denominator neglect?
Med Decis Making, 2010, vol. 30, pp. 672–684.
8. Okan Y., Garcia-Retamero R., Cokely E.T., Maldonado A. Individual differences in graph liter-acy: overcoming denominator neglect in risk comprehension. J. Behav. Decis. Making., 2012, vol. 25, pp. 390–401.
9. Garcia-Retamero R., Cokely E.T. Communicating health risks with visual aids. Curr. Dir. Psy-chol. Sci., 2013, vol. 22, pp. 392–399.
10. Garcia-Retamero R., Cokely E.T. Designing visual aids that promote risk literacy: A systematic review of health research and evidence-based design heuristics. Human Factors, 2017, vol. 59, no. 4, pp. 582–627. DOI: 10.1177/0018720817690634
11. Galesic M., Garcia-Retamero R. Graph literacy: a cross-cultural comparison. Med. Decis. Mak-ing., 2011, vol. 31, pp. 444–457.
12. Garcia-Retamero R., Petrova D., Feltz A., Cokely E.T. Measuring Graph Literacy: A Systematic Re-view and Meta Analysis. Oxford University Press. Available at: http://oxfordre.com/communication/ view/10.1093/acrefore/9780190228613.001.0001/acrefore-9780190228613-e-302 (16.04.2017).
13. Garcia-Retamero R., Cokely E.T., Ghazal S., Joeris A. Measuring graph literacy without a test: A brief subjective assessment. Medical Decision Making, 2016, vol. 36, pp. 854-867.
14. Lipkus I.M., Samsa G., Rimer B.K. General Performance on a Numeracy Scale among Highly Educated Samples. Medical Decision Making, 2001, vol. 21, pp. 37–44.
15. Trevena L.J., Zikmund-Fisher B.J., Edwards A., Gaissmaier W., Galesic M., Han P.K. [et al]. Presenting quantitative information about decision outcomes: a risk communication primer for patient decision aid developers. BMC medical informatics and decision making, 2013, vol. 13, pp. S7.
16. Garcia-Retamero R., Galesic M. Communicating Treatment Risk Reduction to People With Low Numeracy Skills: A Cross-Cultural Comparison. Am. J. Public. Health., 2009, vol. 99, pp. 2196–2202.
17. Fagerlin A., Zikmund-Fisher B.J., Ubel P.A., Jankovic A., Derry H.A., Smith D.M. Measur-ing numeracy without a math test: development of the Subjective Numeracy Scale. Med. Decis. Mak-ing, 2007, vol. 27, pp. 672–680.
18. Petrova D., Kostopoulou O., Delaney B., Cokely E.T., Garcia-Retamero R. Strengths and gaps in physicians' risk communication: A scenario study of the influence of numeracy on cancer screening communication. Medical Decision Making, 2018, vol. 38, no. 3, pp. 355–365. DOI: 10.1177/0272989X17729359
20. Weller J.A., Dieckmann N.F., Tusler M., Mertz C., Burns W.J., Peters E. Development and testing of an abbreviated numeracy scale: A rasch analysis approach. J. Behav. Decis. Making., 2013, vol. 26, pp. 198–212.
21. Cokely E.T., Galesic M., Schulz E., Ghazal S., Garcia-Retamero R. Measuring Risk Literacy: The Berlin Numeracy Test. Judg Decis. Making., 2012, vol. 7, pp. 25–47.
22. Garcia-Retamero R., Cokely E.T., Wicki B., Joeris A. Improving risk literacy in surgeons.
Patient Educ Couns, 2016, vol. 99, pp. 1156–1161.
23. Petrova D., Garcia-Retamero R., Cokely E.T. Understanding the harms and benefits of cancer screening: a model of factors that shape informed decision making. Med. Decis. Making., 2015, vol. 35, pp. 847–858.
24. Petrova D., Garcia-Retamero R., Catena A., van der Pligt J. To screen or not to screen: What factors influence complex screening decisions? J. Exp. Psychol. Appl., 2016, vol. 22, pp. 247–260.
25. Garcia-Retamero R., Cokely E.T. The influence of skills, message frame, and visual aids on prevention of sexually transmitted diseases. J. Behav. Decis. Making., 2014, vol. 27, pp. 179–189.
Petrova D., Garcia-Retamero R. How to effectively communicate risks to diverse consumers. Health Risk Analysis, 2018, no. 4, pp. 114–118. DOI: 10.21668/health.risk/2018.4.13.eng