Vol. 3, No. 2 (2013): 189-193 Research Article
Open Access
I
ISSSSNN:: 22332200--66881100
New RP-HPLC Method for the Estimation of
Repaglinide in Bulk and in Pharmaceutical Dosage
Forms
Pritosh Pattanaik*
1, Om Prakash Panda
2, Chandan Mohanty
3, Podila Naresh
11
Pratistha institute of pharmaceutical sciences, Durajpally, Suryapet, AP, INDIA
2
Deveena college of pharmacy, chivemlla, Suryapet , AP, INDIA
3
Vikas College of pharmaceutical sciences, Rayanigudem, Suryapet, AP, INDIA
* Corresponding author: Pritosh Pattanaik; e-mail: [email protected]
ABSTRACT
A simple reverse phase HPLC method was developed for the determination of Repaglinide present in pharmaceutical dosage forms. A Discovery HSF5 C18, 4.6mm x 250 mm, 5 µm column from Supelco (India), with mobile phase methanol: ammonium acetate buffer (pH-4) (80:20) was used. The flow rate was 1.0 ml/min and effluent was monitored at 240 nm. Ritonavir is used as internal standard. Calibration standards were prepared by spiking working standard solutions into methanol containing 5 mL volumetric flasks to yield concentrations
of 0.5, 1, 2, 5, 7.5, 10, 15, 20, 50, 100, 150, and 200 μg /mL. The retention times were 6.2 min and 5.2 min for REP and RIT respectively. The linearity range was found to be 0.5-200 g/ml for REP. The proposed method was also validated.
Keywords:
Repaglinide , Ritonavir, Retention timeINTRODUCTION
The term ‘Chromatography’ covers those processes aimed at the separation of the various species of a mixture on the basis of their distribution characteristics between a stationary and a mobile phase. Modes of chromatography are defined essentially according to the nature of the interactions between the solute and the stationary phase, which may arise from hydrogen bonding van der waals forces, electrostatic forces or hydrophobic forces or basing on the size of the particles (e.g. Size exclusion chromatography) [1]. The importance of Chromatography is increasing rapidly in pharmaceutical analysis. Another important field of application of chromatographic methods is the purity testing of final products and intermediates (detection of decomposition products and by-products). As a consequence of the above points, chromatographic methods are occupying an ever-expanding position in the latest editions of the pharmacopoeias and other testing standards [2].
MATERIALS AND METHODS
Instrumentation
A Dionex (USA) P680 HPLC pump was used to deliver the mobile phase to the analytical column, Discovery HSF5 C18, 4.6mm x 250 mm, 5 µm purchased from Supelco (India). Sample injection was performed via ASI-100 Automated sample injector (Dionex, USA). Detection was achieved by PDA-100 photodiode array detector (Dionex, USA)[3]. Chromeleon software (USA) was used for quantitative determination of eluted peaks. Degassing of solvents is achieved by helium sparing before use. Dissolution of compound was enhanced by sonication on Bandelin sonerex (Bandelin, Berlin). The pH of the solution was adjusted by using Digital pH Meter, Model DI 707 (Digisun electronics, Hyderabad, India). An UV spectrum of Repaglinide for selecting the working wavelength of detection was taken using a PDA-100 photodiode array detector (Dionex, USA) [4].
Standards and Chemicals
Repaglinide and Ritonavir used as an internal standard (IS) were gifts obtained from Aurobindo pharma (Hyderabad, India) and Ranbaxy Laboratories Limited (Mohali, India). Rapilintablets (SUN pharma. Ltd, India) and Eurepa tablets (TORRENT pharma Ltd, India)
containing 2 mg and 2 mg of Repaglinide, were purchased from local market. Purified water was prepared using a Millipore Milli-Q (Bedford, M.A., USA) water purification system. Methanol of HPLC grade was purchased from Burdick and Jackson (Muskagon, MI, USA), ammonium acetate of A.R. grade and formic acid of A.R. grade were purchased from local suppliers [5].
A 0.01 M solution of ammonium acetate (pH: 4.0) was prepared by dissolving 0.77g of ammonium acetate in 800 ml water and diluting to 1000 ml with water. The pH was adjusted to 4.0 with formic acid.
Method development
Preparation of standard drug solutions
Stock solution of Repaglinide was prepared by dissolving 25 mg of Repaglinide in 25 mL of volumetric flask containing 20 mL methanol. The solution was sonicated for about 20 min and then made up to volume with methanol. Daily working standard solutions of Repaglinide was prepared by suitable dilution of the stock solution with appropriate mobile phase. Similarly stock solution of internal standard was prepared by dissolving 25mg of Ritonavir in 25 mL of methanol.
Chromatographic conditions
The mobile phase used in this study was a mixture of ammonium acetate buffer (0.01M pH 4.0 adjusted with formic acid) and methanol 20:80v/v. The contents of the mobile phase were filtered before use through a
0.45μ membrane and degassed for 15 min. The mobile
phase was pumped from the solvent reservoir to the column at a flow rate of 1ml/min. The column temperature was maintained at 23±10C. The eluents
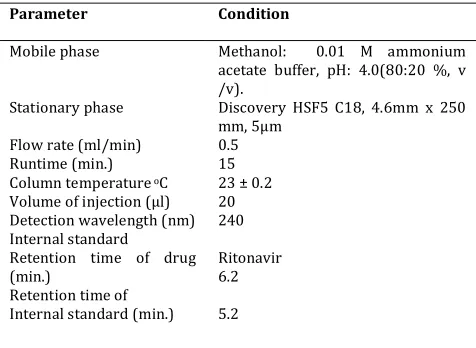
were monitored at 240nm. The identification of the separated Repaglinide and Ritonavir were confirmed by running the chromatograms of the individual compounds under identical conditions. The optimized conditions of Repaglinide were shown in Table 1.
Table 1. Optimized chromatographic conditions of Repaglinide
Parameter Condition
Mobile phase
Stationary phase
Flow rate (ml/min) Runtime (min.) Column temperature oC
Volume of injection (µl) Detection wavelength (nm) Internal standard
Retention time of drug (min.)
Retention time of Internal standard (min.)
Methanol: 0.01 M ammonium acetate buffer, pH: 4.0(80:20 %, v /v).
Discovery HSF5 C18, 4.6mm x 250 mm, 5µm
0.5 15 23 ± 0.2 20 240
Ritonavir 6.2
5.2
Calibration of standards
Calibration standards were prepared by spiking working standard solutions into methanol containing 5
mL volumetric flasks to yield concentrations of 0.5, 1, 2,
5, 7.5, 10, 15, 20, 50, 100, 150, and 200 μg /mL. To the above solutions 20 μg /mL of Ritonavir (internal standard) was added and the final volume was made up to the mark.
A 20-µL aliquot was injected in to the analytical column. Quantitative analysis based on peak area measurements as ratios towards the peak area of internal standard. Another standard solution was prepared separately for quality control. All the standard curves were checked with quality control samples.
Search for internal standard
Several drugs, whose structure and solubility resembles to standard drug, were added to standard solution of Repaglinide and dosage forms, and the resulted mixture was subjected to analysis according to the procedure.
Method validations
Method validation was performed in terms of sensitivity, specificity, linearity, LOQ, LOD, precision, accuracy, robustness and system suitability.
Specificity and selectivity
The specificity of the method was evaluated with regard to interference due to presence of any other excipients. Four different samples were injected and studied with respective excipients [6].
Linearity
To establish the range of linearity between drug concentration and detector response six replicates of analyte were measured.
Precision
To assess the precision of the method, intra-day and inter-day (days 3) measurements of Repaglinide were completed with computation of the coefficient of variation (C.V %) for replicate samples (n=6) using
concentrations of 20, 50 and 100 μg/mL. Both intra-day and inter-day samples were calibrated with standard curve concurrently prepared on the day of analysis [7].
Accuracy [8]
Intra-day and inter-day accuracy was evaluated by assaying quality control with different concentrations of Repaglinide. Intra- and inter-day accuracy was assessed by analyzing three quality control samples at each concentration on the same day and mean values of five samples for 3 days respectively. Accuracy was presented as percent error (relative error), [(measured concentration-added concentration) / added concentration] x 100 (%).
Limit of detection (LOD)
Limit of quantification (LOQ)
Limit of quantification was defined as the lowest concentration at which the precision was expressed by relative standard deviation (RSD) is less than 2% and accuracy expressed by relative difference in the measured and true value was also less than 2%. In other words, the analyte response is 10 times greater than the noise response. Five replicates of analyte were measured and quantified.
Robustness
The optimum HPLC conditions set for this method have been slightly modified for samples of Repaglinide (mg/mL) dissolved in the drug matrix as a means to evaluate the method ruggedness. The small changes include: the mobile phase ratio, the flow rate, the detection wavelength, the sonication time, the filtration system and the column.
System suitability
It is defined as tests to measure the method that can generate result of acceptable accuracy and precision. The system suitability was carried out after the method development and validation have been completed. For this, parameters like plate number (N), tailing factor (k), resolution (R), relative retention time (α), HETP,
capacity factor (kI), plates per meter and peak
symmetry of samples were measured.
Recovery of Repaglinide in tablets
Ten tablets were weighed, finely powdered and an accurately weighed sample of powdered tablets equivalent to 25 mg of Repaglinide was extracted with methanol in a 25mL volumetric flask using ultra sonicator. This solution was filtered through Whatmann No 1 filter paper. The solution obtained was diluted with the mobile phase so as to obtain a concentration in the range of linearity previously determined. An aliquot of the internal standard was added to the sample solution prior to the dilution so as to give a final concentration of internal standard
20μg/mL. All determinations were carried out in six
replicates [11].
RESULTS AND DISCUSSION
The developed method was used based upon its ability to detect and quantitate Repaglinide with the use of standard high-performance liquid chromatographic system equipped with UV-Visible detector.
Choice of stationary phase and mobile phase
A non-polar C-18 analytical chromatographic column was chosen as the stationary phase for the separation and determination of Repaglinide.
For the mobile phase a number of eluting systems were examined. The use of methanol, water and acetonitrile, at any ratio, solvent systems most frequently used for the separation of Repaglinide, resulted prolonged retention time and tailing. Therefore, the use of buffer with lower pH was found to be essential. For the optimization of mobile phase, concentration of buffer,
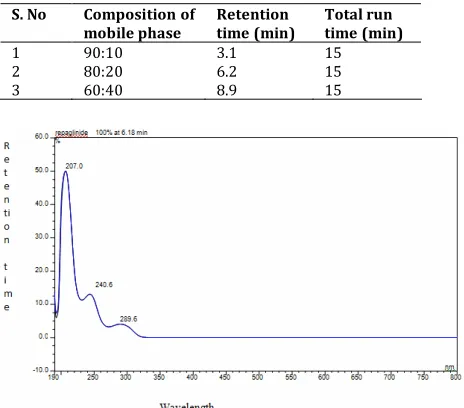
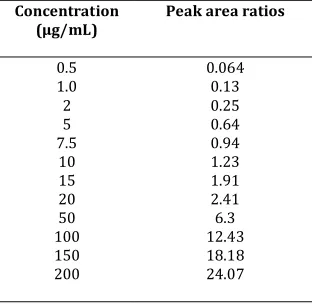
pH of buffer and composition of the mobile phase, many mixtures consisting of methanol and 0.01 M ammonium acetate buffer were examined at different conditions. The choice of the optimum composition based on chromatographic response factor. As shown in Table 2, a composition of 80:20 (%, v/v) methanol and 0.01 M ammonium acetate buffer, pH 4.0, provided an efficient separation of Repaglinide with sufficient retention time. A flow rate of 1.0 ml/min was found to be optimum from the studied range 0.5-1.5 ml/min as comprise between an optimum retention time, baseline stability and noise. An UV spectrum of Repaglinide was shown in fig 1.
Table 2. Optimization of mobile phase for the determination of Repaglinide
S. No Composition of mobile phase
Retention time (min)
Total run time (min) 1
2 3
90:10 80:20 60:40
3.1 6.2 8.9
15 15 15
Figure 1. UV spectrum of Repaglinide
Internal standard approach
In order to minimize the contribution of sample preparation, injection variation and column deterioration to the final results, the internal standard mode of quantification was applied. For this several drugs were tested. Amongst Ritonavir was considered as internal standard, because it fulfills the requirements for good internal standard; it possess similar physicochemical properties, go through all the steps of procedures, and elute close to analyte.
Method validation
Specificity and selectivityFigure 2. Blank spiked with 100 µg/mL of Repaglinide solution
Figure 3. Blank spiked with 20µg/mL of Ritonavir and 100µg/mL of Repaglinide
Linearity
Figures 2 and 3 illustrates HPLC chromatograms of
blank spiked with 100 μg/mL Repaglinide and blank
spiked with Repaglinide and 20 μg/mL of Ritonavir
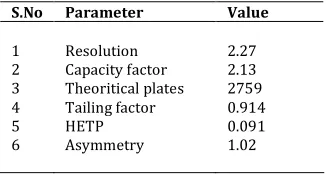
(IS). The total eluting time was less than 15 min. The standard curve was obtained in the concentration range of 0.5-200μg/mL. The linearity of these methods
was evaluated by linear regression analysis, which was calculated by least square method and shown in Figure 4.
Table 3. Linearity range of Repaglinide
Concentration (μg/mL)
Peak area ratios
0.5 1.0 2 5 7.5
10 15 20 50 100 150 200
0.064 0.13 0.25 0.64 0.94 1.23 1.91 2.41 6.3 12.43 18.18 24.07
Regression equation from 0.5-200 (μg/mL): Y=0.1209X+0.0613, (r2=0.9996)
The mean ± standard deviation (SD) for the slope, intercept and correlation coefficient of standard curves (n=6) were calculated. The represented data shown in Table 3.
Calibration Curve of Repaglinide
y = 0.1209x + 0.0614 R2 = 0.9998
0 5 10 15 20 25 30
0 50 100 150 200
Conc of Repaglinide (mcg/mL)
P
e
a
k
a
re
a
r
a
ti
o
Figure 4. Calibration curve of Repaglinide using HPLC method
Limit of detection (LOD) AND Limit of quantification (LOQ)
Limit of detection was found to be 5 ng/mL (signal to noise ratio 3) and Limit of quantification was found to be 17 ng/mL (signal to noise ratio 10).
Precision and accuracy
Method of validation regarding reproducibility (precision) and accuracy by replicates injection of standard solution at low, medium, and high concentration levels, where peak areas were measured in comparison to the peak area of the internal standard.
Intra-day precision and accuracy were studied by six replicate measurements at three concentration levels. Inter-day precision and accuracy were conducted during routine operation of the system over a period of 3 consecutive days. Statistical evaluation revealed that relative standard deviation of Ritonavir at different concentration for six injections was less than 2.0. Precision and accuracy data were shown in Tables 4 and 5.
Table 4. Precision of proposed HPLC method
Intra-day Inter-day
Conc taken
(μg/ml) Measured Conc
(μg/ml)±S.D
% coefficient
of variation
Measured Conc (μg/ml)
% Coefficient of variation
20
50
100
20.97 ± 0.1
50.16 ± 0.12
99.89 ± 0.14 0.47
0.23
0.14
20.02 ± 0.16
49.62 ± 0.21
98.99 ± 0.06
0.79
0.42
0.06
System suitability
For system suitability, six replicates of standard sample were injected and studied the parameters like plate number (N), tailing factor (k), resolution (R) and
relative retention time (α), HETP, capacity factor (kI),
Table 5. Accuracy studies
S. No Amount of drug Added (μg)
Mean ±SD amount (μg) recovered (n=6)
Mean ±SD % of recovery
1
2
3
20
50
100
20.12 ± 0.16
49.95 ± 0.22
101.15 ± 0.31
100.6 ± 0.8
99.9 ± 0.45
101.15 ± 0.31
Table 6. System suitability parameters of Repaglinide
S.No Parameter Value
1 2 3 4 5 6
Resolution Capacity factor Theoritical plates Tailing factor HETP Asymmetry
2.27 2.13 2759 0.914 0.091 1.02
Robustness
The tailing factor for Repaglinide was always less than 2.0 and the components were well separated under all the changes carried out. Considering the modifications in the system suitability parameters and the specificity of the method, as well as carrying the experiment at room temperature may conclude that the method conditions were robust.
The chromatographic method was optimized by changing various parameters, such as pH of the mobile phase, organic modifier and buffer used in the mobile phase. Retention of Repaglinide has more dependence on pH of the mobile phase when compared to Ritonavir. The separation of peaks was also dependent on pH of the buffer and the percentage of methanol.
Table 7. Amount of Repaglinide in tablet dosage forms by proposed HPLC method
Formulation Labeled amount (mg)
Mean ±SD (amount mg recovered) n=3
Mean ±SD ( % of recovery)
Ripilin
Eurepa
2
2
1.96 ± 0.15
1.95 ± 0.29
98.11 ± 0.42
97.39± 0.75
Under the presently prescribed conditions (Table 7), the recoveries of Repaglinide were found to be from 99.9 to 101.35 % respectively. A very low concentration of buffer (0.01 M ammonium acetate, pH
adjusted to 4.0 with formic acid) was used to reduce the tailing of Repaglinide. This method is very useful for determination of Repaglinide in pharmaceutical dosage forms, clinical studies and pharmacokinetic studies.
The differences of less than 2.0 % for both intra- and inter-day data reflect the accuracy of the method. The observation of C.V less than 2.0 for both intra- and inter-day measurements also indicates high degree of precision. In the present method, a Discovery HSF5 C18 column has been used and the buffer pH in the mobile is 4.0, which is within the limits (pH 2-8) specified by the manufacturers (Supelco). In the present method, we have established a linearity range of 0.5-200 μg
/mL; this linearity range covers all the strengths of Repaglinide. Hence this method can be applied for quantifying the low levels of Repaglinide in pharmaceutical dosage forms and other pharmacokinetic studies.
REFERENCES
1. High-performance liquid chromatography of amino acids, peptides and proteins: XXVII. Solvophobic considerations for the separation of unprotected peptides on chemically bonded
hydrocarbonaceous stationary phases Journal of
Chromatography, Volume 203, 9 January 1981, Pages 349-363. 2. Gandhimathi M et al. (2003). Ravi TK, Renu SK.Determination
of Repaglinide in Pharmaceutical Formulations by HPLC with UV Detection. Analytical Sciences 19 (12): 1675-1677. 3. Gumieniczek A, Berecka A, Hopkała H (2005). Quantitative
analysis of repaglinide in tablets by reversed-phase thin-layer chromatography with densitometric UV detection. Journal of Planar Chromatography - Modern TLC 18(2): 155-159. 4. Prameela Rani A, Bala Sekaran C, Archana et al. (2009).
Determination of repaglinide in pharmaceutical formulations by RP-HPLC method, B .Journal of Applied Sciences Research 5(10): 1500-1504.
5. Ruzilawati AB, Wahab MSAbd, Imran A et al (2007). Method development and validation of repaglinide in human by HPLC and its application in phae=rmacokinetic studies . Journal of Pharmaceutical and Biomedical analysis 43(5): 1831-1935. 6. ICH, Q2A, Textbook on validation of Analytical procedures,
International conference on Harmonization, Geneva, October, 1994,1.
7. Khan RH, Talegaonkar S, Singh RM (2007). A simple HPLC method for quantitation of repaglinide in tablet dosage form. Indian Drugs 44(6): 428-433.
8. ICH, Q2B, Textbook on validation of Analytical procedures, Methodology International conference on Harmonization, Geneva, November , 1996,1.
*****
© 2013; AIZEON Publishers; All Rights Reserved