School of Engineering and Information Technology
DC Microgrid Simulation and Control
Authored by: Sulaiman Khalifa Al Khusaibi
Academic Supervisor: Dr. Ali Arefi
i
Abstract
Microgrid is a small renewable distribution network that can be connected to the main utility
grid and can be operated in islanded mode or disconnected mode. There are two different
types of microgrid; ac and dc which depend on the type of renewable source. The variability
of renewable energy must operate in conjunction with traditional energy forms.
However, one of the primary challenges in the microgrid is controlling power electronic
devices when it is coordinated with the utility grid. The control system in the microgrid has
the main objectives, to ensure supply power to the critical loads, to connect and disconnect
the load in case of any fault occurring in the microgrid. This thesis investigates different
types of strategies used to control and manage a microgrid; also, the report considers
inverter control in islanded mode.
This thesis explores the ideas for controlling a microgrid in terms of voltage control in both
centralized and decentralized configurations. In more detail, simulations were carried out
on two control strategies; inverter control, and frequency control. The inverter control
method having the ability to bring the stable and efficient electricity to microgrid system has
attracted much consideration in recent years. The droop controller had the capability to
autonomously perform equal power sharing and maintain stability in islanded mode of
operation.
There are many existing dc microgrid around the world. Kythnos Island microgrid is one of
those existing microgrid, which can supply 12 houses within the island by using the inverter
controller, as the utility grid is located far away from the microgrid. However, this island is
either ac or dc loads, so some inverters and converters will be involved in the network.
The investigation used MATLAB /SIMULINK to simulate the microgrid network. Which done
by implementing the controller in the both ac and dc load. The performance measures such
as power sharing accuracy between the microgrid and diesel generator will be obtained.
The diesel generators used as a backup in the case of any fault occur in the microgrid. The
network simulations at different dc and ac loads will be simulating by using Simulink. This
then used to calculate the efficiency of the whole network through the Simulink. Then how
efficiency is can be used to upgrade the network as future scope.
Active and reactive power in the droop control has been commonly reported on and has
ii
the performance of microgrid in islanded mode; however, the result demonstrates that the
inverter controller performed well in the simulation of the Kythnos microgrid network. The
efficiency of the LVDC indicates that inverter controller with the ac load performance higher
efficiency compared to the dc loads.
Acknowledgements
I would like to thank first and foremost my supervisor Dr. Ali Arefi, for his support and
supervision over the course of this thesis. His broad depth of knowledge was helpful for
making this report possible. He has encouraged me to do my best to develop my academic
iii
Contents
Abstract ... i
Acknowledgements ... ii
List of Figures ... iv
List of Tables ... v
Glossary ... vi
1 Introduction ...1
1.1 Aim description ...2
1.2 Thesis Construction ...2
2 Background about Microgrids. ...2
2.1 Advantage and Disadvantage of Using Microgrids. ...4
2.1.1 Microgrid Architecture and Classification. ...5
3 Comparison between Alternative Current and Direct Current Microgrid. ...7
3.1 Low Voltage Alternative Current (LVAC). ...8
3.1.1 AC Microgrids...9
3.2 DC Microgrids. ... 10
3.2.1 Low Voltage Direct Current (LVDC). ... 10
3.2.2 DC Microgrids. ... 11
3.2.3 Efficiency between AC and DC microgrid. ... 13
3.2.4 Power electronic Converter in AC and DC Microgrid. ... 14
3.2.5 Comparison between AC and DC in distribution lines. ... 15
4 Microgrid control ... 17
4.1 Hierarchical Control Levels in the Microgrid ... 18
4.1.1 Primary Control. ... 18
4.1.2 Secondary control ... 18
4.1.3 Tertiary control ... 20
4.2 Droop Control ... 20
4.2.1 Voltage Source Inverter (VSI) with Droop control ... 22
4.2.2 Active and Reactive (PQ) inverter with Droop Control... 23
4.3 General Method of Control ... 24
4.3.1 Single Master Operation (SMO)... 24
4.3.2 Multi-Master Operation (MMO). ... 25
4.3.3 Secondary load frequency control ... 26
iv
5.1 System Configuration ... 27
5.2 Battery Inverter Operation. ... 29
5.3 Cost ... 29
5.4 MATLAB/Simulink: Simulation of Kythnos Island Microgrid. ... 30
5.4.1 Power and Voltage Control in the Simulation Network. ... 34
5.4.2 Simulation Results for the network of the Alternative and direct current Microgrid ... 41
5.4.3 Comparison between AC and DC Microgrid simulation network. ... 47
6 Conclusion. ... 48
6.1 Future scope of work for the DC Microgrid simulation and control ... 48
7 Bibliography ... 50
8 Appendix. ... 53
8.1 Appendix Part A. Simulink, SimscapeTM and SimPower SystemsTM. ... 53
8.2 Appendix Part B ... 55
List of Figures
Figure 1 General Structure of AC Microgrid [2]. ...3Figure 2 General Structure of DC Microgrid [2]. ...4
Figure 3 Microgrid Architecture [5] . ...5
Figure 4 Microgrid Structure [5] ...6
Figure 5 Typical Configuration of the DG units with LVAC network [8]. ...8
Figure 6 AC Microgrid Structure with the DG units [8]. ...9
Figure 7 Typical Configuration of the DG units with LVDC network [8]. ... 11
Figure 8 Concept of a DC Microgrid system with the DG [8] ... 12
Figure 9 Efficiency of AC and DC Microgrid [15] . ... 14
Figure 10 Single Phase Full Bridge Inverter with LC Filter [16] . ... 15
Figure 11 Hierarchical Control Level in the Microgrid [21] . ... 18
Figure 12 Secondary v Primary Control Responses (a)frequency restoration (b) voltage restoration [25] . ... 19
Figure 13 Secondary Control for Active and Reactive Power [26] ... 19
Figure 14 Simple Microgrid with an interfaced inverter system [28] . ... 21
Figure 15 Droop Control (a) Active Power and Frequency (b) Reactive Power and Voltage droop control [26] . 22 Figure 16 Load Sharing between two Generators [30]. ... 22
Figure 17 Voltage Source Inverter with Droop Control [31]. ... 23
Figure 18 Active and Reactive Power (PQ) Inverter Control [26]. ... 23
Figure 19 Control Scheme for Single Master Operation [31] . ... 25
Figure 20 Control Scheme for Multi-Master Operation [31] . ... 26
Figure 21 Local secondary load frequency control for controllable Micro sources [31] . ... 27
Figure 22 Overview of the Microgrid system on the Kythnos Island [37]. ... 28
Figure 23 Kythnos Microgrid... 31
v
Figure 25 MATLAB/ Simulink Model of Complete Kythnos Microgrid power Circuit with Diesel Generator ... 33
Figure 26 Output voltage waveform of a full bridge Inverter with L filter ... 34
Figure 27 Diesel Generators in the Microgrid power Circuit ... 34
Figure 28 A Frequency Control Block Diagram ... 35
Figure 29 Single Line Diagram of one phase. ... 35
Figure 30 A voltage Control Block Diagram ... 37
Figure 31 MATLAB Function for the voltage Controller. ... 38
Figure 32 MATLAB Code for the voltage Controller ... 38
Figure 33 Voltage Controller with the Repeating Sequence ... 39
Figure 34 MATLAB Simulink Model for a Single Inviter of Microgrid Power circuit. ... 40
Figure 35 MATLAB Simulink Model of a Complete Microgrid Grid Power Circuit... 41
Figure 36 Output Voltage Waveform of full Bridge Single Phase Inverter ... 42
Figure 37 Output Voltage Waveform of full Bridge Single Phase Inverter for the simulation Used. ... 42
Figure 38 Output Voltage waveform of full bridge Inverter with L filter ... 42
Figure 39 Breaker 1, 2 and 3 setting faults ... 43
Figure 40 Output Waveform of Uncontrolled Island Mode of Operation of a Microgrid ... 43
Figure 41 Output waveform of controlled Island Mode operation of a Microgrid using rectangular waveform as a carrier single of PWM ... 44
Figure 42 Real and Reactive Power During Controller Mode ... 45
Figure 43 Schematic Diagram of the LVDC Distribution System ... 45
Figure 44 MATLAB/Simulink Model of a complete Microgrid Power circuit with DC Load ... 46
Figure 45 Output Voltage waveform of a full bridge converter with DC/DC buck converter ... 47
Figure 46 DC-DC PWM Generator with Modulation of 0.8 ... 47
Figure 47 IGBT Switch for the Network. ... 53
Figure 48 Bipolar Pulse Width Modulation (PWM). ... 54
Figure 49 Load Parameters for the Network ... 54
Figure 50 Diesel Generator Control Through Breaker Control ... 55
List of Tables
Table 1 Typical Characteristics of Common Distribution Generator Sources [7]. ...6Table 2 Basic Feature of Suitable Storage Devices in Microgrid System [7] ...7
Table 3 Different Communication Systems Applicable in Microgrid [7] . ...7
Table 4 Typical Example of Home AC Powered Appliances [8] , [9] ...9
Table 5 Typical Example of AC Microgrid Systems [8] , [9] . ... 10
Table 6 Typical Example of Home using DC Power Application [8] ... 12
Table 7 Typical Example of DC Microgrid Systems [8]. ... 13
Table 8 Comparison between AC and DC distribution Lines [8] . ... 16
Table 9 Analysis of AC and DC circuit [8] . ... 16
Table 10 Investment Cost for the Farmer's PV System [39]. ... 29
vi
Glossary
AC Alternative Current
BMS Battery Management System DC Direct current
DER Distributed Energy Resources DG Distributed Generations
DILC Distributed Intelligent Load Controller DPC Direct Power Control
GPRS General Packet Radio Service IGBT Insulated Gate Bipolar Transistor
LC Local controllers
LVDC Low Voltage Direct Current MC Micro Source Controller MG Microgrid
MGCC Microgrid Central Controller MMO Multi Master Operation
MS Micro Sources
PLC Power Line Communications PQ Active Power and Reactive Power PV Photovoltaic
PWM Pulse Width Modulation SG Synchronous Generator SMO Single Master Operation SOC The State of Charge.
ST Switching Table
1
basis. Which is above the boundaries of the traditional grid and development it depends
on fossil fuels, and increase the amount of the CO2 emissions. These things have
renewed the activity in finding out ways to decrease power demand on the grid through
alternative energy; that is, renewable energy. The main application of the renewable
energy is Photovoltaic (PV).
As the common of electronics are operating on direct current and to the renewable
energy system, for example, PV power system generating dc power energy usage. With
the advance of this, the power inverters technology has tested regarding connecting to
the energy resources to the main utility grid. However, it is predictable that the inverters
connected in parallel as to supply power to the loads. Therefore, how to control these
inverters becomes more challenging. Also how to share the power within those inverters,
this occurs when the load demand change.The droop control is used to settle the power
sharing between the inverter and conventional technology, this type of controller not
required mechanical communication to achieve sharing power automatically.
The microgrids can operate in two ways of islanded mode or grid connected. In the
islanded mode the microgrid is disconnected from the main utility grid and can be
operated independently, by this mode the network can satisfy the local load requirement.
Operating in island mode can protect the components in the case of any fault will occur
in the microgrids.
This report will explore the different technology used in the dc microgrids and the
performance of inverter control approach. Moreover, based on the research on the
existing microgrid network around the world it will be simulated by using the
MATLAB/Simulink.
The system simulation will be simulated based on the assumption and approach that
consider being implemented as a case study for this project, which due to the availability
of network data and MATLAB/SIMULINK block as the limiting of the block is 100 in each
workstation. The case study will be about Kythnos Island microgrids to simulate and
2
1.1 Aim description
The aim of this thesis project is to get familiar with the principle of voltage control method
operating in the purely resistive network. Moreover, the project is developed to simulate
the case study of existing microgrids with using inverter control to control the network.
Comparison between two different ac and dc loads, based on the low voltage DC supply
(LVDC).
1.2 Thesis Construction
This project will evaluate the network of simple dc microgrid controller at two different
types of loads dc and ac load with the inverter control. Then the power sharing between
three parallel Inverters. The report is divided into five chapters. Chapter 1 will explore
the entire thesis work. Chapter 2 will review the background about microgrid, advantage
and disadvantage of using microgrids. Chapter 3, illustrate the comparison between
alternating current and direct current microgrid. This chapter will also explore the main
difference between two microgrids, following be calculating the efficiency when the
LVDC supply to the ac and dc loads.
In Chapter 4, different types of control will be explored, in terms of the control schematic,
mathematics block diagram and the development based on the research paper. In
Chapter 5, the case study of the existing microgrid will be simulated by using the
MATLAB/SIMULINK at different loads.
Also, it provides all the result of the projects. Chapter 6 will conclude the project and
recommend improvements to the conventional inverter control.
2
Background about Microgrids.
A microgrid is fundamentally a low or medium voltage distribution network which consists
of a grouping of an electricity source and loads. There are different types of
micro-sources, for example; fuel cell, wind turbine, and photovoltaic array, which are called
distributed generators (DG). Moreover, the microgrid can be locally controlled from that,
they can disconnect from the grid when there is any fault that could occur in the main
grid [1]. Microgrid could categorize into different groups based on the type, size,
application, and connectivity.
a) Type of microgrid, for example, campus, residential, commercial, industrial and
3
b) The size of the microgrid classified into three sizes small, medium and large scale.
c) Application of the microgrid such as premium power, resilience-oriented, and loss
reduction. The connectivity of microgrids either remote or grid connected.
Moreover, microgrid types can be identified based on the voltage and current modified
which are; alternating current (ac) microgrid, direct current (dc) and hybrid microgrid.
In the ac microgrid, all the distributed energy resources (DER) and loads are attached
to a common ac bus as shown in Figure 1. Then dc generating units, as well as energy
storage, will be connected through ac bus via dc to ac inverters, and further ac to dc
rectifiers used for supplying dc loads [2] .
Figure 1 General Structure of AC Microgrid [2].
In dc microgrids, the common bus is dc, where ac to dc rectifiers used for connecting
AC generating units. Also, a dc to ac inverter is used for supplying ac loads, as shown
in Figure 2. Hybrid microgrids can be considered as a combination of both ac and dc
microgrid, where both types of buses exist, and the kind of connection to each bus
depends on the proximity of distributed energy resources (DER) and load to the bus. In
depth explanation, the difference between ac and dc microgrid will be explained in
4
Figure 2 General Structure of DC Microgrid [2].
2.1 Advantage and Disadvantage of Using Microgrids.
An increased demand for using microgrids is very promising for the electrical energy
industry as the following benefits: environmental, operation, power quality, cost saving
and market. In the environmental, it reduces carbon footprint, then in operation and
investment, by a decrease of the physical and electrical distance between the micro
source and loads. Could be contributing to main benefits, that is an advance of reactive
support of the whole system, which in turn will enhance the voltage profile. Power quality,
as microgrid increase reliability locally through the establishment of a specific reliability
improvement plan.
This combines redundant distribution, automation, smart switch, power generation and
energy storage [3].Then, cost saving affecting by two ways: Firstly, by utilization of waste
heat in combined heat and a power mode of operation, as the source located nearby the
customer loads, no essential infrastructure is required for heat transmission. Secondly,
cost saving also made through the integration of several micro sources.
Even though there are potential benefits to the development of microgrids, it could face
potential difficulties. Most of these could be overcome by time and encouragement of
the government and customer. Disadvantages of the microgrid are:
a) High charges of distributed energy resource: the most affecting difficulty for
the microgrids is the high installation cost.
b) Lack of standards: as microgrids quite new area, and the standards are not
5
2.1.1 Microgrid Architecture and Classification.
The simple architecture of a microgrid system is shown in Figure 3. A microgrid system
consists of four parts: Distribution System, DG sources, Energy Storage, Control and
Communication Modules.
Figure 3 Microgrid Architecture [5] .
Classification of microgrid systems mainly based on the selection of the above
components and the integration with the main electrical grid network. The classification
which shows in Figure 4 as the primary structure of this classification which are:
a) Distribution Systems: such as transmission line, distribution networks, and
technologies. Available technologies for microgrid are studied in where the
line frequency ac and dc technologies that consider for transmission and
distribution system.
b) Distributed generation resources: The technologies related for microgrid may
include a sort of technologies such as (PV) system and wind turbine. Table 1
6
Figure 4 Microgrid Structure [5]
Table 1 Typical Characteristics of Common Distribution Generator Sources [7].
Characteristics Wind Solar Micro-Hydro
Availability dependent Cerographic location
Output power AC DC AC
Control Uncontrolled
Converter
(AC-DC-AC) (DC-DC-AC)
Synchronous or Induction generator Power Flow Control MPPT, Pitch and Torque
control(+P, −+𝑄)
MPPT & DC link voltage controls(+ P, 𝑄
−
+ ) Controllable (+P, 𝑄 −
+ ))
c) Storage devices: one of the primary requirement for efficient operation of a
microgrid is the inclusion of energy storage device, which used as balances
the power and energy demand with generation. There are three types of
energy storage methods have been established so far, and they are flywheels,
batteries and a super capacitor. Table 2 shows three of basic types of storage
7
Table 2 Basic Feature of Suitable Storage Devices in Microgrid System [7] .
Basic features Battery Flywheel Super-capacitor
Continuous power [W/kg] 50-100 200-500 500-2000
Typical back up time 5-30 min 10-30s 10-30s
Losses at standby Very low Variable High
Environmental Impact Medium High Low Low
d) Control and Communication Modules: the communication systems for power
control and protection. The primary communication technique with their
characters shown in Table 3. There are different types of the communication
systems using in the microgrid which are GPRS, 3G, WiMax, and PLC. There
are various methods used to chose the communication network whcih are
data transfer, cover range and limitations. WiMax, for instance, has fast data
transfer ratio (up to 75 Mbps) and large coverage range, but the limitation is
that spectrum fees are costly. In PLC communication systems, data rates are
in the range of 2-3 Mbps and coverage ranges between 1 to 3 Km as shown
in Table 3. For the long-distance communication, WiMAX and 3G used for
short distance communication, PLC systems are preferable [7] .
Table 3 Different Communication Systems Applicable in Microgrid [7] .
Technology Spectrum Data Rate Coverage Range [Km]
Applications [AMI]
Limitations
GPRS 900–1800MHz Up to 170 Kpbs 1–10km Demand Response, HAN
Low data rates
3G 1.92– 1.98GHz 384 kbps to 2 Mbps
1–10km Demand Response, HAN
Costly spectrum fees
WiMax 2.5, 3.5, 5.8 GHz Upto 75 Mbps 10–50 km Demand Response, HAN
Not wide spread
PLC 1–30 MHz 2-3 Mbps 1–3 km Fraud Detection Harsh, noisy channel env
3
Comparison between Alternative Current and Direct Current
Microgrid.
In this section, the comparison between two types of microgrids will be explained in
different ways, from architecture difference, distribution lines, power electronic
converter, and efficiency. The comparison will be based on the literature review and
simulation using MATLAB/Simulink software tools to simulate ac and dc microgrids of
the existing microgrid in Europe. Kythnos microgrids in Greece are considered to be the
case study for the comparison over the project in terms of the simulation the network
8
3.1 Low Voltage Alternative Current (LVAC).
All the electricity generating units (for example DG units) with the ac power supply the
output are directly connected to an ac bus line, which then connected to the main
network through power converters . ac output power can be produced by DG units which
include wind turbines, biogas, tidal and wave turbines. Those DG generally directly
connected or might require the ac/dc/ac power converter which used to enable their
stable coupling with the low voltage altranative current system [8].
Additionally, the ac load are directly connected to ac bus whereas the dc loads need
power converters ac/dc to attach to the LVAC networks. Alternatively, any DG units
which produce dc power output for example solar photovoltaic arrays (PV) and fuel cells
with energy storage devices like battery chargers could be connected to the ac bus line
by using the dc/ac inverters. The typical configuration of the DG units with the ac power
output is a wind turbine, and dc power outputs are PV system and fuel cells which
connected to the LVAC network as shown in Figure 5 [8] .
9
3.1.1 AC Microgrids
The standard ac microgrid system consistent with medium voltage system at the point
of common coupling (PCC) is shown in Figure 6, which the primary system could be ac
or dc bulk system. The distributed generation units and energy storage system (ESS)
connected around points within the distribution networks. Then part of the network
involving the DG units and load circuits could form a small isolated ac electric power
system, which is known as ac microgrid [8].
Figure 6 AC Microgrid Structure with the DG units [8].
During the normal operation conditions, both the networks are interconnected at the
point of common coupling and the loads are supplied from the local sources, for
example, the renewable energy sources (RES) based on the DG units.
In the case of the load demand power is less than the power which produced by the DG
units, then the excess power can be exported to the main system. Table 4 indicates
some of the typical examples of the ac power load that are in our homes.
Table 4 Typical Example of Home AC Powered Appliances [8] , [9]
SI.no AC powered Loads Voltage Ratings(V) Current Ratings (A) Power Ratings
1 Microwave oven 240 - 8.3K
3 Toaster 120 - 1050
5 Electric clothes drier 240 - 5600
6 Electric cook-top 240 - 8.8
7 Refrigerator 120 8.3 -
10
Implementations of ac microgrid system over the world shown in Table 5. The voltage
level is varying between one phase to three phase which is based on the DG units, and
most of the microgrid using same frequency 50 Hz. As illustrated in Table 5. Kythnos
microgrid in Greek Island the main DG unit is PV arrays with the Diesel Generators used
as a backup in case of fault or maintenance in the PV arrays. The supply voltage is three
phases but all the house in the Kythnos supply by one phase LVAC, more explanation
will be in the simulation of ac microgrid.
Table 5 Typical Example of AC Microgrid Systems [8] , [9] .
Locations AC microgrid Components
Voltage Level
Frequency Capacity
Kythnos, Greek Island
PV arrays,
diesel generators, battery Banks
One Phase LVAC
50 Hz 12 kWp from PV system, 85 kWh from battery bank
Hachinohe, Japan
PV arrays & BESS- rural areas
Not specified
50 Hz 0.5–10kWperhousehold
Japan Gas engines (GEs), wind turbine (WT), EDLC and BESS
110, 230, 240 V
50,60 Hz 50kW–2MW
Porto, Portugal
Fuel cells, PV arrays, WTs, ESSs and AC utility
400 V 50 Hz 50–200kW
3.2 DC Microgrids.
3.2.1 Low Voltage Direct Current (LVDC).
The LVDC network which used for business power supply and commercial buildings are
increasing day by day. Moreover, in the future, the dc supply system will turn into an
alternative way to provide all the electrical equipment connected to a bus system and
optimally controlled through an energy management system (EMS). The PV system one
of the primary example of the DG unit supply dc, which has an exceptionally modular
structure with a lot of potential structure available in which the PV inverter could be
connected [8].
The developed structures of LVDC networks designated as the central or string inverter.
This way, the Direct current based on the DG unit and the energy storage system (ESS),
which produced the dc Power, will be easily connected to the LVDC network or the bus
11
In the Energy storage system could be charged/discharged with the LVDC network and
at different loads either ac load or dc load, which connected to the network [8] [10]. That
in the case of the DG unit is based on the dc, but when the ac power generations units
on the LVDC network then it required ac/dc power converter for their connection. In
Figure 7 shows the LVDC network with the different types of DG units which are
connected to it through the common bus bar at the point of common coupling (PCC).
Based on the DG units that, for instance, ac based (Wind turbines) is connected to the
network requires ac/dc inverters, while the dc-based (for example PV and fuel cells) are
directly connected to the LVDC as shown in Figure 7.
Figure 7 Typical Configuration of the DG units with LVDC network [8].
3.2.2 DC Microgrids.
The dc power systems have been utilizing in a different field for instance in
manufacturing power distribution systems, telecommunication infrastructures, and
point-to-point transmissions over long distances for interconnecting ac grids at a various range of frequencies. Moreover, most of today and future equipment’s are dominated by power
electronic devices.
Different devices used the dc power for their operation, for instance, personal computer,
12
All these dc devices main supply is ac power then it required conversion of the available
ac power into dc for use, and most of these conversions used inefficient rectifier
[8].Furthermore, the power from dc converted into ac to tie with the existing ac electrical
network, which later converted to dc for the user, it will cause at some stage in
substantial energy losses. The Low voltage direct current supply (LVDC) network is a
new idea which is main option to challenge the current power supply issue and realize
the future power system [8], [11]. The dc microgrid system interconnected shown in
Figure 8 with the primary systems at the point of common coupling (PCC), which could
be medium voltage ac network from the traditional power plants, with the different types
of loads.
Figure 8 Concept of a DC Microgrid system with the DG [8]
Table 6 illustrates some of the examples using dc powered appliances at home. As a
result from the Table that the voltage ratings from 5 to 20 volt. In Table 7 shows the
typical example of the dc microgrid systems used as a testing model.
Table 6 Typical Example of Home using DC Power Application [8]
SI.no DC powered Loads Voltage Ratings(V) Current Ratings (A) Power Ratings(w)
1 Laptop computer 20 4.5 -
2 Cell phone 5 550 mA -
3 Wireless Phones 6.5 500 mA -
5 Battery Powered Vacuum Cleaner 10 250 mA -
6 Cable Modems 12 750 mA -
13
Table 7 Typical Example of DC Microgrid Systems [8].
DC Microgrid Components Voltage Range Capacity Sweden UPN AB for Data Center IBM 24–350/380LVDC(bipolarDC-link) ≥5MW Japan NTT Group for data Center 380/400 LVDC (bipolar DC-link) ≥5MW New Zealand Telecom NZ for data Center 220 LVDC (bipolar DC-link) 0.5–5MW The US Intel Corp for data Center 400 LVDC (bipolar DC-link) ≥5MW
In the situation of dc microgrid arrangements, the low voltage dc (LVDC) links are based
on a bipolar structure where the loads can be connected to the positive polarity and the
ground or between the two polarities [8].
An improvement the efficiency of delivering power to the distribution system can be
through by using the LVDC distribution network. It guarantees a higher power quality to
the customers than in the present distribution network and assists more DG unit’s
connection [12] .
3.2.3 Efficiency between AC and DC microgrid.
The most significant factor uses to measure the comparison between ac and dc
microgrid is the efficiency, with the same DG unit but at different Load. There are two
main differences which are the battery positions and electrical devices (inverter and
converter) of loads. However, Figure 9 shows both off as efficiency measurement, the
most impact of the energy calculations of the efficiency are:
a) In ac microgrid battery bank located before the ac inverter, as using the inverter,
there is the amount of source loss which happens on the inverter. In term dc
micro-grid with distributed storage, this loss is mitigated throughout night time as
the dc delivery is off at night. Most of the user applications are dc devices such
as computers. The losses from the point of load (POL) which ac/dc converters
have been assessed to be around 15% [13] .However, this energy which lost
without any end user benefit.
b) In ac microgrid, inverter losses could be control by a mismatch between the rated
power to the actual load. The peak power load used to determine the size of the
inverter (KVA-rating ). There have been several microgrid studies, which show
that peak loads are associated in time across many houses. For instance of such
loads are electric kettles and electric rice cookers running at the same time of the
14
function as remote energy buffers that filter variability in power request on
upstream power converters [15].
c) Inverter efficiencies suffer when the average power demand is significantly below
the peak in an ac microgrid, which is because inverter efficiencies are highest
when operation between 80-90% of the rated output capacity. Then operating the
inverter at the low utilization rate (at average load/ rated capacity), it will affect the
overall efficiencies of the ac microgrid suffer [15] .
Figure 9 Efficiency of AC and DC Microgrid [15] .
3.2.4 Power electronic Converter in AC and DC Microgrid.
From the ac and dc microgrid structure that, dc microgrid need for the dc/dc converter
to power the dc load, and dc/ac inverter to power ac loads.
a) The inverter is used to supply ac load from the dc distribution system. Then
conversion from the dc to ac is required. However, the output from the dc/ac
converter having two options which can be made either single as shown in Figure
10 or three phases which could be decided based on the requirement of the
system. In the simulation stage only considered being use single phase full bridge
15
b) DC/DC converter which is mainly in the dc microgrid to, which used to obtain a
desired dc voltage range for the supply load, a power electronic converter which
converts a source voltage to another voltage level is needed. They are two type
of dc/dc converter either boost or buck converters, in the boost converter the input
voltage lower than the output voltage, but in the buck convert the input voltage is
greater that output voltage.
c) AC/DC Rectifier, which is mainly in the ac microgrid, the conversion from the
AC/DC can be obtained through two options the active bridge or passive diode
bridge. The main difference between them is the active bridge is a wide range of
control in the active bridge, also can obtain a bidirectional power flow. In the
passive diode bridge, the main disadvantage is that separate starting device is
required, as its draws high charging current during the initial starting conditions.
[16].
Figure 10 Single Phase Full Bridge Inverter with LC Filter [16] .
3.2.5 Comparison between AC and DC in distribution lines.
The Low voltage in both ac (LVAC) and dc (LVDC) distribution lines are characterized
by different parameters, for example, power transmission capability, reluctance,
frequency, susceptance's, line resistance and system stability. The comparison between
the two ac and dc low voltage distribution lines shows in Table 8, and the operation of
16
Table 8 Comparison between AC and DC distribution Lines [8] .
Effect Parameters AC Distribution Line DC Distribution Line Power transmitted Due to high line loss, it is having the less
efficiency. Require more Conductors.
Having more efficiency than AC, and more power transmission. Require few Conductors.
Frequency Frequency monitoring is Mandatory either 50 or 60 Hz.
Frequency is zero so no need of 50 or 60 Hz
Reluctance Have Reactance on the line. No Reactance in the line and hence more power are transmitted. Resistance Having the Line resistance and hence high
losses.
Have low line resistance.
Analysis Involve Complex numbers and hence difficult to analyze
Involve Only real number.
The flow of the current and power transport in their distribution lines and circuit as shown
in Table 9 [8]. The effect of the line parameters, in the both circuit, is to be considered
with only the type of source that differentiates the two circuit.
Table 9 Analysis of AC and DC circuit [8] .
Circuit DC circuit Analysis AC circuit Analysis Circuit
Power Load
𝑃𝐿𝐷𝐶= 𝑃𝐿𝐴𝐶 = 𝑃𝐿 𝑃𝐿𝐷𝐶= 𝑃𝐿𝐴𝐶= 𝑃𝐿
Voltage load
𝑉𝐿𝐷𝐶= 𝑉𝐿𝐴𝐶 = 𝑉𝐿 𝑉𝐿𝐷𝐶= 𝑉𝐿𝐴𝐶= 𝑉𝐿
Current 𝑃𝐿𝐷𝐶= 𝑉𝐿∗ 𝐼𝐷𝐶
𝐼𝐷𝐶=𝑉𝑃2 𝐿𝐷𝐶
𝑃𝐿𝐴𝐶= 𝑉𝐿∗ 𝐼𝐴𝐶𝐶𝑂𝑆(𝑤)
𝐼𝐴𝐶=𝑉 𝑃2 𝐿𝐷𝐶𝐶𝑂𝑆(𝑤)
The following chapters will cover the different types of controllers used to control the
microgrid. Then, explore the one which will be used in this report. There are many
existing microgrid over the world, some of them dealing with ac power source and other
with dc power source which is depending on the availability of the sources and the
17
In this report, the case study will be about the Kythnos dc microgrid which is located in
Greece Island. Kythnos microgrid is one of the most stable microgrid with the main
distribution generation is PV array and diesel generator used as a backup in case of any
fault occurs in the microgrid. Then over the report, it will explore in details about, the
system configuration of the Kythnos microgrid network, cost rating, type of control used
to control the microgrid.
MATLAB/Simulink is one of the software tools used in engineering to simulate the
network of any system. In this case study MATLAB/SIMULINK used to simulate the
network, and from that, the comparison between two networks will be carrying one and
checking the efficiency between two types of microgrid network.
4
Microgrid control
As microgrid contain different types of renewable distribution generators and the energy
which produced by the energy source, it is difficult to be predicted. However, the power
between the main grid and microgrid needs to be controlled in the grid-connected mode.
Microgrid should have the ability to last when the main grid has been disconnected.
Therefore, choosing the proper control techniques is a requirement to satisfy the issues
that could face the microgrid [17]. Also, the control system maintains frequency and
voltage level in island control of the operation [18]. The main objectives of microgrid
controllers are:
a) Having the ability to plug and play feature when connected new DG into microgrid.
b) Dynamic load sharing as load suddenly increase or decrease in the islanded
mode operation.
c) Controlling the reactive power and distribution generator power flow to host grid
under the demand of host network in a grid through connected mode [19] .
d) Ability to manage the stability of the system in case of network disturbance [20] .
e) Ensuring the power quality of microgrid within the standard, also keeping voltage
and frequency fluctuation and phase angle within limits [19] .
The main principle method used to maintain the stability in MG is droop control which is
classified as active power frequency P/F and reactive power-voltage Q/V.
These two controllers are the primary standard that could enable multiple synchronously
18
In the following section, more details about three types of control undertaken for a
microgrid when its interfaces to the main utility grid are discussed.
4.1Hierarchical Control Levels in the Microgrid
There are three main hierarchical levels that can be applied in a microgrid network, as
shown in Figure 11.
Figure 11 Hierarchical Control Level in the Microgrid [21] .
4.1.1 Primary Control.
Primary control is the faster response, and first control compares to others level control
[22]. In the microgrid, the main controller is the responsibility of the local voltage
controller with power reliability, proper power sharing, and a stable microgrid operation
[23]. Furthermore, the primary control is designed to satisfy the following requirements:
a) Maintain the voltage and frequency following to an islanding even, the microgrid
may lose its voltage and frequency stability due to the imbalance of the power
generated and customer.
b) Providing the reference points for the voltage and current control loops of
Distributed Energy Resources (DER) [24].
Primary control normally results in differences to the setpoint of the frequency and
voltage set points, then using the secondary control to correct this [24].
4.1.2 Secondary control
The secondary control ensures that the electrical levels into the microgrid are within the
required value [21] . This controller is designed to have slower dynamics response than
that of the primary, which justifies the decoupled dynamics of the primary and secondary
control loops, and simplifies their designs. Moreover, secondary control can also be
aimed to satisfy the power quality requirements; for instance, the voltage balancing at
19
Figure 12 illustrates how the secondary control removes voltage and frequency deviation
caused by primary level in the microgrid units [25]. In Figure 12a, the performance of
primary and secondary control for two distribution generator (DGs) with different droop
measurement has been shown, that primary control just shifts by the secondary control
response to allow the frequency to reach the nominal value, even DG is operating at
different power rating [25].
Figure 12 Secondary v Primary Control Responses (a)frequency restoration (b) voltage restoration [25] .
In the case of a control system using the droop control, if a DG is supplied to deliver a
stable active and reactive power through Islanded mode. Then using the secondary
controller to shift the droop curve vertically, so that the DG output proceeds to active and
reactive power set points, as illustrated in Figure 13 [26].
20
4.1.3 Tertiary control
This control is the highest control level, and the main function of this control is to achieve
power flow by controlling the voltage and frequency when the microgrid is in grid-connected mode. The network’s grids active and reactive power can be compared
besides the desired reference by measuring the real and reactive power through the
point of common coupling (PCC). Hence, the active power at the grid can be controlled
by adjusting the microgrid reference frequency [27]. In the case of any fault at the
microgrid, the power transaction link between the grid and microgrid is disconnected and
allowed to reduce the system frequency. Due to the issue, microgrid transfer to the Island
mode and tertiary control will be disabled [27].
4.2
Droop Control
Mainly the droop control technique can be used to maintain load current sharing, which
done by changing output voltage under both voltage and current droop characteristic
[19]. Moreover, the relationship between reactive power and voltage, active power and
frequency can be recognized by considering a simple microgrid with an interfaced
inverter system as shown in Figure 14, that distribution generator connected to the load,
with the impedance, Z. The active and reactive powers can express as following two
Equations:
𝑃 =𝑉𝑆
2
𝑍 𝐶𝑂𝑆𝜃 − 𝑉𝑆𝑉𝐿
𝑍 𝐶𝑂𝑆(𝜃 + 𝛿)
(1)
𝑄 =𝑉𝑆
2
𝑍 𝑆𝑖𝑛𝜃 − 𝑉𝑆𝑉𝐿
𝑍 𝐶𝑂𝑆(𝜃 + 𝛿)
(2)
Where, 𝜃 is the angle of line impendence, 𝑍 = 𝑅 + 𝑗𝑋, then (1) and (2) can be rewritten
as:
𝑃 = 𝑉𝑆
2
𝑅2+ 𝑋2[𝑅(𝑉𝑆− 𝑉𝐿𝐶𝑂𝑆𝛿) + 𝑋𝑉𝐿𝑆𝑖𝑛𝛿]
(3)
𝑄 = 𝑉𝑆
2
𝑅2+ 𝑋2[−𝑅𝑉𝐿𝑆𝑖𝑛𝛿 + 𝑋(𝑉𝑆− 𝑉𝐿𝐶𝑂𝑆𝛿)]
(4)
From Equations (3) and (4) show the dependency of the inverter output voltage and
21 .
Figure 14 Simple Microgrid with an interfaced inverter system [28] .
From Figure 14, assuming that high voltage (HV) network has a low R/X ratio indicates
that𝑋 ≫ 𝑅, so R could be ignored. Also, assuming 𝛿 is small then 𝑠𝛿 ≈ 1 𝑎𝑛𝑑 𝑆𝑖𝑛𝛿 ≈ 𝛿
, so the result from Equations (3) and (4) can be expressed as two equations [28]:
𝛿 = 𝑋𝑃 𝑉𝑆𝑉𝐿
(5)
𝑉𝑆− 𝑉𝐿=
𝑋𝑄 𝑉𝑆
(6)
From Equation (5), the active power 𝑃, controlled by the voltage angle, and the 𝛿 referred
to the power angle which is related to angular frequency (𝑠𝑒𝑐𝑜𝑛𝑑𝑟𝑎𝑑 ) . Then, from Equation
(6), the reactive power (Q) can be controlled by the difference between supply voltage
(𝑉𝑆) and load voltage (𝑉𝐿). These strategies are known as P/F and Q/V controls [28].
Figure 15 shows the droop characteristics of frequency versus active power and voltage
versus reactive power. In the case of the load change, this is will cause a frequency
change at the terminal of each synchronous generator, and the active power will flow
from higher frequency regions to lower frequency which shown in Figure 15 (a).
Frequency change within the network will eventually drift to an average steady state
value. Then, new steady state of frequency will proportional to change in power as
22
Figure 15 Droop Control (a) Active Power and Frequency (b) Reactive Power and Voltage droop control [26] .
One of the primary example of the droop control shown in Figure 16 that two generators
have similar power rating using the same droop, and during regular operating, each
generator will deliver the same power with the same voltage to the load bus. When the
load at the common indicate (V∠0 ) increase, then the stored kinetic energy will be
changed into electric power, which will cause the rotor speed to decrease.
As the rotor speed is related to the electrical frequency, any change occurring to the rotor speed governor’s control system will detect. Then the response of the mechanical
power to the Synchronous generator will increase. The rotor speed and electrical
frequency would continue to decrease if the mechanical power is not increased and the
system will become unstable. [29].
Figure 16 Load Sharing between two Generators [30].
4.2.1 Voltage Source Inverter (VSI) with Droop control
Voltage source inverter (VSI) with droop control, the basic idea is that the input voltage
and current are measured, which used later to measure the output power as shown in
23
Then by the measured reactive power, the voltage will be determined and by measuring
the real power, the frequency is determined as shown in Figure 17. Moreover, the
mathematical representation for the conventional VSI droop control is expressed into to
Equations (7) and (8) [31].
Figure 17 Voltage Source Inverter with Droop Control [31].
𝑓 − 𝑓0= −𝐾𝑝(𝑃 − 𝑃0) (7)
𝑉𝑆− 𝑉𝑆0= −𝐾𝑞(𝑄 − 𝑄0) (8)
Where the f0and VS0 are rated frequency and voltage of the microgrid, Kp and Kq are
the droop control coefficients of distributed generator for the real and reactive power.
Based on Equations (7) and (8) in case anything happens to the voltage and frequency
of the inverter, the influence could be detected on the output real and active power of
the inverter at self. However, the amount of suitable voltage and frequency deviation
could be realized through droop characteristics [28].
4.2.2 Active and Reactive (PQ) inverter with Droop Control
The main purpose of using PQ is to stabilize the output of active and reactive power
distributed generation is same as the reference power, as Figure 18 shows the
characteristics of PQ droop Controller [26].
24
4.3 General Method of Control
In predictable power network, the synchronous generator (SG) is used for controlling the
frequency and voltage of the whole system. During an islanded operation, the MG
inverters should be responsible for controlling voltage and frequency. Then the MG could
experience voltage and power fluctuations in case there is no controller. If a group of the
micro source is operated within a MG and the main grid is available, providing voltage
and frequency references, all the inverters can be operated in the PQ mode. In case
the main grid is mislaid all the inverter will shut down as far there will not be any voltage
reference within the microgrid, and it will cause unbalance between load and generation.
This means that general voltage and frequency must follow to operate the microgrid.
There are three main strategies which combining the inverter control [32].
a) Single-Master Operation (SMO).
b) Multi-Master Operation (MMO).
c) Secondary load-frequency control.
Voltage Source Inverter (VSI) is used by a single and multi-master operation to provide
a reference for frequency and voltage, and secondary load frequency control must be
measured to maintain the frequency between the specified bounds and to run distributed
energy resources sparingly [33].
4.3.1 Single Master Operation (SMO).
This method has one inverter acting as voltage source inverter and others as followers.
When the main utility grid is disconnected or lost, then voltage reference will take by the
followers from the voltage source inverter and operate in the PQ mode. However, to
maintain the generation of active and reactive power at the specified values, the Local
controllers (LCs) receives set points from the microgrid central controller (MGCC) [33].
Local micro sources (MS) controller can take information from the MGCC about the
generation profile and control accordingly the corresponding micro source. Figure 19
25
Error! Bookmark not defined.
Figure 19 Control Scheme for Single Master Operation [31] .
The main limitation associated with SMO control is it is required to locate a secondary
load frequency control. This is required during islanded operation and needs to be
installed in the micro source that can be controlled.
4.3.2 Multi-Master Operation (MMO).
In the multi-master operation methods, several inverters are operating as voltage source
inverter (VSI), either with predefined voltage/reactive power or with frequency/active
power characteristics. The VSI can be attached to the micro source with storage devices
in the dc link such as super capacitors, or to storage devices such as batteries which
are continuously charged by the primary energy source.
Ultimately, other active and reactive power controlled inverters may also coexist; also,
MGCC can change the generation profile by changing the idle frequency of VSI or by
defining new set points for controllable micro source connected to the grid through PQ
26
Figure 20 Control Scheme for Multi-Master Operation [31] .
4.3.3 Secondary load frequency control
This method involved use of storage devices would keep on injecting or could be
absorbing active power to maintain frequency stability. The storage devices such as
batteries are responsible for load frequency control during the transient situations.
Storage devices have a finite storage capacity, and then this method should be applied.
Consequently, correcting the frequency deviations during an islanded operating
condition should then be considered as one of the principal purposes of any control
strategy.
Equation 9, shows that the VSI active power output is proportional to the MG frequency
deviation
∆𝑤 = 𝑤0𝑖− 𝑘𝑝𝑖× 𝑃𝑖− [𝑤0𝑖− 𝑘𝑝𝑖× (𝑃𝑖+ ∆𝑝𝑖)] = 𝑘𝑝𝑖× ∆𝑝𝑖 (9)
Where 𝑤0 = angular frequency of inverter, 𝑘𝑝= droop slope of inverter, 𝑝 =iinverter
active power.
In order to develop secondary control aiming to restore frequency to the nominal value,
two main approaches are available. Either local secondary control or by centralized
27
In the Local secondary control, using a PI controller at each controllable micro source
as shown in Figure 21, other using a microgrid centralized controller (MGCC). Those
two methods of the controller are partial to use during the transient stage as this is when
the storage devices have responsibility for the load frequency primary control [31].
Figure 21 Local secondary load frequency control for controllable Micro sources [31] .
5
Case Study of the Existing Microgrid in Europe
Kythnos Island microgrid is located in the Aegean Sea, close to Athens. The microgrid
project at Kythnos was funded by the Europe FP 5 microgrid program, and the main
propose of this project was to test centralized and decentralized control strategies for
the island [34].
The system in Kythnos is 3 phase microgrid which is composed of overhead power lines
[35]. It powers 12 houses with a single phase 230V (VAC) grid electrical service, and
communication cable (RS485) running in parallel [36] .The power supply system
represents of 10KW of PV, with 5 KW diesel generator set and a nominal of 53 KWH
battery system. There is second 2KW PV array [36].
5.1 System Configuration
The microgrid power system at the Kythnos Island covers the need of 12 houses in the
islands, and the main parts of the microgrid in this project are:
a) PV generators: the network includes 7 PV arrays with the 10 KW of the total
installed power. Figure 22 shows the overview of Kythnos microgrid with 7 PV
arrays.
b) Three Phases, 6 KVA diesel backup generators, those generators controlled by
28
c) Two Lead Acid Battery Banks, first one which is the main with 1000Ah/48V is
managed through three single phase battery inverters, Secondary with
480Ah/60V and is controlled with single phase battery inverters. Battery bank
connects and disconnects depending on the day and nights, during night two
banks are disconnected, while during the day, the two storages connected to the
ac [35] .
d) Each house connected to the microgrid, through Distributed Intelligent Load
Controller (DILC), those types of controller operate in the frequency mode. For
instance, if low battery State of Charge (SOC) overload by any house, then the
controller will automatically disconnect a house when frequency drop below
normal 49.14 Hz [37].
e) Load Controllers used to protect against overloading or extreme battery
discharge. When the frequency goes under 49.14 Hz, those controllers are
triggered from shed loads and frequency [35].
f) Three parallel-connected SMA batteries used to feed the local house facility, and
those are controlled by master-slave control scheme at grid Frequency [38].
29
5.2 Battery Inverter Operation.
The most critical operating part in the microgrid is battery inverter as they perform the
energy management which done by regulating frequency either by load shedding or by
PV power derating. Also, they manage the diesel generator start-up [35]. Moreover, the
battery inverter operates in multi-master configuration, by this way, the automatic load
sharing is reached through the utilization of active power/frequency droop curves in the
inverters control systems. The operation in frequency droop mode gives the technical
opportunity to switch load controllers in case that the battery state of charge (SOC) is
sensed low or limit the power output of the PV inverters. [37]. According to the battery
state of charge, there are three states:
a) When the State of Charge (SOC), falls below 30%, the diesel generator is
automatically set in operation and charges the batteries. During this case is
occurs in the grid then the battery inverter will follow the generator frequency.
b) In order to trigger the load controllers and shut down the loads, which will happen
when the state of charge falls under 15%, and the frequency became 47 Hz.
c) When the battery voltage increases leading to a high state of charge, the
frequency changes from 50 to 51Hz and then slowly according to the SOC from
51 to 52 Hz [35].
5.3 Cost
The cost of Kythnos microgrid was based on the initial cost estimate of the system from
the maintenance and the service cost. The possible future solution for the electrification
was considered as the many supply loads is ac. In Table 10, shows a list of the PV
system components with a little description and their prices are listed. However, the
monitoring equipment used in the Microgrid and their cost not included in the Table [39].
Table 10 Investment Cost for the Farmer's PV System [39].
Component Description Cost in € with 18% VAT 36 𝑆𝑜𝑙𝑎𝑟𝑒𝑥 𝑀𝑆𝑋 60 𝑊𝑃 𝑃𝑉 𝑀𝑜𝑑𝑢𝑙𝑒𝑠 9400
1 Sunny Boy 2500 2000 x3= 6000
1 Sunny Island 3500
Battery Bank, 30 X 2Volt cells of 800 Ah with Metallic Base 4500 1 Airlift Pump For the Batteries 400
Electrical Board and Wires 1000 PV Module Support Structure Installed 1000 Estimated installation cost 2500
30
The PV system charge cost is per watt peak installed, which is approximately 11 €. This
price is not an expensive cost fa ac stand-alone system, and the battery inverter can
provide constant ac power Up to 3.3 KW [39].
5.4 MATLAB/Simulink: Simulation of Kythnos Island Microgrid.
In order to simulate Kythnos microgrid network, the whole work consists of several
approaches and steps. Develop the simulation of the case study according to the
following procedure:
a) Kythnos microgrid is based on the three-phase power supply, but for the
simulation and control propose, consider to be used as single-phase network.
b) PV array represents the dc voltage source, and the dc output of the PV array is
connected to a full-bridge Inverter to converter the dc into ac.
c) The output of the inverter is a sine wave with appropriate frequency.
d) The ac voltage source represents a diesel generator.
e) At each four houses, there is one breaker used to protect the load in case
anythings happen to the network.
f) From the controller, comparing the voltage reference and measurement voltage
for the switching device of an inverter.
The system model, shown in Figure 23, is based on the solar cell array connected to a
50 Hz, 400 V which obtained from the dc/dc converter is applied to a single dc to ac
inverter. The elimination of the harmonics which contained in the voltage and current of
the inverter output, an inductor (L) filter inserted after the dc/ac inverter.
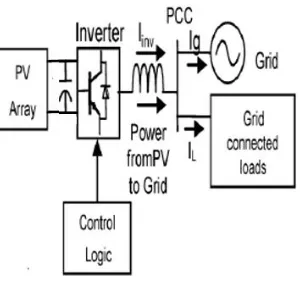
However, the grid connected with PV array system control is to be sure that the signals
of the inverter output and grid signals have the same of the phase, frequency and RMS
31
Figure 23 Kythnos Microgrid
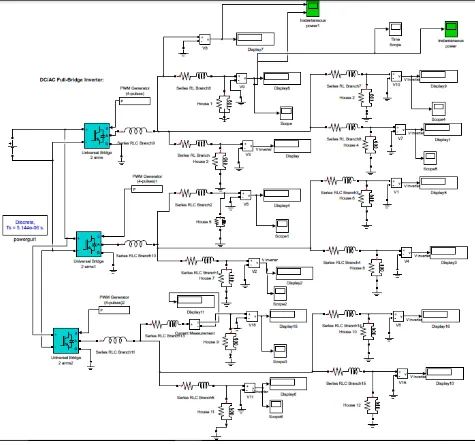
MATLAB/Simulink platform for a complete micro-grid power circuit modelling for Kythnos
Island microgrid is shown in Figure 24. Which consist of dc power supply of 400VDC
represented by dc voltage source, three dc/ac inverters power electronic device with the
type of Insulated Gate Bipolar Transistor (IGBT) switches and the frequency of 50Hz.
The transmission line between the inverter and the house as follows, for the houses 1,
2,3 and 4 the distance is 60 meters, and for house 5,6,7 and 8 the distance is 100 meters
and 200 meters for the house 9,10,11 and 12. The Load at houses 1,2,5,6,8,12 is 2 KW,
and the remaining houses 3,4,7,9 and 10 the load power is 3 KW. The maximum load
located far away from the inverter by 200 meter which is close to the coast of the Kythnos
Island. The resistance in the line is very small as the transmission line between the
inverter and the load very close [37].
The IGBT switches are controlled using the bipolar pulse width modulation (PWM) refer
to Appendix Part A for the inverter setup and each inverter supply voltage to four houses.
The value for each L filter is varying depending on the distance between the inverter and
supply house. In this network as shown in Figure 24, no voltage or frequency control is
32
Figure 24 MATLAB/ Simulink Model of Complete Kythnos Microgrid power Circuit
Single -phase diesel generator (240VAC) used as a backup in case of any fault in the
PV array or the supply power goes beyond the demand to the suppliers. The control
method of the diesel generator in the island is based on the battery management system
(BMS), whereas, in the MATLAB/Simulink simulation is controlled by the voltage
controller based on the total load on the network.
Moreover, the breaker in the diesel generator used to simulate the fault that could
happen to the generator refer to Appendix Part B. The setting timing for the breaker
based on the running time of the simulation. The diesel generator is shown in Figure 25,
that each four houses having breaker used to disconnect the load in case any fault occur
33
The output waveform of the inverter with L filter shown in Figure 26, that the pure
sinusoidal waveform of frequency is 50 Hz and amplitude of 400 Voltage (Peak to
Peak).In Figure 26 the y axis is the voltage (Volta) and in the x axis is the time (second).
34
Figure 26 Output voltage waveform of a full bridge Inverter with L filter
When the diesel generator is supply voltage to the network as shown in Figure 27. If the
fault occurs in the generator at the time dial setting (TDS) 0.025 second, then the fault
will acknowledge at 0.05 second the generator will supply voltage to the network as
shown in Figure 27. However, the breaker time dial setting will change based on the
network configuration of fault.
Figure 27 Diesel Generators in the Microgrid power Circuit
5.4.1 Power and Voltage Control in the Simulation Network.
The inverter controls in the simulation could be broadly classified into two types: voltage
and current controller. When the inverter is connected to the main grid, it controls the
amplitude and frequency of the inverter output voltage. However, the inverter itself
35
In this project, the grid is not connected to the network; only the load will supply through
the microgrid or by the diesel generator which basically by the inverter, which can
maintain the amplitude and the frequency by the utility interruption.
However, the inverter operates in voltage control mode providing the reference voltage
and frequency. In the frequency controller, the output frequency of the inverter depends
on the frequency of the reference signal. In this project 50 Hz used as reference signal.
So, the output frequency of the inverter is 50Hz, the frequency control block diagram is
shown in Figure 28.
Figure 28 A Frequency Control Block Diagram
In order to obtain the reference voltage by using single line Diagram(SLD), which
representing a transmission line between two buses as shown in Figure 29, and the
inductor is usually specified by its reactance value using Equation (10).
Figure 29 Single Line Diagram of one phase.
𝑥𝐿= 2 𝜋 𝐹𝐿 (10)
As the inverter in the Kythnos microgrid operates in voltage control mode for such
scenario, which provides the reference voltage and frequency. Then following obtain
data required (𝑉1 and 𝛿1 )voltage and angle reference for the inverter. However, from the
36
The obtain active and reactive power as expressions in the following two Equations,
𝑃𝑟=
𝑋𝐿𝑉1 𝑉2 𝑆𝑖𝑛(𝛿) + 𝑅(𝑉1𝑉2𝐶𝑜𝑠𝛿 − 𝑉22)
𝑋𝐿2+ 𝑅2
(11)
𝑄𝑟=
𝑋𝐿(𝑉1 𝑉2 𝑐𝑜𝑠𝛿 − 𝑉22) − 𝑅𝑉1𝑉2𝑆𝑖𝑛𝛿
𝑋𝐿2+ 𝑅2
(12)
Those two equations would be useful if they can be simplified by using a suitable
approximation. There are two assumptions could be done, one assumption which
assumes that the transmission line is lossless that meaning no power loss on the line,
that implies the resistance will be zero. However, this assumption could often be being
acceptable in a transmission line with high voltage network. This is form the following
active and reactive power as shown in Equation (13) and (14).
𝑃 =𝑉1 𝑉2 𝑆𝑖𝑛(𝛿1− 𝛿2) 𝑋𝐿
(13)
𝑄 =𝑉1𝑉2 𝐶𝑂𝑆(𝛿1− 𝛿2) − 𝑉2
2
𝑋𝐿
(14)
This pair of equation (13) and (14) can provide important clues into what causes certain
network behaviour, and how to correct that behaviour of the controller. Then both
equations can be written as:
𝑠𝑖𝑛(𝛿1− 𝛿2) =
𝑝 . 𝑥𝑙
𝑉1𝑉2
(15)
𝑐𝑜𝑠 (𝛿1− 𝛿2) =
𝑄. 𝑥𝑙+ 𝑉2
𝑉1𝑉2
(16)
Then by rearranging the equation to calculate δ1 and V1 as form a by the following
equation shows:
𝛿1= 𝛿2+ tan−1(
𝑝 . 𝑥𝑙
𝑄. 𝑥𝑙+ 𝑉22) (17)
𝑉1= 𝑝 . 𝑥𝑙
𝑉2𝑠𝑖𝑛(𝛿1− 𝛿2) (18)
The second assumption that as the network is supplying by medium voltage, the
resistance in the cable could be relatively large which will be affecting Equation (13) and
(14), by considering the resistance in the equation and implies that inductivity in the line
37
Then active and reactive power will be expressed in the following two Equations (19),
(20) and as further explore into equation (21) and (22):
𝑄 =𝑉1 𝑉2 𝑆𝑖𝑛(𝛿1− 𝛿2)
𝑅
(19)
𝑃 =𝑉1𝑉2 𝐶𝑜𝑠(𝛿1− 𝛿2) − 𝑉2
2
𝑅
(20)
𝛿1= 𝛿2+ tan−1(
𝑄𝑅 𝑃. 𝑅 + 𝑉22
) (21)
𝑉1=
𝑄. 𝑅 𝑉2𝑠𝑖𝑛(𝛿1− 𝛿2)
(22)
In the voltage control mode, the ICBT switches controlled using the Pulse Width
Modulation (PWM) switching such, the inverter output voltage follows the reference
voltage. A voltage control block diagram is shown in Figure 30 the voltage in the network
across the load compares with the voltage references. The voltage reference is the 𝑉1.
Figure 30 A voltage Control Block Diagram
Based on the last two equations (21) and (22), then by using the MATLAB/Simulink block
function as shown in Figure 31 for the equation and Figure 32 for the MATLAB Code.
The output of function generates a phase angle (𝜃1 𝑎𝑛𝑑 𝑉1), which is basically using the
PWM generation to send single to the inverter. The active power (P) and reactive power
(Q), putting it as constant block as easy to change it, Voltage Load is basically the
![Figure 3 Microgrid Architecture [5] .](https://thumb-us.123doks.com/thumbv2/123dok_us/9648824.1946951/12.595.202.414.193.463/figure-microgrid-architecture.webp)
![Figure 4 Microgrid Structure [5]](https://thumb-us.123doks.com/thumbv2/123dok_us/9648824.1946951/13.595.197.449.75.340/figure-microgrid-structure.webp)
![Figure 5 Typical Configuration of the DG units with LVAC network [8].](https://thumb-us.123doks.com/thumbv2/123dok_us/9648824.1946951/15.595.168.445.409.680/figure-typical-configuration-dg-units-lvac-network.webp)
![Figure 7 Typical Configuration of the DG units with LVDC network [8].](https://thumb-us.123doks.com/thumbv2/123dok_us/9648824.1946951/18.595.189.460.279.514/figure-typical-configuration-dg-units-lvdc-network.webp)
![Figure 9 Efficiency of AC and DC Microgrid [15] .](https://thumb-us.123doks.com/thumbv2/123dok_us/9648824.1946951/21.595.112.422.254.489/figure-efficiency-ac-dc-microgrid.webp)
![Table 8 Comparison between AC and DC distribution Lines [8] .](https://thumb-us.123doks.com/thumbv2/123dok_us/9648824.1946951/23.595.78.516.390.612/table-comparison-ac-dc-distribution-lines.webp)
![Figure 20 Control Scheme for Multi-Master Operation [31] .](https://thumb-us.123doks.com/thumbv2/123dok_us/9648824.1946951/33.595.95.499.85.323/figure-control-scheme-for-multi-master-operation.webp)
![Figure 22 Overview of the Microgrid system on the Kythnos Island [37].](https://thumb-us.123doks.com/thumbv2/123dok_us/9648824.1946951/35.595.94.547.429.661/figure-overview-microgrid-kythnos-island.webp)