O R I G I N A L R E S E A R C H
Open Access
Impact of attenuation correction on clinical
[
18
F]FDG brain PET in combined PET/MRI
P. Werner
1†, M. Rullmann
1†, A. Bresch
1, S. Tiepolt
1, T. Jochimsen
1, D. Lobsien
2, M. L. Schroeter
3, O. Sabri
1and H. Barthel
1*Abstract
Background:In PET/MRI, linear photon attenuation coefficients for attenuation correction (AC) cannot be directly derived, and cortical bone is, so far, usually not considered. This results in an underestimation of the average PET signal in PET/MRI. Recently introduced MR-AC methods predicting bone information from anatomic MRI or proton density-weighted zero-time imaging may solve this problem in the future. However, there is an ongoing debate if the current error is acceptable for clinical use and/or research.
Methods:We examined this feature for [18F] fluorodeoxyglucose (FDG) brain PET in 13 patients with clinical signs of dementia or movement disorders who subsequently underwent PET/CT and PET/MRI on the same day. Multiple MR-AC approaches including a CT-derived AC were applied.
Results:The resulting PET data was compared to the CT-derived standard regarding the quantification error and its clinical impact. On a quantitative level,−11.9 to +2 % deviations from the CT-AC standard were found. These deviations, however, did not translate into a systematic diagnostic error. This, as overall patterns of hypometabolism (which are decisive for clinical diagnostics), remained largely unchanged.
Conclusions:Despite a quantitative error by the omission of bone in MR-AC, clinical quality of brain [18F]FDG is not relevantly affected. Thus, brain [18F]FDG PET can already, even now with suboptimal MR-AC, be utilized for clinical routine purposes, even though the MR-AC warrants improvement.
Keywords:PET/MR, Attenuation correction, FDG imaging
Background
No differences in diagnostic quality of the MR compo-nent in hybrid PET/MR systems as compared to stand-alone MR systems have been reported [1, 2]. For the PET component, however, attenuation correction (AC) systematically differs from that in PET/CT or stand-alone PET as in PET/MRI the linear photon attenuation coefficients cannot directly be derived. Hence, the stand-ard segmentation-based AC currently provided by the vendors assigns defined attenuation coefficients to differ-ent tissue classes (usually fat, soft tissue, air) segmdiffer-ented from a 3D T1-weighted volumetric interpolated breath-hold examination (VIBE) Dixon sequence. In brain im-aging, sequential PET/CT vs. PET/MRI cross-evaluation
studies reported an underestimation of the average PET signal in PET/MRI due to the omission of cortical bone for several tracers, ranging from 11 to 12 % [3, 4] up to 19 to 25 % [5, 6]. There is an ongoing debate on whether this error is acceptable for clinical use and/or research. Moreover, it was recently argued that this problem is potentially solved with recent AC methods predicting bone information from anatomic MRI or proton density-weighted zero-time imaging [7]. Applying the current standard AC methods, it could be hypothesized that, for brain [18F] fluorodeoxyglucose (FDG) PET, cortical hypo-metabolism may be overestimated in PET/MRI, a drawback which may result in false-positive findings [8]. To test this hypothesis, we examined 13 patients with clinical signs of dementia or movement disorders who subsequently under-went FDG PET/CT and PET/MRI. PET data from PET/ MRI were reconstructed using (1) segmentation-based at-tenuation maps, (2) continuous μ-maps derived from the * Correspondence:henryk.barthel@medizin.uni-leipzig.de
†Equal contributors
1Department of Nuclear Medicine, Leipzig University Hospital, Leipzig, Germany
Full list of author information is available at the end of the article
CT, and (3) continuous μ-maps predicted from high-resolution anatomical MRI. The respective PET data de-rived from the outlined reconstruction methods were com-pared with the gold standard, the PET/CT data, regarding the quantification error and its clinical impact.
Methods
Thirteen patients with clinical evidence of either demen-tia or movement disorders underwent brain PET/MRI
and PET/CT of random sequence (n= 7 PET/MRI-first
and n= 6 PET/CT-first). Average time from injection to PET/CT and PET/MRI did not differ between the PET/ MRI and PET/CT first groups (85 ± 51 vs. 68 ± 38 min,
p= 0.48, two-tailedt test, Table 1). The groups did not differ in age (59 ± 17 years for PET/CT-first and 69 ± 9 years for PET/MRI-first, p= 0.2, two-tailed t test, Table 1). After injection of 242 ± 39 MBq FDG, the pa-tients were placed in a dimly lit and sound-shielded room to minimize sensory stimulation for at least 30 min before they underwent first imaging. Without a break, the patients were then transferred to the other imaging modality to undergo the second brain scan.
PET/MRI
Simultaneous brain PET/MR acquisition was performed using an integrated PET/MRI system (Siemens mMR Biograph, Erlangen, Germany, software version VB18P). Patients were positioned in a dedicated PET/MRI head coil. Dynamic brain PET data were acquired in 3D list-mode over 20 min. During PET acquisition, a two-point MRI Dixon sequence (matrix 128 × 192, 126 slices, isotropic voxels 2.6 × 2.6 × 2.6 mm3) was acquired. For attenuation correction, attenuation coefficient maps (air,
soft tissue, fat) were segmented from the fat, and water images generated by the Dixon sequence and PETDixon were reconstructed using the built-in OSEM algorithm with a zoom factor of 2.8, eight iterations, 21 subsets, and a 3-mm Gaussian filter (256 × 256 matrix, 127 slices, voxel size 2.8 × 2.8 × 2.03 mm3). Apart from diagnostic MR sequences, as they were required according to the clinical question, T1 magnetization-prepared rapid ac-quisition gradient echo (MPRAGE) data were acquired in all patients (TE = 2.53 ms, TR = 1900 ms, matrix 512 × 512, 176 slices, voxel size 0.48 × 0.48 × 1 mm3). In six patients, an additional ultrashort echo time (UTE) sequence was acquired forμ-map creation with bone in-formation (TE = 0.07 and 2.46 ms, TR = 11.9 ms, 192 × 192 × 192 voxels, voxel size 1.6 × 1.6 × 1.6 mm3).
PET/CT
PET/CT was performed on a Biograph 16 (Siemens Healthcare, Erlangen, Germany). Low-dose CT data for each patient were obtained (120 kVp, 41 mAs, 512 × 512 matrix, 55 slices, voxel size 0.59 × 0.59 × 3 mm3). Brain PET data were acquired in 3D mode over 5 min in one bed position, processed using standard correction methods, and reconstructed into a 256 × 256 matrix with 55 slices (voxel size 1.3 × 1.3 × 3.0 mm3) using 3D OSEM with four iterations, eight subsets, and a 5-mm Gaussian filter, resulting in PETPETCTfor each patient. Due to dif-ferent scanner properties and reconstruction parameters, PETPETCTwas not quantitatively compared to any of the PET reconstructions from the PET/MRI (PETDixon/CTder-ived/PseudoCT/BoneDixon). For the same reason, we reduced the scan time to the lowest possible of 5 min in PET/CT [9] as opposed to 20 min in PET/MRI. Figure 1 gives an
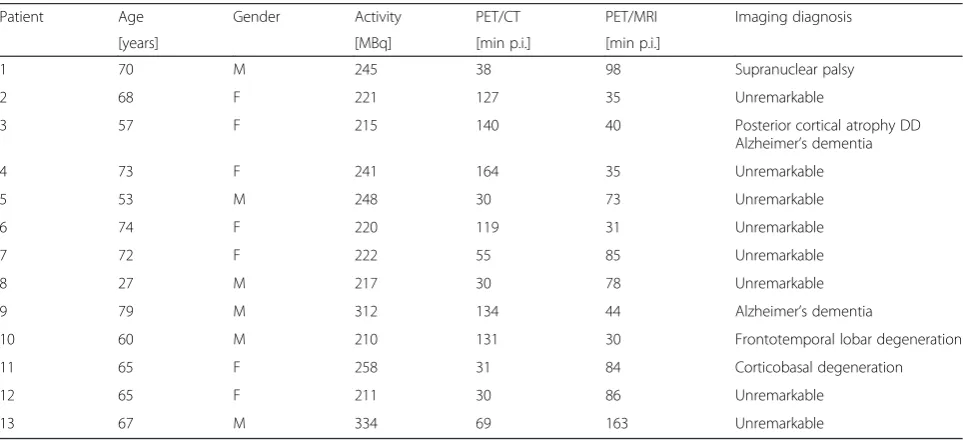
Table 1Patient characteristics
Patient Age Gender Activity PET/CT PET/MRI Imaging diagnosis
[years] [MBq] [min p.i.] [min p.i.]
1 70 M 245 38 98 Supranuclear palsy
2 68 F 221 127 35 Unremarkable
3 57 F 215 140 40 Posterior cortical atrophy DD
Alzheimer’s dementia
4 73 F 241 164 35 Unremarkable
5 53 M 248 30 73 Unremarkable
6 74 F 220 119 31 Unremarkable
7 72 F 222 55 85 Unremarkable
8 27 M 217 30 78 Unremarkable
9 79 M 312 134 44 Alzheimer’s dementia
10 60 M 210 131 30 Frontotemporal lobar degeneration
11 65 F 258 31 84 Corticobasal degeneration
12 65 F 211 30 86 Unremarkable
overview of the image postprocessing steps and the dif-ferent PET data obtained for comparative analysis.
PET data postprocessing
(1) The PET data from PET/CT for each subject were co-registered to the PET data from PET/MRI, using six degrees of freedom (FLIRT, FSL ToolBox). The resulting transformation was also used to co-register the CT to the structural T1 MPRAGE MRI. Successful coregistra-tion was visually verified and manually corrected if ne-cessary using PMOD (PMOD 3.4, Zurich, Switzerland). An MPRAGE-based head mask (brain extraction tool, FSL ToolBox) was then superimposed on to the co-registered CT to automatically remove signals from extra cranial structures such as the CT eye shields and the CT patient table. CT-Hounsfield units were linearly transferred toμvalues using a bilinear transfer function as described before [10]. The resulting μ-maps of the skull and brain were used to replace voxels in the original Dixon μ-maps (CTderived μ-map). (2) Using a recently introduced classifier [11], attenuation values for the head (including bone) were predicted from the anatomical
information from the T1 MPRAGE (PseudoCT μ-map).
(3) As a very simple alternative to the latter, these sophisti-cated algorithms, aμ-map was generated from the Dixon and UTE data (if available) imitating the UTE triple-echo (UTILE) method [4]. The bone information was extracted from UTE-based μ-maps and was laid over the original Dixon images using simple algebraic tools (miconv, micalc) from the ODIN framework (BoneDixon μ-map) [12]. Sub-sequently, all the resulting manipulatedμ-maps were back-transfered to the console and used for reconstruction of PETCTderived/PseudoCT/BoneDixonwith exactly the same recon-struction parameters as outlined above (see Fig. 1).
Visual PET image analysis
All PET datasets (PETDixon/CTderived/PseudoCT/BoneDixon and PETPETCTfor each patient) were visually evaluated in random order by three readers who were experienced in FDG brain PET data analysis and blinded to the patient details and diagnosis. For that purpose, the readers evalu-ated (1) transaxial PET slices of the FDG images, (2) three-dimensional z-score surface projections as obtained by the NEUROSTAT software [13], and (3) transaxial z-score slices
Fig. 1FDG brain PET image reconstruction and postprocessing.aPET/CT delivered a low-dose CT (intrasystemly CT-derivedμ-map not shown), and the resulting PETPETCTserved as standard of truth for the visual analysis in this study.bPET/MRI was acquired on the same day. Using differentμ-maps but the
same reconstruction parameters, four PET datasets were reconstructed in PET/MRI. Dixon-standard Dixonμ-map; CT-derived—Hounsfield units from the low-dose CT were bilinearly transferred toμvalues which replaced values in the original Dixonμ-map; PseudoCT—a pseudo CT was calculated using a T1-weighted native MRI according to Poynton et al.[11]; BoneDixon-bone voxelsμvalues from the vendor specific ultrashort echo time (UTE) sequence were replaced in the original Dixonμ-map.cPETCTderivedserved as standard for the quantitative analyses across different PET/MRI reconstructions in this study.
For each patient, the percent deviations between and PETDixon/PseudoCT/BoneDixonand PETCTderivedwere calculated, resulting in relatively small deviations
as obtained by the Hermes BRASS software (Hermes Med-ical Solutions, Stockholm, Sweden). Overall, 12 brain areas were classified in a binary fashion as either hypo-metabolic or normal (frontal lobe right/left (r/l), tem-poral lobe r/l, parietal lobe r/l, occipital lobe r/l, anterior cingulate gyrus, posterior cingulate gyrus, cere-bellum r/l). Moreover, the visual evaluation included a pattern analysis of the hypometabolism, and readers had to formulate a suspected diagnosis.
Quantitative PET image analysis
Statistical parametric mapping (SPM8; Wellcome Trust Centre for Neuroimaging, London, UK) was used to compare the PETCTderiveddatasets (which were considered the gold standard) with corresponding PETDixon/PseudoCT/BoneDixon datasets and to identify brain areas with divergent PET activity. For this pur-pose, spatial normalization was determined based on the co-registered T1-images and smoothing was per-formed with an 8-mm full-width at half-maximum on a Gaussian filter. A pairedttest was applied for group comparison. Thresholds were set at p< 0.001, uncor-rected. Further, to quantify AC-related regional
differ-ences between PETCTderived and the corresponding
PETDixon/PseudoCT/BoneDixon datasets, an atlas-based VOI analysis was performed by employing the HAMMERS template in PMOD. The percentage deviation of PETDixon/PseudoCT/BoneDixon as compared to PETCTderived was calculated for each voxel across patients as follows:
%
½ VoxelDixon=PseudoCT=BoneDixon
¼ PETDixon=PseudoCT=BoneDixon−PETCTderived
=PETCTderived 100
Mean images were subsequently averaged across pa-tients to obtain one mean-average PET image for each reconstruction.
Results
VOI analysis
The volumes of interest (VOI)-based quantificational ana-lysis revealed that, across all VOIs, there was a−11.9, +2.3,
and −7.4 % deviation of FDG uptake in PETDixon,
PETPseudoCT, and PETBoneDixon compared to PETCTderived. Detailed results for the single brain areas are provided in Table 1. The highest uptake differences between
PETCTderived and PETDixon in favor of PETCTderived
were found in the frontal, parietal, and occipital lobes, and in the cerebellum (~13 to 16 %), while the lowest differences were found in deeper structures like the corpus callosum and the ventricles (~2 %). Similarly,
the highest difference between PETBoneDixon and
PETCTderived were detected in the frontal, temporal, and occipital lobe, and in the cerebellum (~8 to 10 %)
and the lowest were found in the ventricles and the corpus callosum (~0 to 2 %). In contrast, the uptake
dif-ferences between PETCTderived and PETPseudoCT were
much lower and generally in favor of PETPseudoCT. In the temporal, frontal, and occipital lobe, and in the cerebel-lum, differences of up to ~3 to 4 % were found, whereas the difference in deeper brain structures was negligible (~0 to 2 % basal ganglia, brainstem, and corpus callosum).
Visual analysis
Using PETPETCTas reference, in nine patients, the hypo-metabolism was either predominantly unremarkable or could not be related to any characteristic pathologic pat-tern so that the suspected diagnosis remained unspecific. In three patients, an Alzheimer’s dementia (AD) and in one patient a frontotemporal lobar degeneration (FTLD) was suspected. In one patient, no coherent suspected diagnosis could be formulated, and there was a mis-match compared to PETPETCTaccording to the majority decision (Table 2, Fig. 2). This 65-year-old female patient suffered from a progressive movement disorder with spasticity in all four limbs, ataxia, and a cerebellar syndrome—the clinical and imaging-based diagnosis was corticobasal degeneration. Without knowledge on clinical symptoms, the blinded readers suspected this PET scan as either unspecific or considered an AD or a type of FTLD as the most likely diagnosis. However, no systematic reading error across the readers and the different PET reconstruc-tions could be observed in this case. Also, using PETPETCT as reference, in 85–100 % of patients, the suspected diagno-sis from PETDixon/CTderived/PseudoCT/BoneDixonwas correct for all readers, whereas none of the reconstructions were infer-ior to the others.
The number of hypometabolic regions per patient, as visually assessed, did not differ significantly between PETCT-derived, PETDixon, PETPseudoCT, and PETBoneDixon in all readers and ranged from 1 to 2, 1 to 3, and 2 to 3 for readers 1, 2, and 3 (Table 3). Moreover, for PETCTderived, PETDixon, PETPseudoCT, and PETBoneDixon, the number of correctly classified brain regions was determined according to the standard of truth PETPETCT. When interpreting
Hermes BRASS from PETDixon as compared to
PETPseu-doCT, reader 2 classified significantly more brain regions correctly (p= 0.012). Apart from that, the number of correctly classified brain regions did not differ between PETCTderived, PETDixon, PETPseudoCT, and PETBoneDixon across patients, and no systematic inferiority of any recon-struction was observed. Numbers of correctly classified brain regions ranged from 9 to 11, 10 to 12, and 9 to 11 for readers 1, 2, and 3 (Table 3).
Statistical parametric mapping (SPM) analysis
Table 2Suspected diagnosis in comparison to PETPETCTgold standard
The suspected diagnosis from PETCTderived, PETDixon, PETPseudoCTand PETBoneDixondid either match (green) or mismatch (orange) with the diagnosis from the gold
standard PETPETCT. According to a majority decision, there was a mismatch only in patient 13 for PETPseudoCTand PETBoneDixon. Note: despite the quantificational
difference, the suspected diagnosis for this particular patient did not differ between PETPETCTand PETCTderivedaccording to either of the readers.ADAlzheimer’s
a widespread area covering the whole cortex and the cerebellum (Fig. 3a). The effect was less pronounced in PETBoneDixon in terms of intensity and level of sig-nificance but still affected the whole brain. Relative FDG uptake was significantly higher in PETPseudoCTas compared to PETCTderived in more restricted areas, in-cluding the primary and parietotemporal cortices as well as the cerebellum.
Discussion
In this sequential brain FDG PET/MRI and PET/CT study in 13 patients, the Dixonμ-map was systematically complemented by bone information from (1) CT as ob-tained by PET/CT resulting in PETCTderived, by (2) MR anatomy information resulting in PETPseudoCT, and (3) by help of an UTE sequence resulting in PETBoneDixon. We found that ignoring bone in this patient population did result in ~12 % uptake underestimation. This is in line with prior studies stating that due to the omission of bone, the underestimation of the PET signal ranges from to 11 to 25 % [3–5]. When using an ultrashort echo sequence for bone classification or accounting for cortical bone by use of a recently proposed [11] MR-based method to predict continuous attenuation values for the bony skull, the FDG uptake estimation was
improved (~7 % underestimated or ~2 % overestimated). Also, these results are in line with prior studies [11, 14]. However, to the best of our knowledge, the only FDG PET study evaluating the clinical impact of different at-tenuation correction approaches suffered from different reconstruction parameters and scanner properties [8]. In our study, the only source of variation between the PET datasets were theμ-maps themselves; thus, the data was directly comparable without normalization. This allowed to study the direct clinical impact of the above-described AC-related FDG uptake presentation differences on the clinical FDG brain PET diagnosis. Here, even though the unaffected cortical PET activity in PETDixon/BoneDixonwas substantially lower, the clinical impact was neglibile; three experienced readers did not rate systematically more brain areas as“hypometabolic” after visual inspec-tion of the PETDixon/CTderived/PseudoCT/BoneDixonslices and after evaluation of the statistical analyses of the normal-ized PET data (NEUROSTAT and BRASS). In line with that, a clinical evaluation of different ACs in comparison to the gold standard resulted in no differences in the number of hypometabolic areas as identified by the readers for each patient. Furthermore, the FDG PET diagnosis was not more severe in AC approaches that
tend to underestimate the cortical PET signal
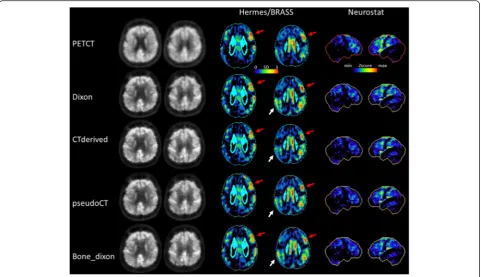
Fig. 2Patient example. Sixty-five-year-old women with clinical and imaging-based diagnosis of corticobasal degeneration. Relative FDG uptake was severely impaired in the left frontal regions (red arrows). Additionally, there was some degree of relative bilateral uptake deficiency in parietal areas which was more pronounced in PETDixonbut also apparent in PETBoneDixonas compared to PETCTderived(white arrows), resulting in an imaging
diagnosis of Alzheimer’s disease in PETPseudoCT/BoneDixonfor reader 1 and in PETDixon/PseudoCT/BoneDixonfor reader 2. Note: readers were blinded to the
(PETBoneDixon, PETDixon) in any of the patients; despite the above mentioned quantificational difference, the large proportion of unspecific cases was not misdiag-nosed as pathologic in PETBoneDixon, and PETDixon as compared to PETPETCT, PETCTderived, and PETBoneDixon. Taken together, the quantificational difference by the omission of bone did not translate into a systematic diagnostic error in our FDG PET/MRI(CT) study. This was probably because this global effect may change inten-sities of apparent cortical hypometabolism but not the overall pattern of hypometabolism, which is decisive. Moreover, this global effect did not lead to the typical decrease-vs.-normal contrast along the gray matter (e.g., the occipital cortex exhibits normal glucose metabolism and the adjacent parietal cortex does not in Alzheimer’s dementia).
A limitation of this investigation is the limited number of subjects examined that does not represent the larger variety of diseases whose diagnosis is often supported by FDG brain PET (namely, Alzheimer’s disease, frontotemporal
dementia, dementia with Lewy bodies, Parkinson’s disease, progressive supranuclear palsy, multiple system atrophy, corticobasal degeneration, and Huntington’s disease). As a matter of future research, the evaluation of the impact of AC-related FDG PET quantificational differences on the evaluation of patients with atypical parkinsonian syndrome, like multiple system atrophy or supranuclear palsy, would be interesting. In these patients, subcortical regions as well as the cerebellum which is heavily surrounded by bony structure might also be involved, and the AC-related quan-tificational error could thus be of clinical relevance.
Moreover, (at least) for research applications, an MR-AC-related error of ~12 % for FDG brain PET in case of bone omission needs to be considered and should be further decreased by the usage of recently introduced MR-based algorithms to predict continuous μ values. However, the difference in FDG uptake of 2.3 % between PETPseudoCT and PETCTderivedas observed in this study seems acceptable for most brain regions even for research applications. Table 3Reading results
Reader PETPET/CT PETCTderived PETDixon PETPseudoCT PETBoneDixon
1 Hypometabolic areas (visual) 1.1 ± 1.7 1.3 ± 2.1 1.6 ± 2.0 1.3 ± 1.7 1.7 ± 1.7
Hypometabolic areas (NEUROSTAT) 1.5 ± 2.1 1.8 ± 2.0 2.4 ± 2.1 2.3 ± 2.3 1.9 ± 2.0
Hypometabolic areas (BRASS) 1.1 ± 1.6 1.9 ± 2.6 2.2 ± 2.3 2.1 ± 2.1 2.1 ± 2.1
Correctly classified brain regions compared to PETPET/CT(visual) 10.8 ± 1.7 10.6 ± 1.5 10.5 ± 1.9 9.1 ± 2.3
Correctly classified brain regions compared to PETPET/CT(NEUROSTAT) 10.9 ± 1.7 10.6 ± 1.8 10.7 ± 2 9.6 ± 2.5
Correctly classified brain regions compared to PETPET/CT(BRASS) 10.9 ± 1.7 10.5 ± 1.7 10.7 ± 1.7 9.6 ± 1.7
Correct imaging diagnosis compared to PETPET/CT 11/13 11/13 11/13 7/7
2 Hypometabolic areas (visual) 1.4 ± 2.0 1.4 ± 1.9 1.3 ± 1.7 1.5 ± 2.2 1.7 ± 2.1
Hypometabolic areas (NEUROSTAT) 2.8 ± 3.1 2.1 ± 2.4 2.5 ± 2.8 1.8 ± 2.3 3.0 ± 2.7
Hypometabolic areas (BRASS) 2.2 ± 2.9 1.9 ± 2.4 2.2 ± 2.8 1.1 ± 2.0 1.3 ± 2.1
Correctly classified brain regions compared to PETPET/CT(visual) 11.5 ± 0.7 11.6 ± 0.9 10.8 ± 1.8 11.1 ± 1.1
Correctly classified brain regions compared to PETPET/CT(NEUROSTAT) 11.2 ± 1.1 11.2 ± 1.4 10.4 ± 2.4 10.7 ± 1.7
Correctly classified brain regions compared to PETPET/CT(BRASS) 11.0 ± 1.2 11.4 ± 0.7* 10.4 ± 1.5* 10.1 ± 1.5
Correct imaging diagnosis compared to PETPET/CT 13/13 12/13 12/13 6/7
3 Hypometabolic areas (visual) 1.8 ± 2.5 2.1 ± 1.8 2.6 ± 1.9 2.5 ± 1.9 2.7 ± 1.9
Hypometabolic areas (NEUROSTAT) 2.2 ± 2.5 1.9 ± 1.6 2.5 ± 1.9 2.5 ± 1.8 2.1 ± 1.6
Hypometabolic areas (BRASS) 2.2 ± 2.5 1.9 ± 1.7 2.4 ± 1.7 2.6 ± 1.9 2.1 ± 1.6
Correctly classified brain regions compared to PETPET/CT(visual) 10.8 ± 1.7 10.6 ± 1.5 10.5 ± 1.9 9.1 ± 2.3
Correctly classified brain regions compared to PETPET/CT(NEUROSTAT) 10.7 ± 1.6 10.8 ± 1.3 10.5 ± 1.9 9.1 ± 2.3
Correctly classified brain regions compared to PETPET/CT(BRASS) 10.9 ± 1.7 10.6 ± 2.8 10.7 ± 2.0 9.6 ± 2.5
Correct imaging diagnosis compared to PETPET/CT 11/13 11/13 11/13 7/7
PETPET/CT, PETCTderived, PETDixon, PETPseudoCT, and PETBoneDixonfrom 13 patients were evaluated by three experienced readers. For each PET, 12 brain areas were
classified as either hypometabolic or normal according to the visual impression and according to the semiquantitiative approaches NEUROSTAT and BRASS. For
PETCTderived, PETDixon, PETPseudoCT, and PETBoneDixon, the number of correctly classified brain regions was determined according to the standard of truth PETPETCT.
Moreover, the readers were asked to formulate an imaging diagnosis on the basis of the PET data without clinical information. The imaging diagnosis was also compared to the standard of truth PETPETCT. For PETPETCT, PETCTderived, PETDixon, and PETPseudoCT(PETBonedixon), paired (two-sampled)ttests (two-sided;α= 0.05) were calculated.αwas Bonferroni corrected for multiple comparisons. The number of hypometabolic areas across the patients did not differ significantly between
PETCTderived, PETDixon, PETPseudoCT, and PETBoneDixonand the reference: PETPETCTin either of the readers. *Reader 2 classified significantly more brain regions
Of note, the relative robustness of diagnostic accuracy against AC-related errors as observed in this present FDG brain PET study cannot simply be translated to other PET tracers or to other body regions without fur-ther investigation. Even though a recent study observed a similarly limited impact of the Dixon based MR-AC on clinical diagnosis in amyloid-PET, we would be careful in assuming that this holds true for neurological PET studies in general [15]. The contrast between the cortical signal (on the surface) and the white matter signal (dee-per location) may compromise the quantification of cerebral blood flow [16] and may have an impact on the quantification of amino acid turnover in small tumor lesions close to the skull [7]. Thus, a standardized vendor-based implementation of advanced AC algo-rithms that can provide accurate skull CT surrogates [11, 17] remains highly desirable for future PET/MRI systems and their clinical and research applications.
Conclusions
Despite a quantitative error by the omission of bone in MR-AC, clinical quality of brain [18 F]FDG is not rele-vantly affected in this patient cohort with suspected demen-tia and movement disorders. Thus, brain [18 F]FDG PET can already, even now with suboptimal MR-AC, be utilized for clinical routine purposes. Advanced AC algorithms that
can provide accurate skull CT surrogates reduced the differ-ence in FDG uptake to a minimum that is even acceptable for quantification in research applications.
Ethics approval and consent to participate
All retrospective analyses involving human participants in the present study were approved by the local institu-tional Review Board (# 065-14-10032014) and were in accordance with the principles of the 1964 Declaration of Helsinki and its later amendments or comparable eth-ical standards. Informed consent was obtained.
Competing interests
Osama Sabri served as the primary investigator for Siemens Healthcare. Osama Sabri and Henryk Barthel received speaker honoraria from Siemens Healthcare. Peter Werner, Michael Rullmann, Anke Bresch, Solveig Tiepolt, Thies Jochimsen, Matthias Schroeter, and Donald Lobsien report no disclosures relevant to the manuscript.
Authors’contributions
PW contributed to the clinical data collection and nuclear medicine data collection. MR, PW, and TJ contributed to the PET, MRI, and CT data processing and image data analysis. DL contributed to the MRI data analysis and patient treatment. MLS contributed to the patient treatment and contributed to the revised manuscript. HB, PW, and ST contributed to the clinical data analysis and patient treatment. OS and HB contributed to the study concept. All authors participated in the interpretation of the data and in the drafting of the manuscript. All authors read and approved the final version of the manuscript.
Fig. 3Comparison of different attenuation correction approaches in FDG brain PET/MRI.aRelative FDG uptake comparison by statistical parametric mapping between PETPseudoCT/BoneDixon/Dixonvs. PETCTderivedfrom the 13 patients investigated (note: PETBoneDixonwas available in seven patients only).
Midsagittal and lateral projections: significance level ofp< 0.001;Tvalue >3.9 (T> 5.2 for PETBoneDixondue to lower sample size). Relative FDG uptake
was significantly lower in PETDixon/BoneDixonas compared to PETCTderivedin a widespread area covering occipital, parietotemporal, and parieto-occipital
cortices as well as the cerebellum. FDG uptake was significantly higher in PETPseudoCTas compared to PETCTderivedin more restricted areas, including
Acknowledgments
The authors are particularly grateful for the invaluable support of Torsten Böhm, Tanja Uhlisch, Tanja Winkler and Katja Römuß in patient preparation and PET/MRI/CT data acquisition.
Funding
The work was supported by the German Research Foundation that funded the PET/MRI system (grantcode: SA 669/9-1). The Max Planck Society co-funded the system. We acknowledge support from the German Research Foundation (DFG) and Universität Leipzig within the program of Open Access Publishing.
Author details
1Department of Nuclear Medicine, Leipzig University Hospital, Leipzig, Germany.2Department of Neuroradiology, Leipzig University Hospital, Leipzig, Germany.3Day Clinic for Cognitive Neurology, Leipzig University Hospital and Max Planck Institute for Human Cognitive and Brain Sciences, Leipzig, Germany.
Received: 24 March 2016 Accepted: 23 May 2016
References
1. Schmidt H, Schwenzer NF, Bezrukov I, Mantlik F, Kolb A, Kupferschläger J, et al. On the quantification accuracy, homogeneity, and stability of simultaneous positron emission tomography/magnetic resonance imaging systems. Invest Radiol. 2014;49:373–81.
2. Delso G, Fürst S, Jakoby B, Ladebeck R, Ganter C, Nekolla SG, et al. Performance measurements of the Siemens mMR integrated whole-body PET/MR scanner. J Nucl Med. 2011;52:1914–22.
3. Navalpakkam BK, Braun H, Kuwert T, Quick HH. Magnetic resonance-based attenuation correction for PET/MR hybrid imaging using continuous valued attenuation maps. Invest Radiol. 2013;48:323–32.
4. Berker Y, Franke J, Salomon A, Palmowski M, Donker HCW, Temur Y, et al. MRI-based attenuation correction for hybrid PET/MRI systems: a 4-class tissue segmentation technique using a combined ultrashort-echo-time/ Dixon MRI sequence. J Nucl Med. 2012;53:796–804.
5. Andersen FL, Ladefoged CN, Beyer T, Keller SH, Hansen AE, Højgaard L, et al. Combined PET/MR imaging in neurology: MR-based attenuation correction implies a strong spatial bias when ignoring bone. Neuroimage. 2014;84:206–16.
6. Law I, Andersen FL, Hansen AE, Hasselbalch SG, Ladefoged C, Keller SH, et al. Quantification and accuracy of clinical [11C]-PiB PET/MRI: the effect of MR-based attenuation correction. EJNMMI Phys. 2014;1:A69. 7. Bailey DL, Pichler BJ, Gückel B, Barthel H, Beer AJ, Bremerich J, et al.
Combined PET/MRI: multi-modality multi-parametric imaging is here: summary report of the 4th International Workshop on PET/MR Imaging; February 23–27, 2015, Tübingen, Germany. Mol Imaging Biol. 2015;17:595–608.
8. Hitz S, Habekost C, Fürst S, Delso G, Förster S, Ziegler S, et al. Systematic comparison of the performance of integrated whole-body PET/MR imaging to conventional PET/CT for 18 F-FDG brain imaging in patients examined for suspected dementia. J Nucl Med. 2014;55:923–31.
9. Varrone A, Asenbaum S, Vander Borght T, Booij J, Nobili F, Någren K, et al. EANM procedure guidelines for PET brain imaging using [18 F]FDG, version 2. Eur J Nucl Med Mol Imaging. 2009;36:2103–10.
10. Carney JPJ, Townsend DW, Rappoport V, Bendriem B. Method for transforming CT images for attenuation correction in PET/CT imaging. Med Phys. 2006;33:976–83.
11. Poynton CB, Chen KT, Chonde DB, Izquierdo-Garcia D, Gollub RL, Gerstner ER, et al. Probabilistic atlas-based segmentation of combined T1-weighted and DUTE MRI for calculation of head attenuation maps in integrated PET/MRI scanners. Am J Nucl Med Mol Imaging. 2014;4:160–71.
12. Jochimsen TH, von Mengershausen M. ODIN—object-oriented development interface for NMR. J Magn Reson. 2004;170:67–78. 13. Minoshima S, Frey KA, Koeppe RA, Foster NL, Kuhl DE. A diagnostic
approach in Alzheimer’s disease using three-dimensional stereotactic surface projections of fluorine-18-FDG PET. J Nucl Med. 1995;36:1238–48. 14. Keereman V, Fierens Y, Broux T, De Deene Y, Lonneux M, Vandenberghe S.
MRI-based attenuation correction for PET/MRI using ultrashort echo time sequences. J Nucl Med. 2010;51:812–8.
15. Su Y, Rubin B, McConathy J, Laforest R, Qi J, Sharma A, et al. Impact of MR based attenuation correction on neurological PET studies. J. Nucl. Med. 2016. [Epub ahead of print]
16. Werner P, Saur D, Zeisig V, Ettrich B, Patt M, Sattler B, et al. Simultaneous PET/MRI in stroke: a case series. J. Cereb. Blood Flow Metab. Off. J. Int. Soc. Cereb. Blood Flow Metab. 2015;35:1421–5.
17. Delso G, Wiesinger F, Sacolick LI, Kaushik SS, Shanbhag DD, Hüllner M, et al. Clinical evaluation of zero-echo-time MR imaging for the segmentation of the skull. J Nucl Med. 2015;56:417–22.
Submit your manuscript to a
journal and benefi t from:
7Convenient online submission 7Rigorous peer review
7Immediate publication on acceptance 7Open access: articles freely available online 7High visibility within the fi eld
7Retaining the copyright to your article