R E S E A R C H A R T I C L E
Open Access
Visual evoked potentials in subgroups of
migraine with aura patients
Gianluca Coppola
1*, Martina Bracaglia
2, Davide Di Lenola
2, Cherubino Di Lorenzo
3, Mariano Serrao
2, Vincenzo Parisi
1,
Antonio Di Renzo
1, Francesco Martelli
4, Antonello Fadda
4, Jean Schoenen
5and Francesco Pierelli
2,6Abstract
Background:Patients suffering from migraine with aura can have either pure visual auras or complex auras with sensory disturbances and dysphasia, or both. Few studies have searched for possible pathophysiological differences between these two subgroups of patients.
Methods:Methods - Forty-seven migraine with aura patients were subdivided in a subgroup with exclusively visual auras (MA,N =27) and another with complex neurological auras (MA+,N =20). We recorded pattern-reversal visual evoked potentials (VEP: 15 min of arc cheques, 3.1 reversal per second, 600 sweeps) and measured amplitude and habituation (slope of the linear regression line of amplitude changes from the 1st to 6th block of 100 sweeps) for the N1-P1 and P1-N2 components in patients and, for comparison, in 30 healthy volunteers (HV) of similar age and gender distribution.
Results:VEP N1-P1 habituation, i.e. amplitude decrement between 1st and 6th block, which was obvious in most HV (mean slope−0.50), was deficient in both MA (slope +0.01,p =0.0001) and MA+ (−0.0049,p =0.001) patients. However, VEP N1-P1 amplitudes across blocks were normal in MA patients, while they were significantly greater in
MA+ patients than in HVs.
Conclusions:Our findings suggest that in migraine with aura patients different aura phenotypes may be underpinned by different pathophysiological mechanisms. Pre-activation cortical excitability could be higher in patients with complex neurological auras than in those having pure visual auras or in healthy volunteers.
Keywords:Migraine with aura, Visual aura, Complex aura, Visual evoked potentials, Habituation, Cortical excitability
Background
Migraine with aura (MA) is defined as attacks of neuro-logical symptoms that last no more than 60 min and may be followed or accompanied by headache (International Classification of Headache Disorders 3beta 2013). The most common aura symptoms are visual (e.g. scintillating scotoma), while sensory and aphasic auras are present in a smaller proportion of patients [1, 2]. According to Rasmussen and Olesen [3], 51 % of migraine auras are purely visual, while 4 % comprise sensory symptoms in addition to the visual ones and 6 % language disturbances in addition to visual and sensory disturbances.
The most likely cause of the migraine aura, Leão’s cortical spreading depression (CSD), consists of a brief neuronal depolarisation followed by a long-lasting wave of neuronal depression that often spreads postero-anteriorly in the occipital cortex and can reach the parietal and/or temporal lobes [4, 5]. Indirect evidence for CSD occurrence in migraine patients stems from functional neuroimaging [6–8] and electrophysiological [9] studies. Although in animal models CSD is able to activate peripheral and central trigeminovascular neurons that underlie the migraine headache [10, 11], knowledge is lacking on the possible relation of CSD to interictal neural alterations that may predispose to migraine attacks.
During the last decade various research groups have demonstrated significant changes of bioelectrical activity in the visual cortex of migraine patients over the migraine cycle. In particular, cortical visual evoked potentials (VEPs) * Correspondence:[email protected]
1
G.B. Bietti Foundation-IRCCS, Department of Neurophysiology of Vision and Neurophthalmology, Via Livenza 3, 00198 Rome, Italy
Full list of author information is available at the end of the article
are used to infer the mass activity of visual cortical neurons. Most, though not all [12], VEP, recordings have shown that the brain of migraineurs with and without aura is characterized by an interictal deficit of habituation during stimulus repetition, and by its ictal normalization [13–16]. It was suggested that migraine with aura is a condition with a spectrum of clinical subtypes that likely differ in pathophysiological mechanisms [17]. Distinct electro-physiological abnormalities were especially found at the neuromuscular junction in patients suffering from com-plex neurological auras characterized by visual symptoms followed by sensorimotor and dysphasic symptoms [18] or from prolonged auras [19]. Using 1H-MR-spectroscopy, migraine patients with visual symptoms and at least one of paraesthesia, paresis, or dysphasia had a significant lac-tate increase in the visual cortex during sustained visual stimulation, while this was not the case in controls and patients with exclusive visual aura. In the latter group, however, lactate levels were already elevated at baseline and remained consistently high during the visual stimula-tion [20]. Besides its role as energy substrate of the brain, lactate acts as a neuromodulator and interacts with glu-tamate [21], GABA [22], and monoamines [23], which suggest that it is important in regulating the activity of cortical neurons. Lactate may increase to attenuate the electrical activity of excessively active neurons as ob-served in experimental models [22, 24, 25] and in healthy humans during sustained visual stimulation [26]. Considering these data and those obtained by NMR spectroscopy showing altered metabolic homeostasis of the migraineur’s brain [27, 28], it is of interest to verify whether activity of visual cortical neurons is increased in migraine patients suffering from complex auras respective to those experiencing pure visual symptoms. We decided therefore to compare amplitude and habituation of pat-tern reversal VEP in healthy volunteers, migraine patients with pure visual auras, and in patients with complex neurological auras including at least one of sensory and language symptoms in addition to visual disturbances. Con-sidering the abovementioned NMR spectroscopy studies and our prior interictal VEP studies in migraine with aura [14, 15], we reasoned that subgroups of migraine with aura
patients would show both common and specific neuro-physiological abnormalities. We hypothesized that VEP amplitude would be higher in migraine with complex aura than in migraine with pure visual aura, while habituation would be equally deficient in both MA subgroups.
Methods
Subjects
We initially enrolled 58 consecutive migraine patients with typical aura (MAtot, ICHD-3beta code 1.2.1.1) who attended our headache clinic. We discarded recordings of 10 patients who did not fulfil our primary inclusion criteria (see below), and of one patient because he was an outlier. The final analysis set comprises therefore 47 patients (32 women, mean age 31.8 years). Patients were subdivided into those who experienced pure visual aura (MA,N =27) and those who had in addition paraesthe-sia and/or dysphaparaesthe-sia (i.e. complex neurological auras;
MA+, N =20). Auras usually developed gradually and
were followed by headache. None had hemiplegic or brainstem auras or persistent aura without infarction. All patients had a varying combination of attacks with or without aura. We took information on various clinical characteristics by collecting up to two-month headache diaries at the time of the screening visit and the day of the recording session. Patients had to indicate duration of migraine history (years), attack frequency (n/month), attack duration (hours), and number of days elapsed since the last migraine attack (in 35 out of 47 patients) (Table 1).
A primary inclusion criterion was being attack-free for at least 3 days before and after the recording sessions, as checked by collecting headache diaries, and by telephone or e-mail interviews. Migraine patients were recorded in the interictal period. The time range of 3 days was chosen to avoid the accidental inclusion of patients re-corded during an attack. In fact, according to the Inter-national classification of Headache Disorders, a migraine attack can last up to 3 days. Of the patients initially recorded, ten patients had an attack within 3 days after the recording session, and thus their VEP data were not included in the present analysis. We chose to focus on interictal recordings because some previous studies
Table 1Clinical and demographic characteristics of healthy volunteers (HV), the total group of migraine with aura patients (MAtot) and its subgroups with pure visual aura (MA) or visual aura associated with paraesthesia and/or dysphasia (MA+). Data are expressed as means ± SD
Characteristics HV (n =30) MAtot (n =47) MA (n =27) MA+ (n =20)
Women (n) 18 32 17 15
Age (years) 33.4 ± 13.4 31.8 ± 9.3 31.7 ± 9.4 32.5 ± 9.5
Duration of migraine history (years) 16.1 ± 9.9 15.3 ± 9.5 17.0 ± 10.5
Attack frequency/month (n) 2.5 ± 2.6 2.1 ± 2.2 2.9 ± 3.0
Attack duration (hours) 28.8 ± 25.4 29.9 ± 27.2 27.4 ± 23.3
showed that habituation reflects the periodicity between 2 migraine attacks, i.e. is lacking between attacks and normalizes immediately before and during an attack [15, 29]. For comparison, we enrolled a group of 30 age-matched healthy volunteers (18 women, mean age 33.4 years) recruited among medical school students and healthcare professionals, randomly recorded between patients. Exclusion criteria were regular medication intake (i.e. antibiotics, corticosteroids, antidepressants, benzodi-azepines, prophylactic migraine drugs) except for the contraceptive pill, failure to reach a best-corrected visual acuity of > 8/10, history of other neurological diseases, sys-temic hypertension, diabetes or other metabolic disorders, connective or autoimmune diseases, and any other type of primary or secondary headache. Female participants were always recorded at mid-cycle. All participants (HV and MwA) were naïve to the study procedure. We did not give any recommendation and/or information to HV or patients about potential clinical benefits or harms associated with the recordings.
All participants received a complete description of the study and granted written informed consent. The ethical review board“Sapienza”University of Rome, Polo Pontino, approved the project.
Visual evoked potentials
Subjects were sitting in an acoustically isolated room with dimmed lights in front of a TV monitor surrounded by a uniform luminance field of 5 cd/m2. To obtain a stable pupillary diameter, each subject adapted to the ambient room light for 10 min before the VEP record-ings. VEP were elicited by right monocular stimulation. Visual stimuli consisted of full-field checkerboard pat-terns (contrast 80 %, mean luminance 50 cd/m2) gener-ated on a TV monitor; the reversal rate was 1.55 Hz (3.1 reversal per second)). At the viewing distance of 114 cm, the single checks subtended a visual angle of 15 min, while the checkerboard subtended 23°. Recordings were
done with the best corrected visual acuity of > 8/10 at the viewing distance. Subjects were instructed to fixate with their right eye a red dot in the middle of the screen with the contralateral eye covered by a patch to maintain stable fixation. VEP were recorded from the scalp through silver cup electrodes positioned at Oz (active electrode) and at Fz (reference electrode, 10/20 system). A ground electrode was placed on the right forearm. Signals were amplified by Digitimer™ D360 pre-amplifiers (band-pass
0.05–2000 Hz, gain 1000) and recorded with a CED™
power 1401 device (Cambridge Electronic Design Ltd, Cambridge, UK). A total of 600 consecutive sweeps each lasting 200 ms were collected and sampled at 4000 Hz.
After applying off-line a 35Hz low-pass digital filter, cortical responses were partitioned in 6 sequential blocks of 100, consisting of at least 95 artifact-free sweeps. Responses in each block were averaged off-line (“block averages”) using the Signal™software package version 4.10 (CED Ltd). Artefacts were automatically rejected using the Signal™ artefact rejection tool if the signal amplitude exceeded 90 % of analog-to-digital converter (ADC) range and was controlled by visual inspection. Through this approach, we made sure to exclude all severe artefacts but not to remove any signal systematically because background EEG amplitudes vary between subjects. The EP-signal was corrected off-line for DC-drifts, eye movements and blinks.
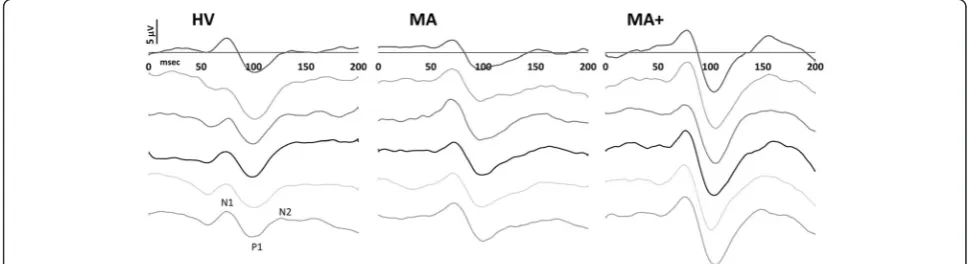
VEP components were identified according to their latencies: N1 was defined as the most negative peak between 60 and 90 ms, P1 as the most positive peak following N1 between 80 and 120 ms and N2 as the most negative peak following P1 at between 125 and 150 ms (Fig. 1). We measured the peak-to-peak ampli-tude of the N1–P1 and P1–N2 complexes. Habituation was defined as the slope of the linear regression line for the 6 blocks. All recordings were collected in the morning (between 09.00 and 11.00 a.m.) by the same investigators (D.D.L and C.D.L.), who did not meet the participants
prior to the examination, since they were not involved in recruitment and inclusion of subjects. All recordings were numbered anonymously and analyzed blindly off-line by one investigator (M.B.), who was not blinded to the order of the blocks.
Statistical analysis
We used the Statistica for Windows (StatSoft Inc.), version 8.0 for all analyses. Preliminary descriptive analysis showed that the VEP N1–P1 and P1–N2 peak-to-peak amplitudes of the six blocks and the habituation slopes had a non-normal distribution. After log transform-ation, all data reached normal distribution (Kolmogorov-Smirnov test,p >0.2).
A General Linear Model approach was used to analyze the “between-factor”דwithin-factors” inter-action effect. The between-subject factor was “group”
(HV vs. MAtot or HVvs. MA subgroups); the
within-subject factor was “blocks”. Two models of repeated measures ANOVA (rm-ANOVA) followed by univari-ate ANOVAs were employed to investigunivari-ate the inter-action effect. Univariate results were analyzed only if Wilks’ Lambda multivariate significance criterion was achieved. The sphericity of the covariance matrix was verified with the Mauchly Sphericity Test; in the case of violation of the sphericity assumption,
Greenhouse-Geisser (G-G) epsilon (ε) adjustment was used. In
rm-ANOVA and ANOVA models, partial eta2 η2
p and
observed power (op) were used as measures of effect size and power, respectively. To define which comparison(s) contributed to the major effects, post hoc tests were performed with Tukey Honest Significant Difference (HSD) test.
A regression analysis was used to disclose linear trends in VEP amplitude across blocks (slope) in each group. For slope, we employed ANOVA with group factor “group” (HVvs. MAtot or HVvs.MA subgroups), using Tukey test for post hoc analysis. Also for ANOVA partial eta2 and op was used. Statistical significance was set at p <0.05.
Pearson’s correlation test was used to search for corre-lations among VEP amplitude slopes and clinical vari-ables (duration of migraine history, attack frequency, attack duration, days since the last migraine attack).
Results
Recordings from 47 participants who fulfilled the inclu-sion criteria yielded analysable VEP data. The two pa-tient subgroups MA and MA+ did not differ in other clinical features (Table 1).
Total group of migraine with aura patients (MAtot)
N1, P1 and N2 latencies were not significantly different between HV and MAtot (p >0.05) (Table 2).
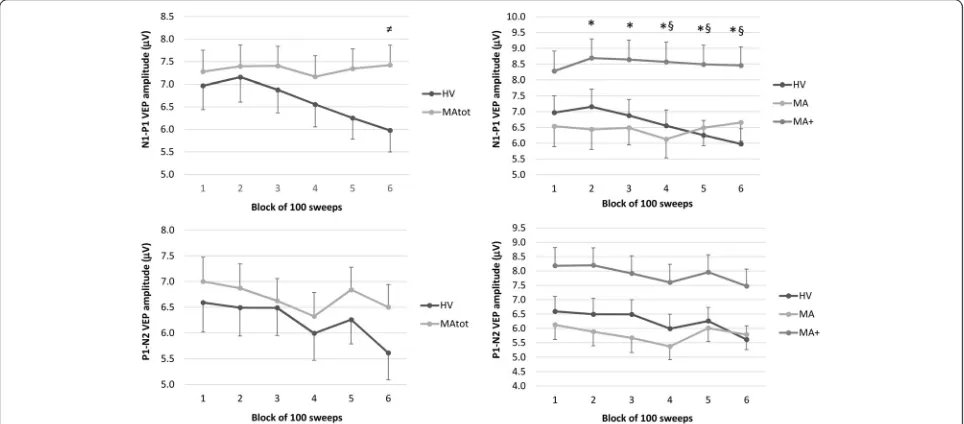
In the rm-ANOVA model with N1–P1 peak-peak amp-litude as dependent variable, multivariate test was signifi-cant for the “group”דblocks” interaction effect (Wilks’ Lambda = 0.745, F5,71= 4.862,p =0.0007) (Table 3). After checking that the sphericity assumption was not violated (Mauchley Test: p =0.104), univariate rm-ANOVAs for N1–P1 peak-peak amplitude confirmed the significant interaction factor effect (F5,375= 5.261, p =0.0001, par-tial η2= 0.066, op = 0.988) observed (see above) at the multivariate test. Post-hoc analysis showed that VEP amplitudes differed between groups only in the last block (5.97μV in HV vs. 7.42μV in MAtot,p =0.038, raw data are shown in Fig. 2). In HV, N1–P1 amplitude was significantly lower in the 6th compared to the 1st block (p =0.0008). This was not so in MAtot, where this comparison did not reach the significance level (p =0.994).
In the rm-ANOVA model with P1-N2 peak-peak amplitude as dependent variable, multivariate test was not significant for the “group”דblocks” interaction effect (Wilks’Lambda = 0.869, F5,71= 2.149,p =0.069) (Table 4).
The linear regression N1–P1 slope of VEP amplitudes over all blocks differed significantly between the two groups (F1,75= 24.493, p <0.0001, partial η2= 0.246, op = 0.998; raw data are shown in Fig. 3). The P1–N2 slope of the linear regression analysis was not different between groups (F1,75= 3.312, p =0.073, partial η2= 0.042, op = 0.435; Fig. 3).
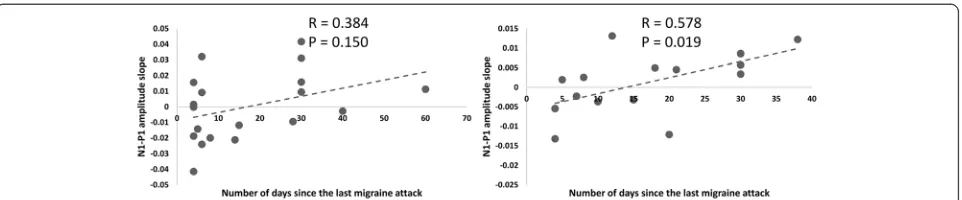
In the MAtot group the N1–P1 amplitude slope corre-lated positively with the number of days elapsed since the last migraine attack (r = 0.351,p =0.045). There were no other significant correlation between neurophysio-logical and clinical data.
Subgroups of migraine with aura patients
N1, P1 and N2 latencies were not significantly different between HV, MA or MA+ (P >0.05) (Table 2).
Table 2Latencies (in milliseconds) of VEPs in healthy volunteers (HV), the total group of migraine with aura patients (MAtot) and its subgroups with pure visual aura (MA) or visual aura associated with paraesthesia and/or dysphasia (MA+). Data are expressed as means ± SD.
Electrophysiological parameters (ms) HV (n =30) MAtot (n =47) MA (n =27) MA+ (n =20)
N1 (N75) 76.5 ± 6.4 75.7 ± 5.2 75.4 ± 5.8 75.9 ± 4.6
P1 (P100) 103.5 ± 5.9 103.1 ± 6.7 102.9 ± 5.7 103.4 ± 8.0
In the rm-ANOVA model with N1–P1 peak-peak amplitude as dependent variable, multivariate test was significant for the “group”דblocks” interaction effect (Wilks’ Lambda = 0.711, F10,140= 2.608, p =0.006). After checking that the sphericity assumption was not violated (Mauchley Test: p =0.126), univariate rm-ANOVAs for N1-P1 peak-peak amplitude confirmed the significant interaction factor effect (F10,370= 3.025, p =0.001, partial η2
= 0.076, op = 0.982) observed (see above) at the multi-variate test. On post-hoc analysis there was a significant increase of N1-P1 VEP amplitude from the 2ndto the 6th
block in MA+ compared with MA, and from the 4thto
the 6th block in MA+ compared with HV (row data are shown in Fig. 2). In both MA and MA+, the comparison between the 6th and the 1st N1-P1 amplitude block did not reach the significance level (p >0.05).
In the rm-ANOVA model with P1–N2 peak-peak amplitude as dependent variable, multivariate test was not significant for the “group”דblocks” interaction effect (Wilks’Lambda = 0.834, F10,140= 1.335,p =0.218).
The linear regression N1–P1 slope of VEP amplitudes over all blocks differed significantly between the three groups (F2,74= 12.219, p <0.0001, partial η2= 0.248, op = 0.995; raw data are shown in Fig. 2). Post-hoc analysis showed that the slope of N1–P1 VEP amplitude changes over all 6 blocks was less steep in MA and
in MA+ patients than in HV (p =0.0001, p =0.001
respectively, raw data are shown in Fig. 3), but it was equally steep between MA subgroups (p =0.894).
The P1–N2 slope of the linear regression analysis was not different between groups (F2,74= 1.720, p =0.186, partialη2= 0.044, op = 0.351; Fig. 3).
Table 3N1–P1 VEP component amplitude (μV) and habituation slope in healthy volunteers (HV), the total group of migraine with aura patients (MAtot) and its subgroups with pure visual aura (MA) or visual aura associated with paraesthesia and/or dysphasia (MA+). Data are expressed as means ± SD
N1-P1 HV (n =30) MAtot (n =47) MA (n =27) MA+ (n =20)
1stamplitude block (μV) 6.97 ± 2.90 7.28 ± 3.23 6.53 ± 3.36 8.27 ± 2.83
2ndamplitude block (μV) 7.15 ± 3.02 7.39 ± 3.23 6.43 ± 3.29 8.69 ± 2.70
3rdamplitude block (μV) 6.87 ± 2.79 7.40 ± 2.96 6.49 ± 2.83 8.64 ± 2.74
4thamplitude block (μV) 6.55 ± 2.74 7.16 ± 3.17 6.12 ± 3.07 8.57 ± 2.81
5thamplitude block (μV) 6.25 ± 2.57 7.34 ± 3.00 6.49 ± 2.97 8.49 ± 2.70
6thamplitude block (μV) 5.97 ± 2.63 7.42 ± 3.02 6.65 ± 3.09 8.45 ± 2.64
Slope −0.50 ± 0.36 +0.006 ± 0.40 +0.01 ± 0.30 +0.0049 ± 0.18
In MA+, Pearson’s test disclosed that the N1–P1 habituation slope correlated negatively with attack fre-quency (r =−0.489, p =0.034) and positively with days elapsed since last attack (r = 0.578,p =0.019), correlations that were not found in MA patients (Fig. 4).
Discussion
The purpose of the present study was to extend our electrophysiological investigations of visual cortex re-activity in migraine by searching for differences between two distinct phenotypes of migraine with aura.
First, we confirm the previous finding that during continuous stimulation amplitude of the VEP N1–P1 component, but not of P1–N2, does not habituate over sequential blocks of averaged responses in migraine with aura patients between attacks while it does so in healthy volunteers [15]. An additional novel finding is that, rela-tive to HV, VEP N1–P1 habituation is deficient both in migraine with pure visual aura (MA) and in patients with complex aura (MA+).
A second striking result is that the amplitude of visual responses differs between patients having pure visual aura and those with complex auras. MA+ patients consistently have greater N1–P1 VEP amplitudes than MA patients. Contrary to MA+, MA patients do not differ from healthy volunteers in VEP N1–P1 and P1–N2 block amplitudes,
although they have reduced habituation over the 6 sequential blocks of 100 averaged VEP responses.
To the best of our knowledge, this is the first study of visual evoked responses in patients with different mi-graine aura phenotypes. It identifies within the mimi-graine spectrum a subgroup of patients with complex neuro-logical auras in whom excitability of the visual cortex appears genuinely increased, as evidenced by an increased VEP N1–P1 amplitude and decreased habituation. Previ-ous VEP studies have yielded conflicting results in groups of migraine with aura (MwA) patients without phenotype distinction. In some reports the grand-average of VEP N1–P1 and/or P1–N2 amplitudes was found greater in MwA patients than in controls [30–35] and/or in mi-graine without aura (MO) patients [31, 36, 37]. The ampli-tude of steady-state VEP harmonics was also larger in MwA than in MO or HV [38]. In other studies, on the contrary, VEP amplitudes were found reduced in MwA [39], even when compared to MO [40]. Most often, VEP amplitudes in MwA were reported to be in the normal range [13–15, 41–44]. Our finding of low or normal visual cortex excitability in patients with pure visual auras, which is similar to migraine without aura patients [45] but contrasts with increased VEP amplitude and deficient habituation in patients with complex auras, may help to explain some of the abovementioned
Fig. 3Raw habituation slope of VEP N1-P1 and P1–N2 peak-to-peak amplitudes (mean ± SEM) over 6 sequential blocks of 100 averaged responses in healthy volunteers (HV,n =30), patients with pure visual aura (MA,n =27), patients with complex aura (MA+,n =20) and the 2 latter groups combined (MAtot,n =47)
Table 4P1-N2 VEP component amplitude (μV) and habituation slope in healthy volunteers (HV), the total group of migraine with aura patients (MAtot) and its subgroups with pure visual aura (MA) or visual aura associated with paraesthesia and/or dysphasia (MA+). Data are expressed as means ± SD
P1-N2 HV (n =30) MAtot (n =47) MA (n =27) MA+ (n =20)
1stamplitude block (μV) 6.59 ± 3.16 7.00 ± 3.07 6.12 ± 2.65 8.18 ± 3.26
2ndamplitude block (μV) 6.49 ± 3.03 6.87 ± 3.26 5.88 ± 2.55 8.20 ± 3.70
3rdamplitude block (μV) 6.49 ± 2.94 6.62 ± 3.10 5.67 ± 2.66 7.91 ± 3.25
4thamplitude block (μV) 5.99 ± 2.85 6.32 ± 2.88 5.37 ± 2.36 7.60 ± 3.08
5thamplitude block (μV) 6.26 ± 2.59 6.84 ± 2.93 6.01 ± 2.45 7.96 ± 3.19
6thamplitude block (μV) 5.61 ± 2.86 6.50 ± 2.78 5.78 ± 2.70 7.47 ± 2.64
discrepant results. In fact, pooling patients with different migraine phenotypes (MO and MwA or different MA subgroups) in different proportions increases the variance of VEP results between studies. This probably fueled in part the controversy about the presence or not of interic-tal cortical hyperexcitability in migraine. In a previous re-view paper, we reasoned that in its strict physiological definition of a stimulus–response curve, the cortex would be hyperexcitable if it generates a response to a subliminal stimulus and/or if its response to a supraliminal stimulus is increased in amplitude. Because in most previous stud-ies VEP amplitude in MO patients and, according to the present results, also in MA patients, increases during stimulus repetition, while remaining within a normal range (see Fig. 2), we proposed to abandon
the general term “hyperexcitability” in favour of
“hyperresponsivity” to characterise the response pat-tern of the migrainous brain to repeated stimulations [46]. As shown here, the functional abnormality is clearly different in MA+ patients in whom the initial VEP amplitude to a low number of stimuli is increased compared to both HV and MA, indicating that their visual cortex is genuinely hyperexcitable.
From a pathophysiological point of view, it is interest-ing to compare MA+ and chronic migraine that is also thought to be associated with true cortical hyperexcit-ability. The evidence in chronic migraine comes from studies of somatosensory evoked potentials [47] and magnetoencephalographic visual evoked responses [48]. The difference with MA+ is that in the latter VEP ampli-tude was increased in virtually all blocks of averagings and habituation was deficient over 6 blocks, while in chronic migraine only the 1st block of averaged visual or somatosensory responses was increased in amplitude, but not the subsequent blocks, leaving habituation nor-mal. The electrophysiological pattern in migraine with complex neurological auras may therefore suggest that the visual cortex is locked in a state of persistent hyperexcitability.
The pathophysiological determinants of different aura phenotypes and related differences in interictal visual
evoked potential profiles remain speculative. Cortical spreading depression (CSD) is thought to be the patho-physiological substrate of the migraine aura. CSD is an electrochemical wave that usually starts in the posterior regions of the brain and spreads anteriorly at approx. 3 mm/min, accompanied by biphasic cerebral blood flow changes [4]. In several brain imaging studies performed during attacks, though not in all, [49, 50] the vascular and metabolic changes accompanying the migraine aura spread more anteriorly in patients with complex neuro-logical symptoms and hemiplegia than in those with only visual disturbances. The recovery from CSD depends largely on intact neurovascular coupling to match the in-creased energy demand and to restore ion gradients via the Na+/K+ ATPase pump [51]. The distance, to which CSD spreads during MwA attacks, and thus the clinical phenotype of the aura, depends on the balance between factors that predispose the brain to CSD and others that inhibit CSD and allow the parenchyma to recover.
The neurovascular tone is modulated by local factors such as oxygen availability or lactate concentrations, and by subcortical monoaminergic projections [52, 53]. During continuous visual stimulation neurovascular coupling is impaired in migraine patients between attacks, especially in migraine with aura [34, 54, 55]. There is also cir-cumstantial evidence from biochemical and functional neuroimaging studies that monoaminergic, in particular serotonergic, transmission from the brainstem to the thalamus and cortex is altered in migraine [56]. Finally,
convergent data from various laboratories have
shown that the mitochondrial energy reserve and ATP levels are significantly reduced in the brain of migraineurs between attacks [27, 28]. Based on these biochemical and functional data, we have proposed that migraine is characterized interictally by a cycling dysregulation of the serotoninergic control of thalamo-cortical activity that causes varying degrees of thalamo-cortical hyperresponsivity and thus increased energy demands, which, under the influence of triggering or aggravat-ing factors, may disrupt homeostasis and lead to an attack [14, 57].
Several studies suggest that the abnormalities of energy metabolism could be more pronounced in migraine with complex neurological aura. The phosphocreatine/ phosphate (PCr/Pi) ratio, a marker of the brain’s energy reserve, differed significantly between patients with dif-ferent aura phenotypes and was lowest in those with more complex auras [58]. In a 1H-MR-spectroscopy study [20] MA+ patients had a significant increase of lactate in the visual cortex during sustained visual stimulation, while this was not the case in HV and MA patients. Variants in the mitochondrial DNA, such as those that distinguish responders from non-responders to preventive anti-migraine treatment with riboflavin [59], could play a role in the metabolic differences between aura phenotypes.
That genetic load can influence CSD patterns and se-verity is evidenced by the studies of the“knock-in”mice wearing CACNA1A [60] or ATP1A2 [61] mutations found respectively in familial hemiplegic migraine (FHM) type 1 and 2. In FHM1 mice having the S218L mutation that causes a more severe clinical phenotype in patients, CSD are more frequent and more spread out (up to the stri-atum) than in mice with the R192Q mutation. As men-tioned, the common form of migraine with aura is not associated with the mutations found in FHM, but merely with common variants in a number of loci identified on genome-wide association studies (GWAS) that are seem-ingly not much different from those found in migraine without aura [62]. It remains to be determined whether the combination of such common genetic variants and their association with mitochondrial DNA variants may influence the clinical migraine phenotype, including that of the aura.
One can only speculate on the possible relation between the ictal phenomena, i.e. CSD and its spreading, and the VEP abnormalities found interictally. We know of only one study in photosensitive subjects with a photo-paroxysmal response to intermittent photic stimulation where increased VEP amplitude was correlated with spread of the paroxysmal EEG activity to more anterior brain areas [63]. In photo-paroxysmal responses and photically induced seizures, this could be the electro-physiological correlate of increased functional connectivity between occipital and parieto-temporo-frontal networks under the control of the thalamus [64–66]. A recent study showing in animals that CSD can activate the thalamic re-ticular nuclei that controls the flow of sensory information to the cortex, is therefore of major interest [67]. Trans-lated to migraine pathophysiology, one may hypothesize that repeated thalamic activation by CSD could worsen the interictal impairment of thalamic/thalamocortical ac-tivity in migraine with complex auras [14, 68–71]. Studies correlating aura frequency and duration of the disorder with thalamic/thalamocortical activity in MwA are neces-sary to test this hypothesis.
Whatever the possible relation between ictal CSD and interictal VEP might be, the pathophysiological mecha-nisms underlying VEP habituation are not permanently influenced by the ictal phenomena, even in MA+ pa-tients. In the latter, indeed, like in MwA patients overall and in migraine without aura [15], the VEP habituation deficit is obvious between attacks. Moreover, in MA+, but not in MA patients, it worsens progressively with time elapsed since the last migraine attack and decreases with increased attack frequency; in other words, VEP habituation increases with proximity to an attack. To explain this difference between MA+ and MA, we speculate that MA+ patients are carrying the most pronounced genetic load predisposing them to more prominent pathophysiological dysfunctions. For instance, we intend to explore the possibility that MA+ is the mi-graine with aura phenotype with the most pronounced deficit of short-range lateral inhibition within the visual cortex, an abnormality that we also found directly related to the distance from the last attack in a previous study of a mixed group of migraine with and without aura patients [15]. Taken together with our present results, this would indicate that the inhibitory performance and habituation with stimulus repetition decreases with the distance from the last migraine attack. A psychophysical study using vis-ual metacontrast masking test, found a similar correlation between inhibitory processes and the number of days elapsed since the last attack [72]. The biochemical correl-ate of impaired inhibitory mechanisms could be lactcorrel-ate- lactate-induced downregulation of GABA activity in the visual cortex. As mentioned, in MA+ lactate levels increase in the occipital cortex during visual stimulation [20] there is emerging evidence that lactate, besides its role as energy substrate, has a concentration-dependent downregulating effect on GABAergic neurotransmission [22].
subjects [12]; 4) although the investigators were blinded to diagnosis during the first examination, they were not during the 3 subsequent recording sessions [75].
Though we refer herein to habituation as the common feature of responses to any type of repeated sensory stimuli and to its classical definition of“a behavioral re-sponse decrement that results from repeated stimulation and that does not involve sensory adaptation/sensory fatigue or motor fatigue” [78, 79], we cannot totally ex-clude that changes in the level of attention and contrast pattern adaptation may have influenced our results. This is nonetheless unlikely for the following reasons. In pre-vious studies VEP amplitudes after full field stimulation were not significantly influenced by attention and reac-tion time task condireac-tions [80, 81]. Moreover, the effects of contrast adaptation on the P1 peak are small (peak time shift approx. 3 ms, amplitude unchanged) and re-quire to take place stimulations lasting about 25 min [82, 83], contrasting with a 3 min 20 sec duration of a VEP re-cording session in our study.
We also are aware that our samples are relatively small and that clinical correlations are retrospective. Further studies are needed to repeat the analysis in a larger clinical sample with various migraine phenotypes and with a longitudinal, prospective follow-up of patients, allowing to record them during attacks as well as at different time points between attacks.
Conclusions
To summarize, this study shows that the clinical hetero-geneity of migraine with aura is reflected in distinct visual evoked potential profiles. Patients with complex neuro-logical auras differ from those with strictly visual auras by an interictal increase of VEP amplitudes suggestive of an underlying genuine persistent visual cortical hyperexcit-ability. Whether this is related to CSD features, their effect on cortex and thalamus or to a common neurobiological or genetic denominator between CSD and VEP profile determinants remains to be determined.
Abbreviations
CSD:cortical spreading depression; GWAS: genome-wide association studies; HV: Healthy Volunteer; MA: migraine with pure visual Aura; MA+: migraine with complex aura; MAtot: total group of migraine with aura patients; MO: migraine without aura; MwA: migraine with aura; VEP: visual evoked potential.
Competing interests
The authors declare that they have no competing interests.
Authors’contributions
GC made substantial contributions to interpretation of data as well as in drafting the manuscript. MS, VP, JS and FP were implied in the interpretation of data as well as in drafting the manuscript; ADR, FM, and AF gave critical revision of the manuscript for important intellectual content. CDL, DDL and MB were implied in recording and analyzing data. All authors read and approved the final manuscript.
Acknowledgment
Italian Ministry of Health and Fondazione Roma financially supported the research for this paper.
Author details
1
G.B. Bietti Foundation-IRCCS, Department of Neurophysiology of Vision and Neurophthalmology, Via Livenza 3, 00198 Rome, Italy.2Department of Medical and Surgical Sciences and Biotechnologies,“Sapienza”University of Rome Polo Pontino, Latina, Italy.3Fondazione Don Gnocchi, Milan, Italy. 4
Istituto Superiore di Sanità, Dipartimento Tecnologie e Salute, Rome, Italy. 5Headache Research Unit, Department of Neurology-CHR Citadelle, University of Liège, Liège, Belgium.6IRCCS-Neuromed, Pozzilli, IS, Italy.
Received: 18 May 2015 Accepted: 15 September 2015
References
1. Russell M, Olesen J (1996) A nosographic analysis of the migraine aura in a general population. Brain 119:355–361
2. Eriksen M, Thomsen L, Andersen I, Nazim F, Olesen J (2004) Clinical characteristics of 362 patients with familial migraine with aura. Cephalalgia 24:564–575
3. Rasmussen B, Olesen J (1992) Migraine with aura and migraine without aura: an epidemiological study. Cephalalgia 12:221–228
4. Lauritzen M (2001) Cortical spreading depression in migraine. Cephalalgia 21:757–760
5. Charles A, Baca S (2013) Cortical spreading depression and migraine. Nat Rev Neurol 9:637–644
6. Olesen J, Friberg L, Olsen T, Iversen H, Lassen N, Andersen A, et al (1990) Timing and topography of cerebral blood flow, aura, and headache during migraine attacks. Ann Neurol 28:791–798
7. Cao Y, Welch K, Aurora S, Vikingstad E (1999) Functional MRI-BOLD of visually triggered headache in patients with migraine. Arch Neurol 56:548–554 8. Hadjikhani N, Sanchez D, Wu O, Schwartz D, Bakker D, Fischl B, et al (2001)
Mechanisms of migraine aura revealed by functional MRI in human visual cortex. Proc Natl Acad Sci U S A 98:4687–4692
9. Bowyer SM, Aurora KS, Moran JE, Tepley N, Welch KM (2001) Magnetoencephalographic fields from patients with spontaneous and induced migraine aura. Ann Neurol 50:582–587
10. Zhang X, Levy D, Noseda R, Kainz V, Jakubowski M, Burstein R, et al (2010) Activation of meningeal nociceptors by cortical spreading depression: implications for migraine with aura. J Neurosci 30:8807–8814
11. Zhang X, Levy D, Kainz V, Noseda R, Jakubowski M, Burstein R, et al (2011) Activation of central trigeminovascular neurons by cortical spreading depression. Ann Neurol 69:855–865
12. Omland P, Nilsen K, Uglem M, Gravdahl G, Linde M, Hagen K, et al (2013) Visual Evoked Potentials in Interictal Migraine: No Confirmation of Abnormal Habituation. Headache 53:1071–1086
13. Afra J, Cecchini AP, De Pasqua V, Albert A, Schoenen J (1998) Visual evoked potentials during long periods of pattern-reversal stimulation in migraine. Brain 121(Pt 2):233–241
14. Coppola G, Ambrosini A, Di Clemente L, Magis D, Fumal A, Gérard P, et al (2007) Interictal abnormalities of gamma band activity in visual evoked responses in migraine: an indication of thalamocortical dysrhythmia? Cephalalgia 27:1360–1367
15. Coppola G, Parisi V, Di Lorenzo C, Serrao M, Magis D, Schoenen J, et al (2013) Lateral inhibition in visual cortex of migraine patients between attacks. J Headache Pain 14:20
16. Coppola G, Di Lorenzo C, Schoenen J, Pierelli F (2013) Habituation and sensitization in primary headaches. J Headache Pain 14:65
17. Eriksen M, Thomsen L, Olesen J (2006) Implications of clinical subtypes of migraine with aura. Headache 46:286–297
18. Ambrosini A, de Noordhout A, Alagona G, Dalpozzo F, Schoenen J (1999) Impairment of neuromuscular transmission in a subgroup of migraine patients. Neurosci Lett 276:201–203
19. Ambrosini A, de Noordhout A, Schoenen J (2001) Neuromuscular transmission in migraine patients with prolonged aura. Acta Neurol Belg 101:166–170 20. Sándor P, Dydak U, Schoenen J, Kollias S, Hess K, Boesiger P, et al (2005)
21. Sickmann H, Walls A, Schousboe A, Bouman S, Waagepetersen H (2009) Functional significance of brain glycogen in sustaining glutamatergic neurotransmission. J Neurochem 1:80–86
22. Bozzo L, Puyal J, Chatton J (2013) Lactate modulates the activity of primary cortical neurons through a receptor-mediated pathway. PLoS One 8:10 23. Matsui T, Soya S, Kawanaka K, Soya H (2015) Brain Glycogen Decreases
During Intense Exercise Without Hypoglycemia: The Possible Involvement of Serotonin. Neurochem Res 40:1333–1340
24. Gilbert E, Tang J, Ludvig N, Bergold P (2006) Elevated lactate suppresses neuronal firing in vivo and inhibits glucose metabolism in hippocampal slice cultures. Brain Res 1117:213–223
25. Shimizu H, Watanabe E, Hiyama T, Nagakura A, Fujikawa A, Okado H et al (2007) Glial Nax channels control lactate signaling to neurons for brain [Na+] sensing. Neuron 54:59–72
26. Sappey-Marinier D, Calabrese G, Fein G, Hugg J, Biggins C, Weiner M, et al (1992) Effect of photic stimulation on human visual cortex lactate and phosphates using 1H and 31P magnetic resonance spectroscopy. J Cereb Blood Flow Metab 12:584–592
27. Barbiroli B, Montagna P, Cortelli P, Funicello R, Iotti S, Monari L, et al (1992) Abnormal brain and muscle energy metabolism shown by 31P magnetic resonance spectroscopy in patients affected by migraine with aura. Neurology 42:1209–1214
28. Watanabe H, Kuwabara T, Ohkubo M, Tsuji S, Yuasa T (1996) Elevation of cerebral lactate detected by localized 1H-magnetic resonance spectroscopy in migraine during the interictal period. Neurology 47:1093–1095 29. Judit A, Sándor PS, Schoenen J (2000) Habituation of visual and intensity
dependence of auditory evoked cortical potentials tends to normalize just before and during the migraine attack. Cephalalgia 20:714–719
30. Coutin-Churchman P, Padrón de Freytez A (2003) Vector analysis of visual evoked potentials in migraineurs with visual aura. Clin Neurophysiol 114:2132–2137 31. Shibata K, Osawa M, Iwata M (1997) Pattern reversal visual evoked potentials
in classic and common migraine. J Neurol Sci 145:177–181
32. Shibata K, Osawa M, Iwata M (1998) Pattern reversal visual evoked potentials in migraine with aura and migraine aura without headache. Cephalalgia 18:319–323
33. Oelkers R, Grosser K, Lang E, Geisslinger G, Kobal G, Brune K, et al (1999) Visual evoked potentials in migraine patients: alterations depend on pattern spatial frequency. Brain 122(Pt 6):1147–1155
34. Zaletel M, Strucl M, BajrovićF, Pogacnik T (2005) Coupling between visual evoked cerebral blood flow velocity responses and visual evoked potentials in migraneurs. Cephalalgia 25:567–574
35. Shibata K, Yamane K, Iwata M, Ohkawa S (2005) Evaluating the effects of spatial frequency on migraines by using pattern-reversal visual evoked potentials. Clin Neurophysiol 116:2220–2227
36. Sand T, Zhitniy N, White LR, Stovner LJ (2008) Visual evoked potential latency, amplitude and habituation in migraine: a longitudinal study. Clin Neurophysiol 119:1020–1027
37. Sand T, White L, Hagen K, Stovner L (2009) Visual evoked potential and spatial frequency in migraine: a longitudinal study. Acta Neurol Scand Suppl 189:33–37 38. Shibata K, Yamane K, Otuka K, Iwata M (2008) Abnormal visual processing in
migraine with aura: a study of steady-state visual evoked potentials. J Neurol Sci 271:119–126
39. Nguyen B, McKendrick A, Vingrys A (2012) Simultaneous retinal and cortical visually evoked electrophysiological responses in between migraine attacks. Cephalalgia 32:896–907
40. Khalil NM, Legg NJ, Anderson DJ (2000) Long term decline of P100 amplitude in migraine with aura. J Neurol Neurosurg Psychiatry 69:507–511 41. Schoenen J, Wang W, Albert A, Delwaide P (1995) Potentiation instead of
habituation characterizes visual evoked potentials in migraine patients between attacks. Eur J Neurol 2:115–122
42. Afra J, Ambrosini A, Genicot R, Albert A, Schoenen J (2000) Influence of colors on habituation of visual evoked potentials in patients with migraine with aura and in healthy volunteers. Headache 40:36–40
43. Afra J, Proietti Cecchini A, Sándor PS, Schoenen J (2000) Comparison of visual and auditory evoked cortical potentials in migraine patients between attacks. Clin Neurophysiol 111:1124–1129
44. Ozkul Y, Bozlar S (2002) Effects of fluoxetine on habituation of pattern reversal visually evoked potentials in migraine prophylaxis. Headache 42:582–587 45. Coppola G, Currà A, Sava SL, Alibardi A, Parisi V, Pierelli F et al (2010)
Changes in visual-evoked potential habituation induced by hyperventilation in migraine. J Headache Pain 11:497–503
46. Coppola G, Pierelli F, Schoenen J (2007) Is the cerebral cortex
hyperexcitable or hyperresponsive in migraine? Cephalalgia 27:1427–1439 47. Coppola G, Iacovelli E, Bracaglia M, Serrao M, Di Lorenzo C, Pierelli F et al (2013) Electrophysiological correlates of episodic migraine chronification: evidence for thalamic involvement. J Headache Pain 14:76
48. Chen W, Wang S, Fuh J, Lin C, Ko Y, Lin Y et al (2011) Persistent ictal-like visual cortical excitability in chronic migraine. Pain 152:254–258 49. Floery D, Vosko M, Fellner F, Fellner C, Ginthoer C, Gruber F, et al (2012)
Acute-onset migrainous aura mimicking acute stroke: MR perfusion imaging features. AJNR Am J Neuroradiol 33:1546–1552
50. Iizuka T, Tominaga N, Kaneko J, Sato M, Akutsu T, Hamada J et al (2015) Biphasic neurovascular changes in prolonged migraine aura in familial hemiplegic migraine type 2. J Neurol Neurosurg Psychiatry 86:344–353 51. Piilgaard H, Lauritzen M (2009) Persistent increase in oxygen consumption
and impaired neurovascular coupling after spreading depression in rat neocortex. J Cereb Blood Flow Metab 29:1517–1527
52. Hamel E (1985) (1985) Perivascular nerves and the regulation of cerebrovascular tone. J Appl Physiol 100:1059–1064
53. Gordon G, Choi H, Rungta R, Ellis-Davies G, MacVicar B (2008) Brain metabolism dictates the polarity of astrocyte control over arterioles. Nature 456:745–749
54. Descamps B, Vandemaele P, Reyngoudt H, Deblaere K, Leybaert L, Paemeleire K, et al (2011) Absence of haemodynamic refractory effects in patients with migraine without aura: an interictal fMRI study. Cephalalgia 31:1220–1231 55. Griebe M, Flux F, Wolf M, Hennerici M, Szabo K (2014) Multimodal
assessment of optokinetic visual stimulation response in migraine with aura. Headache 54:131–141
56. Hamel E (2007) Serotonin and migraine: biology and clinical implications. Cephalalgia 27:1293–1300
57. Schoenen J (1996) Deficient habituation of evoked cortical potentials in migraine: a link between brain biology, behavior and trigeminovascular activation? Biomed Pharmacother 50:71–78
58. Schulz U, Blamire A, Corkill R, Davies P, Styles P, Rothwell P, et al (2007) Association between cortical metabolite levels and clinical manifestations of migrainous aura: an MR-spectroscopy study. Brain 130:3102–3110 59. Di Lorenzo C, Pierelli F, Coppola G, Grieco GS, Rengo C, Ciccolella M, et al
(2009) Mitochondrial DNA haplogroups influence the therapeutic response to riboflavin in migraineurs. Neurology 72:1588–1594
60. Eikermann-Haerter K, Dileköz E, Kudo C, Savitz SI, Waeber C, Baum MJ, et al (2009) Genetic and hormonal factors modulate spreading depression and transient hemiparesis in mouse models of familial hemiplegic migraine type 1. J Clin Invest 119:99–109
61. Leo L, Gherardini L, Barone V, De F, Pietrobon D, Pizzorusso T, et al (2011) Increased susceptibility to cortical spreading depression in the mouse model of familial hemiplegic migraine type 2. PLoS Genet 7:10
62. Nyholt D, Anttila V, Winsvold B, Kurth T, Stefansson H, Kallela M, et al (2015) Concordance of genetic risk across migraine subgroups: Impact on current and future genetic association studies. Cephalalgia 35:489–499
63. Siniatchkin M, Moeller F, Shepherd A, Siebner H, Stephani U (2007) Altered cortical visual processing in individuals with a spreading photoparoxysmal EEG response. Eur J Neurosci 26:529–536
64. Moeller F, Siebner H, Wolff S, Muhle H, Granert O, Jansen O et al (2009) Mapping brain activity on the verge of a photically induced generalized tonic-clonic seizure. Epilepsia 50:1632–1637
65. Moeller F, Muthuraman M, Stephani U, Deuschl G, Raethjen J, Siniatchkin M (2013) Representation and propagation of epileptic activity in absences and generalized photoparoxysmal responses. Hum Brain Mapp 34:1896–1909 66. Hanganu A, Groppa S, Deuschl G, Siebner H, Moeller F, Siniatchkin M et al
(2015) Cortical Thickness Changes Associated with Photoparoxysmal Response. Brain Topogr 28:702–709
67. Tepe N, Filiz A, Dilekoz E, Akcali D, Sara Y, Charles A, et al (2015) The thalamic reticular nucleus is activated by cortical spreading depression in freely moving rats: prevention by acute valproate administration. Eur J Neurosci 41:120–128
68. Coppola G, Vandenheede M, Di Clemente L, Ambrosini A, Fumal A, De Pasqua V et al (2005) Somatosensory evoked high-frequency oscillations reflecting thalamo-cortical activity are decreased in migraine patients between attacks. Brain 128:98–103
70. Rocca MA, Pagani E, Colombo B, Tortorella P, Falini A, Comi G, et al (2008) Selective diffusion changes of the visual pathways in patients with migraine: a 3-T tractography study. Cephalalgia 28:1061–1068
71. Datta R, Aguirre G, Hu S, Detre G, Cucchiara B (2013) Interictal cortical hyperresponsiveness in migraine is directly related to the presence of aura. Cephalalgia 33:365–374
72. Shepherd A, Wyatt G, Tibber M (2011) Visual metacontrast masking in migraine. Cephalalgia 31:346–356
73. BednářM, Kubová Z, Kremláček J (2014) Lack of visual evoked potentials amplitude decrement during prolonged reversal and motion stimulation in migraineurs. Clin Neurophysiol 125:1223–1230
74. Omland P, Uglem M, Engstrøm M, Linde M, Hagen K, Sand T, et al. (2014) Modulation of visual evoked potentials by high-frequency repetitive transcranial magnetic stimulation in migraineurs. Clin Neurophysiol. doi:10.1016/j.clinph.2014.12.035
75. Omland P, Uglem M, Hagen K, Linde M, Tronvik E, Sand T (2015) Visual evoked potentials in migraine: Is the“neurophysiological hallmark”concept still valid? Clin Neurophysiol. doi:10.1016/j.clinph.2014.12.035.
76. Brighina F, Cosentino G, Fierro B (2015) Habituation or lack of habituation: What is really lacking in migraine? Clin Neurophysiol. doi:10.1016/j.clinph.2015.05.028.
77. Harter MR, White CT (1968) Effects of contour sharpness and check-size on visually evoked cortical potentials. Vision Res 8:701–711
78. Thompson RF, Spencer WA (1966) Habituation: a model phenomenon for the study of neuronal substrates of behavior. Psychol Rev 73:16–43 79. Rankin CH, Abrams T, Barry RJ, Bhatnagar S, Clayton DF, Colombo J, et al
(2009) Habituation revisited: an updated and revised description of the behavioral characteristics of habituation. Neurobiol Learn Mem 92:135–138 80. Skuse N, Burke D (1992) Sequence-dependent deterioration in the visual
evoked potential in the absence of drowsiness. Electroencephalogr Clin Neurophysiol 84:20–25
81. Hoshiyama M, Kakigi R (2001) Effects of attention on pattern-reversal visual evoked potentials: foveal field stimulation versus peripheral field stimulation. Brain Topogr 13:293–298
82. Heinrich T, Bach M (2002) Contrast adaptation in retinal and cortical evoked potentials: no adaptation to low spatial frequencies. Vis Neurosci 19:645–650 83. Heinrich S, Bach M (2001) Adaptation dynamics in pattern-reversal visual
evoked potentials. Doc Ophthalmol 102:141–156
Submit your manuscript to a
journal and benefi t from:
7 Convenient online submission
7 Rigorous peer review
7 Immediate publication on acceptance
7 Open access: articles freely available online
7 High visibility within the fi eld
7 Retaining the copyright to your article