Reprinted from the Soil Science Society of America Journal Volume 58, no. 5, September-October 1994 677 South Segoe Rd., Madison, WI 53711 USA
Root-Zone Mineral Nitrogen Changes
as
Affected by Crop Sequence and Tillage
B. D. Meek,* D. L. Carter, D. T. Westermann, and R. E. Peckenpaugh
ABSTRACT
Crop sequence and tillage affect soil mineral N (NH 4 plus NO3) and NO3 leaching below the root zone following alfalfa (Medicago .saliva L.). A 2-yr field experiment was conducted in south-central Idaho to determine the effect on soil NO3 levels of a corn (Zea mays L.)-wheat (Triticum aestivum L.) rotation compared with a bean (Phaseolus vulgaris L.)-bean rotation and to demonstrate improved N utilization with a corn-wheat rotation. Alfalfa, growing on an irrigated Portneuf silt loam (coarse-silty, mixed, mesic Durixerollic Calciorthid), was killed in October 1989 with herbicide. Treatments were: (i) BT-BT: conventional tilled bean grown in 1990 and 1991; (ii) CNT-WNT: no-till silage corn grown in 1990, and no-till winter wheat grown in 1990-1991; and (iii) CT-WT: same as CNT-WNT but under conven-tional tillage. Similar amounts of soil N were mineralized the first (275 kg N ha - ') and second (213 kg N ha - ) year after killing the alfalfa in all treatments. The BT-BT treatment had the highest grow-ing-season soil mineral N (up to 251 kg ha-', 0-0.45-m depth) because the N uptake by bean was lower (187 kg N ha ) than corn (252 kg N ha - average of CT-WT and CNT-WNT treatments) in 1990 and later than winter wheat uptake in 1991. Most wheat N uptake had occurred by late June when bean uptake was just starting. A rotation that follows alfalfa with corn or a crop with a similar N uptake pattern, instead of bean, will save N fertilizer, lower soil NO 3 levels, and reduce NO3 leaching potential.
USDA-ARS, Soil and Water Management Research Unit, 3793 N 3600 E, Kimberly, ID 83341. Received 1 Sept. 1993. *Corresponding author. Published in Soil Sci. Soc. Am. J. 58:1464-1469 (1994).
C
ROP SEQUENCE AND TILLAGE should be employed
so that N mineralization is synchronized with subse-quent crop N uptake. Improving N utilization reduces potential NO3 leaching into the groundwater from ag-ricultural fields. The amount of NO 3 leaching out of the root zone is a function of the NO3 concentration in the root zone and the water flux through this zone.
Large amounts of N are mineralized after alfalfa is killed, especially the first year. Fox and Piekielek (1988) reported that 70, 20, and 10 % of the contribution from alfalfa was available the first, second, and third years, respectively. Varco et al. (1991) measured 31.5 mg kg -1 extractable NO3-N in the upper 0.20 m of soil 28 d after alfalfa was killed. Calculations by Peterson and Russelle (1991) for the Corn Belt demonstrated that the N fertilizer applied to corn could be reduced by 8% if growers would properly credit the extra N mineralized following alfalfa. In south-central Idaho, 2 yr of bean are commonly grown following alfalfa, which means a legume following an-other legume that does not need fertilizer N. Robbins and Carter (1980) determined that 85 to 95 kg NO 3-N ha- 1 yr I moved below the root zone when bean followed
Abbreviations: BT-BT, conventional-tilled bean grown in 1990 and 1991;
MEEK ET Al. CROPPING EFFECTS ON ROOT-ZONE NITROGEN 1465
Table 1. Crop sequence for 1986 to 1991 for three treatments: BT-BT, conventional-tilled bean; CNT-WNT, no-tillage silage corn and winter wheat; CT-WT, conventional-tilled silage corn and winter wheat.
Time BT-BT CNT-WNT CT-WT
1986-1989 Alfalfa Alfalfa Alfalfa 19901 Bean Silage corn Silage corn 1991 Bean Winter wheat Winter wheat -I The 2 yr following the removal of alfalfa, 1990 and 1991, were studied in this experiment. The CT-WT plots were plowed in April 1990 and October 1990, and the BT-BT plots were plowed in April 1990 and June 1991. 90 kg N ha -' would be the N requirement for winter wheat in this sequence based on past experience at this location.
alfalfa, but only 60 kg NO3-N ha- 1 yr were lost when corn followed alfalfa.
The crop following alfalfa should have a large N uptake and an uptake curve that matches as closely as possible the N mineralized. Corn can be grown following alfalfa with adequate N (no fertilizer N applied) through-out the growing season, because N uptake by corn tends to parallel the rate at which NO3 is released or mineralized after the alfalfa is killed (Carter et al., 1991). When winter wheat follows alfalfa, the alfalfa should be killed in early fall to allow sufficient time for adequate N mineralization to satisfy the N requirement of the winter wheat during early spring growth.
Tillage may increase the N mineralization rate. Nitro-gen may be mineralized during a longer time period using no-till, which would allow more time for N uptake. Doran (1980) concluded that mineralization rates were higher in conventional-tilled soils, and the potential for denitrification was higher in no-till soils. Eck and Jones (1992) found a greater accumulation of soil NO3-N to 1.2 m under stubble mulch compared with no-till under some cropping systems, but not under others. They found that NO3 moved deeper in the profile under no-till than under stubble mulching, indicating that differences may have been caused by differential leaching rather than differential mineralization.
The objectives of this study were to: (i) evaluate the soil mineral-N status of the root zone following alfalfa and (ii) demonstrate improved N utilization with a recom-mended cropping system.
MATERIALS AND METHODS Experimental Site
The experiment was conducted in south-central Idaho on a Portneuf silt loam. The study area's yearly precipitation aver-ages 210 mm. The field has a slope of 0.6%. Alfalfa was grown the previous 4 yr and was killed with glyphosate [N-(phosphonomethyl) glycine] on 26 Oct. 1989. The field was divided into 18 plots, each 243 m long and either 8.8 m (bean) or 6.1 m wide (corn or wheat). Treatments are listed in Table 1 with the corn and wheat being grown under both corn no-till-wheat no-till (CNT-WNT) and corn tilled-no-till-wheat tilled (CT-WT) treatments.
Fertilization
Fertilizer was applied to the complete plot area on 18 and 19 Apr. 1990 (P, all plots; Zn, bean plots) and 15 Oct. 1990 (urea, wheat plots). Triple super phosphate was applied at 56
kg P ha- '. Zinc (11 kg ha- ') was applied as Zn SO4 to the bean plots only. Urea (82 kg N ha-') was applied to only the wheat plots before the wheat was planted but after the CT-WT plots were plowed and roller harrowed. Also, urea was also applied on 19 Apr. 1990 and 9 Apr. 1991 to 9.1-m strips, across the width of the field including all 18 plots, to evaluate whether cropping systems had adequate N for economic opti-mum yield. This urea was applied to the strips each time at rates of 0, 82, and 164 kg N ha-'.
Operations
The seedbed for bean was prepared by plowing, roller harrowing, applying herbicides, roller harrowing, and furrow-ing out between every other row. 'Viva Pink' bean (not inocu-lated) was planted without preirrigation in (16 rows plot - ')
0.55-m-wide rows on 6 June 1990 and 3 June 1991. Bean plots were cultivated on 5 July 1990 and 7 July 1991.
Silage corn (3389 Pioneer') was planted (8 rows plot-') in 0.76-m-wide rows on 15 May 1990. The CT-WT plots were prepared by plowing and roller harrowing. Furrows were either made (CT-WT) or cleaned out (CNT-WNT) between every row at the time of planting. The CNT-WNT received no tillage but was planted into killed alfalfa stubble with only slight disturbance during planting and cleaning out of the furrows used to irrigate the alfalfa. Conventional-tilled plots were cultivated on 6 July. All corn plots were sprayed with 2,4-D [(2, 4-dichlorophenoxy) acetic acid] on 2 July to control weeds. `Stephens' wheat was planted in the CNT-WNT and CT-WT treatments on 15 Oct. 1990. Tilled plots were plowed and roller harrowed before planting and roller harrowed again (to incorporate the fertilizer) after planting and fertilization. Irrigation furrows 0.76 m wide were either cleaned out (CNT-WNT) or constructed (CT-WT).
Irrigation
The water application rate was measured using a bucket and stopwatch in one of the furrows in the middle of each plot. Runoff water, for the full length of the field, for the same furrow was measured using automated flumes. Corn was irrigated with water applied to alternate furrows with a change to previously nonirrigated furrows in the middle of the season. Water was applied to each furrow for bean but furrows were constructed only between alternate rows. Water was applied to every furrow during irrigation of wheat. Distances between irrigated furrows were 1.52 m for corn, 1.1 m for bean, and 0.76 m for wheat. Leaching fractions were calculated for April to October 1990 and March to October 1991 (BT-BT) or April to October 1991 (CT-WT and CNT-WNT) using water infiltrated, evapotranspiration, and change in water content (Meek et al., 1994). Leaching fractions (calculated from the water balance) were 0.48 and 0.38 (CT-WT), 0.43 and 0.37 (CNT-WNT), and 0.41 and 0.37 (BT-BT) for 1990 and 1991, respectively.
Soil Nitrogen Levels
Soil mineral-N status (NH4-N and NO3-N) and N-mineral-ization measurements were made near the center of the length of the plot. Measurements were not made in the N strips. Nitrogen mineralization (0-0.45 m depth) was measured by taking soil samples during periods between crops (six cores per plot). Soil mineral N (NH,-N plus NO3-N) was measured during the cropping season by taking soil samples 0 to 0.45
1466 SOIL SCI. SOC. AM. J., VOL. 58, SEPTEMBER-OCTOBER 1994
m deep, usually every 2 to 3 wk, with a 50-mm-diam. bucket auger. Six cores were sampled from each plot for bean and corn during the cropping season (two from the irrigated furrow, two from the middle of the bed, and two from the dry furrow). Eight cores were sampled from each plot for wheat during the cropping season (four from the furrow and four from the middle of the bed). Soil samples (six cores per plot, 0- to 4.6-m depth in 0.30-m increments) were sampled in the fall and spring between cropping seasons using a Giddings soil sampler.
Soil mineralization was determined using the buried bag technique (Westermann and Crothers, 1980). Measurements were made near the center of the length of the plot. Soil was removed from holes 50 mm in diameter and 460 mm deep using an auger. Usually 18 holes were dug per plot (six samplings of three bags each). Soil removed from one plot was composited and mixed, and the soil moisture was adjusted to the range of 0.18 to 0.20 kg kg' (50-100 kPa soil matric pressure). Bags (50 mm-diameter and 410 mm long) of 5-mm-thick polyethylene were filled with the soil, sealed, and inserted into the holes from which the soil had been previously removed. Bags were covered with 50 mm of soil. Bags with large changes in moisture from the initial content, or that had roots in them, were discarded (averaged 1 in 10).
Crop Nitrogen Uptake
Crop nitrogen uptake was measured for each crop in 1990 by sampling at intervals during the growing season. In both corn and bean, plants were removed from two 0.9-m rows per plot. Samples were not taken from the rows (four for corn or eight for bean) used for yield or from the outside rows. Plant stands were uniform with about 15 corn plants or 17 bean plants in the two 0.9-m rows. Corn was cut 50 to 80 mm above the soil surface, chopped, mixed, and subsampled. The subsample was dried at 55°C and run through a Jacobson hammer mill with a 1-mm screen. Corn was sampled four times between 9 July and 6 September. Bean plants were pulled and roots clipped off at the first node. Samples were then dried and ground in a Wiley mill with a 1-mm screen. Bean plants were sampled five times between 9 July and 7 September.
In 1991, wheat plants were sampled five times between 15 May and 30 July. A metal frame 660 by 762 mm (0.5 in 2) was laid on the soil surface at two locations in each plot and the plants within the frame harvested. Plants were clipped 30 to 50 mm above the soil surface, dried, and ground in a Wiley mill with a 1-mm screen. Bean plants were sampled in the same manner as 1990 except that six samples were obtained between 15 July and 6 September.
Crop Yield at Harvest
Corn, bean, and wheat yields were obtained by harvesting the center portion of each plot for the full length of the field (243 m). A sample ( 1 kg) was obtained for Kjeldahl analysis. The area harvested included the N strips, which were a small part of the total length (18.2 out of 243 m). Corn was harvested 27 Sept. to 1 Oct. 1990. The center two rows of corn were chopped and each truckload containing one plot was weighed to determine yield. Bean were harvested on 7 to 12 Sept. 1990 and 20 to 30 Sept. 1991. Bean plants were cut and raked, with six center rows thrown into a single windrow. The six rows were threshed and weighed. Wheat was harvested 3 or 4 Sept. to 1 Oct. 1990, combining the center 2.4 m of each plot for the length of the field (243 m).
Three areas in the CNT-WNT and CT-WT treatments (one in each N strip and an area adjacent to the strips) were harvested by hand in each plot outside the center area used for plot
yields to evaluate the effect of N on yield. These areas consisted of 3.65 m of row for corn and 9.7 m 2 for wheat.
Mineralization Index
Soil samples taken from the 0- to 0.3-m and 0.3- to 0.6-m soil depths in March 1990 and 1991 were incubated to determine potential N mineralization rate. Fifteen grams of water were added to a 50-g soil sample (matric pressure of =15 kPa) and incubated for 21 d at 35°C.
Plant and Soil Analysis
Soil samples from each plot were composited, screened (3.5-mm screen) and mixed, and a subsample frozen for later analysis. Soil samples were extracted with 2 M KCl (10 g soil to 50 mL of extracting solution) after a 30-min shake and filtered. Soil NO 3 and NH4 concentrations were determined by shaking 10 g of soil in 50 mL of 2 M KCI, filtering, and analyzing with a Lachet QuickChem AE (Lachat Instruments, 1993, Method no. 12-107-06-2-A for NI-I 4-N and Method no. 12-107-04-1-B for NO3-N). Plant samples were analyzed for total N using the Kjeldahl procedure.
Experimental Design
The design consisted of three treatments and six replications in a randomized complete block. Data were analyzed by analy-sis of variance. Yields in the N strips (where N fertilizer was applied in narrow strips across the plots) were analyzed as a split block. When the F test was significant at a probability of 0.05, we used the least significant difference test to separate means. Standard deviation was calculated for yields of bean.
RESULTS Crop Yields
Crop yields are presented in Table 2. The yield of silage corn in 1990 was higher (P 0.05) for the CT-WT treatment than the CNT-WNT. There was no significant difference in winter wheat yield between CNT-WNT and CT-WT. Additional N fertilizer applied to strips caused a significant yield increase when applied
Table 2. Crop yield in 1990 and 1991 for the three treatments: BT-BT, conventional-tilled bean; CNT-WNT, no-tillage silage corn and winter wheat; CT-WT, conventional-tilled silage corn and winter wheat.
Crop year
Napplied Yield
to strips BT-BT CNT-WNT CT-WT
kg ha- 1 Mg ha-'
Silage corn 1990
(oven dry weight) 0 16.5 18.2
82 17.9 19.5
164 18.5 20.3
LSD(0.05) 1.09 1.09
Winter wheat 1991 (weight of grain,
held moisture) 7.6 7.7
82 8.1 8.1
164 8.1 8.5
LSD(0.05) 0.65 0.65
Beant (weight of seed)
1990 3.7 ± 0.24$
1991 4.3 ± 0.19
t Separate yield samples were not taken in the N stripes so yields are for the whole plot.
0
120 150 180 270
DAY OF
210 240 THE YEAR 0 BEANS 1990 & 1991 - 7. CORN 1990 NT - c. CORN 1990 TILL _ q WHEAT 1991 NT & TILL
Fig. 1. Aboveground plant uptake of N for different crops with time (Day 110 is 20 April).
275 250 225 200 175 150 125 100 75 50 25
-T I -/- TI--7 -7- I TT I -7
-BT-BT ,- avg. CNT-WNT and CT-WT
0.1
1 1- 1 I
--60 0 60 120 (80 240 707
MEEK ET AL.: CROPPING EFFECTS ON ROOT-ZONE NITROGEN 1467
to silage corn at 82 or 164 kg N ha', compared with the zero rate. The increase in yield for silage corn when fertilizer application was increased from 82 to 164 kg N ha' was not significant. The only significant yield increase for wheat (compared with the zero rate) was for the no-till wheat when 164 kg N ha' was applied. The yield of bean was higher for 1991 than 1990.
Nitrogen Uptake
Silage corn had the highest plant N uptake, and winter wheat took up N sooner in the season than other crops (Fig. 1). Nitrogen uptake by bean was similar in 1990 and 1991, so data are presented as one curve. Symbiotic N fixation by bean was small because soil mineral N content (0-0.45-m depth) was high: 231 kg N ha' in 1990 and 251 kg N ha' in 1991. There was no difference in wheat yield or N uptake between CNT-WNT and CT-WT, so only the average is shown. The lower uptake late in the season may have resulted from low soil NO 3-N levels late in the season in this experiment. There was a greater N uptake for silage corn under CT-WT than CNT-WNT for the first two sample times but not for the last two sample times (P 0.05). This lack of differences during the latter part of the season may have been the result of switching in midseason to previously unirrigated furrows, which would have higher NO 3 levels and which may have been adequate for both treatments. Essentially all of the N in the silage corn was removed from the field. About 16% of the N contained in the aboveground material would have been returned as resi-due for the bean crop (Westermann et al., 1985).
Nitrogen Mineralization
Mineralization of N in the soil (0-0.45-m depth), determined by changes in the soil mineral N between crops and the buried bag technique during the cropping season, was higher in 1990 than in 1991 (Fig. 2). There were not significant differences in mineralized N among treatments in 1990. About 268 kg N ha" was mineralized by 4 Sept. 1990 but only 210 kg N ha' in the 1991 season. Nitrogen mineralization was not affected by treat-ments in 1990. There were significant differences in
DAY OF THE YEAR
Fig. 2. Mineralization of N in the 0- to 0.45-m depth of soil in 1990 and 1991 (average of all treatments; Day 60 is 1 March).
mineralization between treatments on only two dates in
1991 (data not shown).
The N mineralization index for soil samples taken in the spring of 1990 was 168 and 51 kg N ha' for the 0- to 0.3-m and 0.3- to 0.6-m depths, respectively; for spring 1991 samples, the values were 154 and 49 for the 0- to 0.3-m and 0.3- to 0.6-m, respectively. Mineral-ization index (incubated) N was less than the field mea-surement of mineralized N in 1990 (219 compared with 268 kg N ha"), but the amounts were similar in 1991.
Soil Mineral Nitrogen
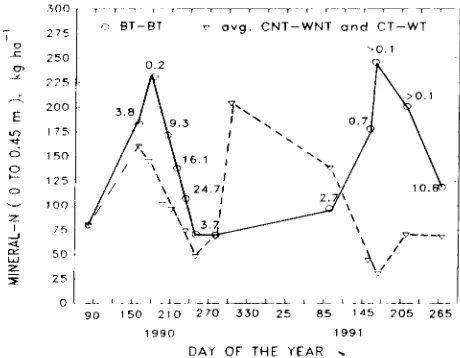
The BT-BT treatment had the highest mineral-N con-tent in the soil during the growing season, especially during the second season (Fig. 3). The higher mineral N content was caused by a later or lower plant uptake of N compared with other cropping treatments. The other treatments were only higher during the winter and early
90 150 210 270 330 25 85 145 205 265
1990 1991
DAY OF THE YEAR 111,
Fig. 3. Soil mineral-N levels (0-0.45-m depth) in 1990 and 1991 for conventional-tilled bean (BT-BT) and the average of no-till corn followed by no-till wheat (CNT-WNT) and conventional-tilled corn followed by conventional-tilled wheat (CT-WT). An application was made of 82 kg N ha - 1 on Day 288 (15 Oct. 1990) to wheat. The number near the symbol for the BT-BT treatment gives the
P > F (%) for that treatment compared with the other treatment
on the closest sampling date.
300
275
_C 250 0,
725
200
175
0 150 O ti 125 O
100
1 75
50
5 25
1468 SOIL SCI. SOC. AM. J., VOL. 58, SEPTEMBER-OCTOBER 1994
300
275
250
225
200
175
150
125
100
75
50
25
0 1111_111 1111 1111111 1
90 150 210 270 330 25 85 145 205 265
1990 1991
DAY OF THE YEAR
Fig. 4. Soil mineral-N levels (0-0.45-m depth) in 1990 and 1991 for no-till corn followed by no-till wheat (CNT-WNT) and conventional-tilled corn followed by conventional-conventional-tilled wheat (CT-WT). An application was made of 82 kg N ha -' as urea on Day 288 (15 October) and irrigation on Days 289 to 290 of 1990. The number near the symbol for the CT-WT treatment gives the P > F (%) for that treatment compared with the other treatment on that date.
spring after application of 82 kg N ha' to wheat in the fall of 1990.
There was a loss of mineral N from the CNT-WNT and CT-WT treatments during 3 Oct. 1990 to 3 Apr. 1991 (Fig. 3). In contrast, the BT-BT treatment gained mineral N from 10 Sept. 1990 to 3 Apr. 1991. The differences may have been due to leaching, because winter wheat received an irrigation (infiltration 152 mm) on 20 Sept. 1990 and the bean treatment did not.
The CNT-WNT and CT-WT treatments had similar soil mineral N contents (Fig. 4). There were no differ-ences (P 0.05) between treatments when soil mineral contents were averaged for 23 June to 5 Sept. 1990. Differences occurred after fertilizer was applied, with the CT-WT treatment having higher amounts (P > 0.05) on 30 Oct. 1990 and 20 May and 2 June 1991.
Nitrogen Balance
Nitrogen balance was calculated for the main part of the growing season (Table 3). Initial soil N levels were high, especially for bean. Ninety five percent of the available N was recovered by plant uptake and change
in residual soil N (average of all years and treatments). When available N was not recovered, it would indicate NO3 removal by leaching, immobilization, volatilization, or denitrification. An example of this was when bean or wheat was grown. The high plant N uptake of corn resulted in recovery of all the available N. Because of the lower N uptake of bean in 1990 compared with corn, an excess of soil N (251 kg N ha-') was present at the start of the season for bean in 1991.
DISCUSSION
The crop sequence of silage corn followed by winter wheat left lower residual soil mineral N (0-0.45-m depth) than the crop sequence of bean followed by bean. Residu-als on 20 May were 251 kg N ha-' for bean and 30 kg N ha- 1 for corn-wheat (Fig. 3). The higher soil NO3 levels under bean were probably the result of a lower N uptake of the bean compared with the corn. Nitrogen fixation would have been low because of the high soil NO3 levels found in the soil. Westermann et al. (1981) measured only 10 kg ha- 1 fixed by this cultivar when 223 kg N ha-' was present in the soil at the start of the season. Lower levels should result in less NO 3 leaching below the root zone under normal irrigation practices.
Mineralization rates (April-August) were 1.1 kg N ha-' d' in 1990 and 0.9 kg N ha-' d- I in 1991. Stanford and Smith (1972) also measured high mineralization rates for this soil, with the rate being higher for the Portneuf soil than for most of the other soils tested. Also, there was only a slight reduction in the mineralization rate the second year after alfalfa, compared with the first year. The N contribution from the alfalfa is only part of the soil N being mineralized. Mineralization measured in the laboratory was three times higher at the 0- to 0.30-m depth than at the 0.30- to 0.60-m depth for both years. Levin et al. (1987) measured a low residual N fertilizer equivalent of 126 kg N ha - ' for first-year corn following alfalfa. In contrast, Carter et al. (1991) conducted re-search in the same area as this experiment and also measured high rates of N mineralization.
Soil mineral-N contents for the CNT-WNT and CT-WT treatments were similar, except after fall application of urea to the wheat. The application of urea to winter wheat in the fall of 1990 increased mineral N more in the CT-WT treatment than the CNT-WNT treatment
II111111T-1-1-F1 i i Ili!
0 CNT-WNT o CT-WT 4.6
Table 3. Soil N balance for treatments with time during the main part of the growing season (0-0.45-m soil depth); treatments: BT-BT, conventional-tilled bean; CNT-WNT, no-tillage silage corn and winter wheat; CT-WT, conventional-tilled silage corn and winter wheat.
Treatment
and crop Year
Time period
Initial
soil N mineralized available
Crop N uptake
Residue soil
Total N
recovery Difference
d of yr kg/ha
BT-BT
Bean 1990 183-249 231 68 299 187 71 258 - 41
Bean 1991 164-238 251 61 312 187 107 294 - 18
CNT-WNT
Corn 1990 159-280 161 125t 286 240 67 307 21
Wheat 1991 93-213 117 105 222 135 70 205 - 17
CT-WT
Corn 1990 159-280 159 125 284 264 75 339 55
Wheat 1991 93-213 159 105 264 135 71 206 - 58
MEEK ET AL.: CROPPING EFFECTS ON ROOT-ZONE NITROGEN 1469
(Fig. 4). The large amount of mineral N measured for the winter wheat tilled treatment on Day of the Year 303 (30 Oct. 1990) seems unreasonably high because the mineral N on Day of the Year 280 (7 Oct. 1990) was 76 kg N ha ', and a fertilizer application of 82 kg N ha' would have resulted in only 158 kg N ha'. The lower mineral N in the no-till treatment could be from NH3 loss because the urea fertilizer was not mechanically incorporated in this treatment. It could have also been caused by more leaching of the surface-applied fertilizer in the CNT-WNT treatment because of a greater number of macropores (Shipitalo and Edwards, 1993). Shipitalo and Edwards (1993) measured much greater leaching of surface-applied NH4-N fertilizer through 750-mm-long columns under no-till than tilled soil.
There were mineral-N losses during the winter under wheat, which received a fall irrigation, but an increase in soil mineral N for the bean treatment, which received no fall irrigation. The average loss was 67 kg N ha" (0-0.45 m) for winter wheat. Winter precipitation from 1 Oct. 1990 to 1 May 1991 was 130 mm. Drainage below 1.35 m from 20 Oct. 1990 to 25 Mar. 1991, determined by calculating the water balance, was 49, 114, and 117 mm for the BT-BT, CNT-WNT, and CT-WT treatments, respectively (Meek et al., 1994). Larger drainage losses for the CNT-WNT and CT-WT treat-ments resulted from starting the winter with a wet profile because of the 16 to 17 Oct. 1990 irrigation applied to these treatments. The NO 3-N concentration of the soil solution was 25, 7, and 6 mg kg' (using the average of the soil solution concentration at the last sampling in 1990 and the first sampling in 1991) for the BT-BT, CNT-WNT, and CT-WT treatments, respectively (Meek et al., 1994). Losses of NO 3-N would be 12, 8, and 8 kg N ha" for the BT-BT, CNT-WNT, and CT-WT treatments, respectively. Additional research is needed to determine if the reduction in soil NO3 in the root zone during the winter is a result of leaching, denitrification, or immobilization.
The N uptake of winter wheat in this experiment
was less than determined by Westermann and Crothers (1993), who measured 137 and 196 kg N ha' when wheat was fertilized at the rate of 56 or 112 kg N ha".
REFERENCES
Carter, D.L., R.D. Berg, and B.J. Saunders. 1991. Producing no-till cereal or corn following alfalfa on furrow-irrigated land. J. Prod. Agric. 4:174-179.
Doran, J.W. 1980. Soil microbial and biochemical changes associated with reduced tillage. Soil Sci. Soc. Am. J. 44:765-771. Eck, H. V., and O.R. Jones. 1992. Soil N status as affected by tillage,
crops, and crop sequences. Agron. J. 84:660-668.
Fox, R.H., and W.P. Piekielek. 1988. Fertilizer N equivalence of alfalfa, birdsfoot trefoil, and red clover for succeeding corn crops. J. Prod. Agric. 1:313-317.
Lachat Instruments. 1993. Methods list for the Quickchem Automated Ion Analyzer. Lachat Instruments, Milwaukee, WI.
Levin, A., D.B. Beegle, and R.H. Fox. 1987. Effect of tillage on residual N availability from alfalfa to succeeding corn crops. Agron. J. 79:34-38.
Meek, B.D., D.L. Carter, D.L. Westermann, J.L. Wright, and R.E. Peckenpaugh. 1994. Nitrate leached: Effect of crop sequence and tillage under furrow irrigation. Soil Sci. Soc. Am. J. (in press). Peterson, T.A., and M.P. Russelle. 1991. Alfalfa and the N cycle
in the corn belt. J. Soil Water Conserv. 46:229-235.
Robbins, C.W., and D.L. Carter. 1980. Nitrate-N leached below the root zone during and following alfalfa. J. Environ. Qual. 9:447-450.
Shipitalo, M.J., and W.M. Edwards. 1993. Seasonal patterns of water and chemical movement in tilled and no-till column lysimeters. Soil. Sci. Soc. Am. J. 57:218-223.
Stanford, G., and S.J. Smith. 1972. Nitrogen mineralization potentials of soils. Soil Sci. Soc. Am. J. 36:465-472.
Varco, J.J. , J.H. Grove, W.W. Frye, and M.S. Smith. 1991. Nitrogen availability from alfalfa suppressed or killed for no-till production. Commun. Soil Sci. Plant Anal. 22:1527-1535.
Westermann, D.T., and S.E. Crothers. 1980. Measuring soil N miner-alization under field conditions. Agron. J. 72:1009-1012. Westermann, D.T., and S.E. Crothers. 1993. Nitrogen fertilization
of wheat no-till planted in alfalfa stubble. J. Prod. Agric. 6:404-408.
Westermann, D.T., G.E. Kleinkopf, L.K. Porter, and G.E. Leggett. 1981. Nitrogen sources for bean seed production. Agron. J. 73: 660-664.