R E S E A R C H A R T I C L E
Open Access
Association of excessive daytime sleepiness
with migraine and headache frequency in
the general population
Knut Stavem
1,2,3,4*, Håvard Anton Kristiansen
1,2, Espen Saxhaug Kristoffersen
1,5, Kari Jorunn Kværner
1,6,7and Michael Bjørn Russell
1,2Abstract
Background:Some previous studies have postulated an association between migraine and excessive daytime sleepiness (EDS). This study evaluated the association of EDS with migraine and headache frequency in a general population, after adjusting for potential confounding variables.
Methods:The study was a postal survey of a random age and gender-stratified sample of 40,000 persons aged 20 to 80 years old drawn by the National Population Register in Norway. The questionnaire included questions about migraine, headache, the Epworth sleepiness scale (ESS) and various comorbidities. EDS was defined as ESS > 10. The association of EDS and migraine/headache were analysed by bivariate and multivariable logistic regression analyses. Results:A total of 21,177 persons responded to the ESS and were included in the analyses. The odds ratio (OR) for EDS was increased for migraineurs (1.42 (95% CI 1.31─1.54),p <0.001) compared to non-migraineurs; however, this finding was not significant after adjustment for a number of possible confounders. EDS increased with increasing headache frequency, with an OR of 2.74 (95% CI 2.05─3.65),p <0.001) for those with headache on >179 days per year compared to those without headache in multivariable analysis.
Conclusions:In a general population, the odds for EDS increased significantly with the headache frequency, irrespective of migraine status. EDS was not associated with reported migraine in multivariable analysis.
Keywords:Epidemiology, Excessive daytime sleepiness, Headache, Migraine
Background
Headache is the most common type of pain experienced by man, but receives little attention, possibly due to the often mild symptoms, and because most people rarely consult their physician due to headache [1]. Almost everyone experience tension-type headache once in a while, and migraine affects 10–20% of the general popu-lation [2, 3]. About 3% of the world popupopu-lation have chronic headache, i.e. mainly chronic tension-type head-ache or chronic migraine [4, 5].
Persons with headache and/or migraine often complain of sleepiness, a symptom with high clinical and public
health importance due to increased risk for accidents, de-creased productivity and impaired quality of life [6–9]. Ex-cessive daytime sleepiness (EDS) is experienced by 8─30% of the general population [10–13]. Despite the considerable burden of EDS, it is still under-reported, under-diagnosed and under-treated among those with chronic pain as well as in the general population [14–16].
Some clinic-based [17–20] or population-based [21] studies have proposed an association between migraine and EDS. Recently a large population-based study re-ported an association between migraine and EDS in bi-variate analysis, but this association was weakened in multivariable analysis and became non-significant when adjusting for anxiety, depression, sleep duration and a score for sleep quality [22]. Moreover, whether EDS is associated with headache frequency in migraineurs var-ies between studvar-ies [21, 22].
* Correspondence:knut.stavem@medisin.uio.no
1
Head and Neck Research Group, Research Centre, Akershus University Hospital, Lørenskog, Norway
2Institute of Clinical Medicine, Campus Akershus University Hospital,
University of Oslo, Lørenskog, Norway
Full list of author information is available at the end of the article
The present study aimed to investigate the association of EDS with migraine and headache frequency in an age and gender-stratified general population sample, after adjusting for possible confounders.
Methods
Study design and sample
An age and gender-stratified random sample of 40,000 persons aged 20─80 years old were drawn by the Na-tional Population Register of Statistics Norway. Each of the ages 30, 35, 40, 45, 50, 55 and 60 years included 2,000 persons of each gender, while the remaining ages included 1,000 persons of each gender. The participants were residing in Akershus, Hedmark or Oppland County. The sample size was reduced to 38,871 because of error in the address list (n =1,024), multi-handicap (n =4), dementia (n =23), insufficient Norwegian language skills (n =3) and deceased (n =75). The three counties have both rural and urban areas, and Akershus County is situated in close proximity to Oslo. Details of the study have previously been presented [23].
Postal survey
All participants received a mailed questionnaire with a standard letter containing information about the project. Apart from ensuring confidentiality and emphasising the importance of participation, it was stated that the objective was to study sleepiness during daytime. If the question-naire evoked no response, a second mail was issued. The replies could either be on paper or web-based. The data were collected between February and August 2006. All questionnaires were scanned using TeleForm version 9 (Cardiff Software Ltd, Cambridge, UK).
Migraine and headache
The questions: “How many days during the last year
have you had headache? (0 days, 1─11 days,
12─30 days, 31─84 days, 85─179 days or≥180 days)”, and “Have you ever had migraine? (yes or no)” were used to screen for headache frequency and migraine. We applied the International Classification of Headache Dis-orders (ICHD-II) definitions slightly modified, i.e. no headache is 0 headache days within the last year, infre-quent headache is 1–11 headache days within the last year, frequent headache is 12─179 headache days within the last year, while chronic headache is 180 days or more within the last year [24]. The term non-migraineurs de-scribes those without migraine, independent of whether they reported headache or not.
Daytime sleepiness and average sleep time
Daytime sleepiness was assessed by the Epworth Sleepi-ness Scale (ESS). The ESS is a standardized question-naire which describes eight daily situations in which the
respondents estimate their likelihood of dozing off on a scale of 0 to 3, i.e. 0 = no chance of dozing, 1 = slight chance of dozing, 2 = moderate chance of dozing and 3 = high chance of dozing [25]. The ESS score thereby ranges from 0 to 24, and the results were dichotomized into scores ≤10 and >10, the latter is considered to rep-resent clinically significant EDS [26]. A question of aver-age sleep time duration during the night was answered in hours and minutes and was categorized into three classes: short (<6 h), normal (6─8 h) and long (>8 h) sleep duration. In Norway, the ESS has exhibited proper-ties in line with other language versions of the question-naire [27].
Smoking status and body mass index
Smoking status was assessed with the item “How many
cigarettes do you usually smoke per day?”, coded as none, 1─10, 11─20, >20 for the analyses. Body mass index (BMI) in kg/m2was calculated from self-reported weight and height.
Comorbidity
To screen for depression, we asked the question:“Have you felt depressed or experienced diminished interest or pleasure in activities you usually enjoy?” This is a com-bination of two questions, where a“yes”answer to either of the two questions was considered a positive test [28]. The replies were dichotomized, i.e. never or rarely, 1─2 times a month, 1─2 times a week or 3─4 times a week were classified as no depression, while almost daily was classified as depression.
The participants also responded to items about other comorbidities: previous myocardial infarction (yes or no), stroke (yes or no), current/previous angina pectoris (yes or no), asthma (yes or no), allergy (yes or no), hypertension (yes, no or unknown), or diabetes (yes or no). Finally, they responded to an item about ever having had treatment for a sleep disorder (yes or no).
Statistical analyses
Descriptive statistics are presented using the mean (SD) or number (%). Groups were compared using the chi-square test.
Prevalence estimates are presented with cross-tables. To assess possible effect modification, the homogeneity of odds ratios (OR) for EDS in migraine vs. non-migraine was tested in stratified analyses using the chi-square test.
modelling was conducted in several steps: (1) Bivariate models, (2) Multivariable models with the six variables mentioned above, (3) Multivariable models as (2) with the addition of the variables of allergy, angina pectoris, asthma, diabetes, hypertension, myocardial infarction and stroke, and (4) Multivariable models as (3) with the addition of the variables cigarette smoking, nightly sleep duration, and treatment for sleep disorder. Missing values were not imputed, and deletion of cases in the models was listwise.
Tests for multiplicative interactions were conducted be-tween migraine*gender, headache frequency*gender, and migraine*headache frequency. Finally, model (3) was repli-cated in subsets of the respondents: non-migraineurs, migraineurs, men, and women.
All statistical analyses were performed using Stata ver-sion 14.1 (StataCorp, College Station, TX). We chose a 5% significance level, using two-sided tests.
Ethical issues
The project was approved by The Regional Committees for Medical Research Ethics and the Norwegian Social Science Data Services.
Results
The overall response rate was 54.5% (21,177/38,871). The respondents had a mean (SD) age of 50.5 (15.6) years and comprised 52.5% women (Table 1). Complete information on headache and migraine was reported by 89.4% of women and by 88.0% of men. Regarding replies to the ESS, 4.7% of women and 3.3% of men had missing values in one question, 0.7% of women and 0.6% of men had missing values in two questions, while 1.2% of women and 0.7% of men had missing values in three or more questions.
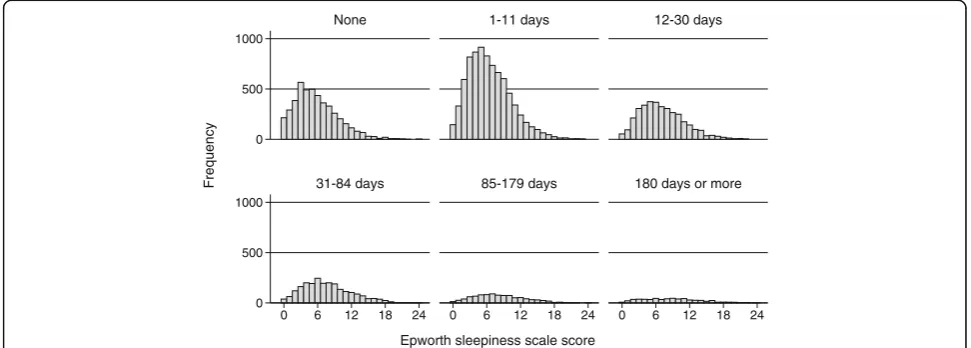
The 1-year prevalence of headache was 77.2%; 84.0% (8,872/10,558) in women and 69.6% (6,590/9,463) in men. The lifetime prevalence of migraine was 26.5%; 34.1% (3,562/10,441) in women and 18.1% (1,696/9,392) in men (p <0.001). In the total population the mean (SD) ESS score was 6.7 (4.0); among migraineurs 7.1 (4.2) (n= 5,258) and non-migraineurs 6.5 (3.9) (n= 14,575). The ESS scores according to migraine status (Fig. 1) and headache frequency (Fig. 2) showed skewed distributions in most subgroups.
Among migraineurs, non-migraineurs, and those with a missing response to the migraine item, the prevalence of EDS increased with headache frequency in all three groups (Table 2). The overall prevalence of EDS among the respondents (n= 21,177) was 17%, and it was 20% among migraineurs, 15% among non-migraineurs, and 19% among those with missing value on the migraine item.
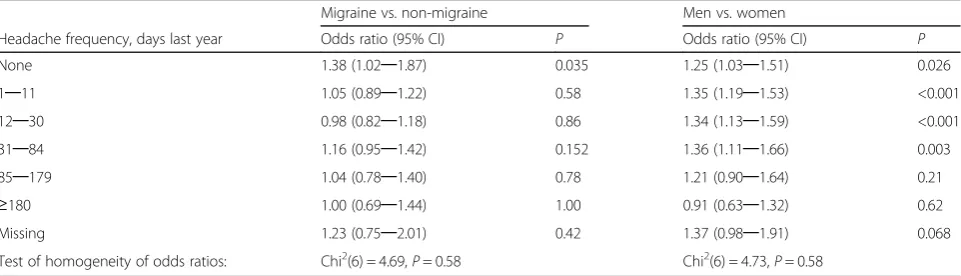
There was no indication of heterogeneity of the ORs for EDS in migraine vs. non-migraine, or women vs. men in strata according to headache frequency (Table 3). In bivariate logistic regression analysis, the odds ratio (OR) for having EDS was higher among migraineurs than non-migraineurs, and the OR for EDS increased with increasing headache frequency (Table 4).
Table 1Descriptive statistics for survey respondents, number (%) unless otherwise stated
N
Age in years, mean (SD) 21,177 50.5 (15.6)
Gender, women 21,177 11,120 (53)
Epworth sleepiness scale score, mean (SD) 21,177 6.7 (4.0)
Epworth sleepiness scale score >10 21,177 3,501 (17)
Migraine 19,833 5,258 (27)
Headache frequency (days last year) 20,021
None 4,559 (23)
1-11 8,109 (41)
12-30 3,547 (18)
31-84 2,280 (11)
85-179 951 (5)
180 days or more 575 (3)
Body mass index in kg/m2, mean (SD) 20,818 25.8 (4.2)
Comorbidity
Symptoms of depression 20,476 1,401 (7)
Myocardial infarction 20,686 814 (4)
Stroke 19,938 536 (3)
Angina pectoris 20,681 978 (5)
Hypertension 20,868
No 14,903 (71)
Yes 3,591 (17)
Unkown 2,374 (11)
Diabetes 20,685 934 (5)
Allergy 20,121 6,564 (33)
Asthma 19,156 2,287 (12)
Treated for sleep disorder 20,749 1,251 (6)
Smoking (cigarettes per day) 17,286
None 11,902 (69)
0─10 2,867 (17)
11─20 2,252 (13)
>20 265 (2)
Average nightly hours slept, mean (SD) 20,907 7.0 (1.1)
Average nightly hours slept, categorized
<6 1,750 (8)
6-8 17,541 (83)
In multivariable logistic regression analysis, the relation-ship between migraine and EDS was weaker than in bi-variate analysis, while the pattern of increasing OR for EDS with increasing headache frequency persisted in models after adjusting for age, BMI, depression, and gen-der (Table 4). Adjusting for additional potential comorbid-ities in two steps did not change this pattern (Table 4). Interaction terms between migraine*gender, headache fre-quency*gender, and migraine*headache were statistically not significant and were left out in the models.
In multivariable analysis in strata of the respondents, the pattern of ORs was consistent across migraineurs and non-migraineurs after adjusting for headache fre-quency, age, BMI, depression, gender and other comor-bidities, and across women and men after adjusting for migraine, headache frequency, age, BMI, depression and other comorbidities (Table 5).
Discussion
This population-based cross-sectional study has demon-strated (1) a relationship between migraine and EDS in
bivariate analysis, although this association was weak-ened and eventually disappeared in multivariable ana-lysis, and (2) an association between headache frequency and EDS, which was consistent after adjustment for nu-merous potential confounders, and also when the ana-lysis was replicated in subsets of the study population, i.e. among migraineurs, non-migraineurs, women or men.
Overall 17% met the criteria for having EDS, which is in line with that of a previous Norwegian telephone sur-vey of a general population [29]. Our 20% prevalence of EDS in migraineurs was identical to that of Korean migraineurs from the general population [22]. The EDS prevalence in European clinic populations was 14% in those with episodic migraine [18] and 20% in chronic migraine [20], while it was substantial higher in an American clinic population, i.e. 32% in episodic migrai-neurs and 40% in chronic migraimigrai-neurs [17]. The higher prevalence in the American study may partly be ex-plained by a slightly higher mean BMI and lower ESS cut off, i.e. ≥ 10 rather than >10 in the present and
0 500 1000 1500
0 6 12 18 24 0 6 12 18 24
Non-migraine Migraine
Frequency
Epworth sleepiness scale score
Fig. 1Histogram of the frequency of Epworth sleepiness scale scores for participants according to migraine or non-migraine status
0 500 1000
0 500 1000
0 6 12 18 24 0 6 12 18 24 0 6 12 18 24
None 1-11 days 12-30 days
31-84 days 85-179 days 180 days or more
Frequency
Epworth sleepiness scale score
Korean studies. The European clinic studies included 100 person with episodic and chronic migraine, respect-ively, while the American clinic study included 72 per-sons with episodic migraine and 128 perper-sons with chronic migraine, providing relative broad confidence in-tervals for the EDS prevalence, i.e. 14% (8–22%), 20% (13–29%), 32% (25–48%) and 40% (31–49%).
The present study found an association between mi-graine and EDS in bivariate analysis, which was weaker in the multivariable analyses and disappeared when adjusting for all potential confounders, a finding similar to that of The Korean population-based study when adjusting for anxiety, depression, sleep duration and Pittsburgh Sleep Quality index score [22]. These findings are in concert with another population-based study reporting increased odds of EDS in migraineurs com-pared with headache-free individuals after adjustment for age, sex and sleep-promoting medication [21]. The findings are also supported by a case–control study of episodic migraine [18, 20], as well as a study including 370 migraineurs and 119 non-migraineurs [20]. The lat-ter study found a statistically significant association of chronic migraine and EDS with an OR of 3.9 (95% CI 1.5.–10.2), although the mean ESS score was not
significant different between those with chronic migraine and healthy controls [20].
In contrast, one study reported a statistically signifi-cant association between migraine and sleep problems after adjusting for both lifetime and current anxiety and mood disorders [30]. This was a controlled study using a systematic assessment of migraine, sleep prob-lems and anxiety and mood disorders with interviews, in contrast to the present, larger questionnaire-based survey.
In the present study, the prevalence of EDS increased with headache frequency, independent of migraine sta-tus, in line with a previous general population study [21], although in the latter study the increased ORs for EDS with increasing headache frequency were statisti-cally not significant. Therefore, it is possibly the fre-quency of the pain rather than migraine or tension-type headache in itself that is associated with EDS.
There was no evidence of effect modification of gender or headache frequency on the association of migraine with EDS, or of gender on the association of headache frequency with EDS, as indicated by the homogeneity of the ORs and the lack of significant interactions in the re-gression models.
Table 2Prevalence of excessive daytime sleepiness (EDS), defined as Epworth sleepiness scale score >10, according to migraine and headache frequency
Non-migraine Migraine Missing migraine item Total
Headache frequency, days last year N n (%) N n (%) N n (%) N n (%)
None 3,814 413 (11) 390 56 (14) 355 56 (16) 4,559 525 (12)
1–11 6,159 862 (14) 1,568 228 (15) 382 59 (15) 8,109 1,149 (14)
12–30 2,040 378 (19) 1,302 238 (18) 205 41 (20) 3,547 657 (19)
31–84 1,019 227 (22) 1,087 271 (25) 174 42 (24) 2,280 540 (24)
85–179 411 115 (28) 482 139 (29) 58 14 (24) 951 268 (28)
≥180 219 76 (35) 294 102 (35) 62 22 (35) 575 200 (35)
Missing 913 124 (14) 135 22 (16) 108 15 (14) 1,156 162 (14)
Total 14,575 2,196 (15) 5,258 1,056 (20) 1,236 234 (19) 21,177 3,501 (17)
Table 3Odds ratios and 95% confidence intervals (95% CI) for having excessive daytime sleepiness (EDS) for migraineurs compared to non-migraineurs, and men versus women. Stratified analyses according to headache frequency categories
Migraine vs. non-migraine Men vs. women
Headache frequency, days last year Odds ratio (95% CI) P Odds ratio (95% CI) P
None 1.38 (1.02─1.87) 0.035 1.25 (1.03─1.51) 0.026
1─11 1.05 (0.89─1.22) 0.58 1.35 (1.19─1.53) <0.001
12─30 0.98 (0.82─1.18) 0.86 1.34 (1.13─1.59) <0.001
31─84 1.16 (0.95─1.42) 0.152 1.36 (1.11─1.66) 0.003
85─179 1.04 (0.78─1.40) 0.78 1.21 (0.90─1.64) 0.21
≥180 1.00 (0.69─1.44) 1.00 0.91 (0.63─1.32) 0.62
Missing 1.23 (0.75─2.01) 0.42 1.37 (0.98─1.91) 0.068
This study had several strengths. Firstly, it was a very large population-based survey. Secondly, the multivari-able analyses were conducted in three consecutive steps and adjusted for an increasing number of possible con-founders in each step.
Several potential limitations of this study should be mentioned. The response rate was relatively low; however, it was comparable to that of some other sleep-related epi-demiologic studies [29, 31] and higher than in recent population-based studies of headache and sleep [21, 22].
The present study defined EDS as ESS > 10, in line with the recommendation of the developer of the ESS [32], recent epidemiological studies [33–35] and a recent population-based study of headache and sleep [22]. In contrast, for unknown reasons, most previous studies of the association of migraine or headache frequency with EDS defined EDS as ESS≥10 [17–21], which would lead to a higher prevalence of EDS. The ESS is widely used in evaluating subjective daytime sleepiness [25, 36]. How-ever, the ESS has been criticized because it shows little association with objective measures, such as the multiple sleep latency test (MSLT) [37–39]. The large number of participants in this study precluded the use of MSLT for more comprehensive assessment of daytime sleepiness.
Another potential limitation is that the data reported in the present study were self-reported. This study asked about lifetime prevalence of migraine. The single ques-tion about lifetime occurrence of migraine, which was used, has previously been evaluated against a clinical interview by two physicians in another Norwegian sur-vey in eastern Akershus County, reporting a raw
agree-ment rate of 0.81 and kappa (κ) of 0.62, which is
considered to be a good agreement [23]. Two previous epidemiological surveys used the same screening ques-tion for migraine as in the present study, and the ob-served agreement rates were 0.92 and 0.94, and κ were 0.77 and 0.81, respectively [2, 40]. Due to the high num-ber of participants in our survey, it was not feasible to apply the gold standard, i.e. a clinical interview by a physician/neurologist with expertise in headache diag-nostics. The current study did not investigate the effect of EDS on clinical characteristics of migraine, which would require more detailed clinical information than is possible in a questionnaire-based general population survey.
Single questions about tension-type headache and its frequency have been compared with a clinical interview, and the agreement was good [3, 40]. We think our Table 4Odds ratios with 95% confidence intervals (95%CI) for having excessive daytime sleepiness (EDS), logistic regression analysis
Bivariate analysis Multivariable analysis
Multivariable
analysisa Multivariableanalysisb
N 19,833─21,177 18,027 15,299 12,369
Odds ratio (95%CI) P Odds ratio (95%CI) P Odds ratio (95%CI) P Odds ratio (95%CI) P
Migraine
No 1 1
Yes 1.42 (1.31─1.54) <0.001 1.11 (1.01─1.22) 0.032 1.11 (1.00─1.23) 0.044 1.08 (0.96─1.21) 0.196
Headache frequency, days per year
None 1 1 1 1
1─11 1.27 (1.14─1.42) <0.001 1.18 (1.05─1.34) 0.009 1.23 (1.07─1.41) 0.003 1.17 (1.00─1.36) 0.05
12─30 1.75 (1.54─1.98) <0.001 1.54 (1.33─1.78) <0.001 1.53 (1.31─1.80) <0.001 1.50 (1.25─1.79) <0.001
31─84 2.38 (2.09─2.72) <0.001 2.07 (1.77─2.42) <0.001 2.02 (1.70─2.40) <0.001 2.00 (1.65─2.43) <0.001
85─179 3.02 (2.55─3.57) <0.001 2.53 (2.08─3.06) <0.001 2.39 (1.93─2.96) <0.001 2.26 (1.77─2.87) <0.001
≥180 4.10 (3.37─4.98) <0.001 3.12 (2.49─3.92) <0.001 3.12 (2.42─4.02) <0.001 2.74 (2.05─3.65) <0.001 Age, per 10 years 0.85 (0.83─0.87) <0.001 0.87 (0.85─0.90) <0.001 0.88 (0.85─0.91) <0.001 0.88 (0.84─0.91) <0.001
Gender
Women 1 1 1 1
Men 1.10 (1.02─1.18) 0.01 1.26 (1.16─1.37) <0.001 1.21 (1.11─1.33) <0.001 1.22 (1.10─1.35) <0.001
Body mass index, per kg/m2 1.05 (1.04─1.06) <0.001 1.05 (1.04─1.06) <0.001 1.04 (1.03─1.05) <0.001 1.04 (1.02─1.05) <0.001
Symptoms of depression
No 1 1 1 1
Yes 2.99 (2.66─3.36) <0.001 2.45 (2.15─2.80) <0.001 2.48 (2.13─2.88) <0.001 2.20 (1.86─2.62) <0.001 a
adjusted for additional potential confounders allergy, angina pectoris, asthma, diabetes, hypertension, myocardial infarction and stroke b
question regarding headache was at least as precise as the single question about tension-type headache, be-cause the term headache is known by everybody, while some subjects may not know what tension-type head-ache is. Similarly, we think the frequency report on headache is likely to be precise.
The data on headache frequency was based on head-ache during the last year, which is likely to be less sub-ject to recall bias as compared to headache earlier in life. Moreover, the single question about self-reported de-pression might be less precise than a more extensive questionnaire or diagnostic interview. However, the combination of the two questions into one item has been shown to have a sensitivity of 96% (95% CI 90─99%) and specificity of 57% (95%CI 53─62%) in re-lation to major depression [28]. This compares with a sensitivity of 89─96% and specificity 51─72%, when ascertained with more extensive questionnaires [28].
The present study did not assess the quality of sleep, or the use of analgesics that may be associated with headaches and EDS, or β-blockers that may be used in prophylactic treatment of migraine and may be associ-ated with EDS. However, only a small minority of migraineurs useβ-blockers.
The focus of this paper was on the association of mi-graine and headache frequency with EDS, and not on a
general prediction model for EDS. Therefore, we have focused on factors that may confound the association of migraine and/or headache frequency with EDS, and on possible effect modification between some of these vari-ables. EDS depends on several factors known to interfere with the sleep-awake cycle, while headache and migraine are mainly known to vary with gender. For example, caf-feine, alcohol, employment including nightshifts, restless legs syndrome, concomitant urological diseases, men-struation and thyroid hormones may be associated with EDS. However, based on the literature, we are not aware of firm evidence for an association of these factors with migraine or tension-type headache, and if such an asso-ciation exists it is most likely of limited importance.
Conclusions
This study showed that EDS was associated with an in-crease in headache frequency in both migraineurs and non-migraineurs. In contrast, the association between migraine and EDS disappeared after adjustment for a number of confounders.
Abbreviations
EDS:Excessive daytime sleepiness; ESS: Epworth sleepiness scale;
ICHD: International classification of headache disorders; MSLT: Multiple sleep latency test; SD: Standard deviation
Table 5Odds ratios and 95% confidence intervals (95% CI) for having excessive daytime sleepiness (EDS), multivariable logistic regression analysisain strata of the population
Migraineurs Non-migraineurs Men Women
N 4,126 11,173 7,313 7,986
Odds ratio (95%CI) P Odds ratio (95%CI) P Odds ratio (95%CI) P Odds ratio (95%CI) P
Migraine
No - - 1 1
Yes - - 1.18 (1.01─1.38) 0.041 1.07 (0.94─1.22) 0.31
Headache frequency, days per year
None 1 1 1
1─11 0.93 (0.63─1.37) 0.73 1.27 (1.09─1.47) 0.002 1.32 (1.11─1.57) 0.001 1.09 (0.86─1.37) 0.48
12─30 1.21 (0.82─1.79) 0.34 1.58 (1.32─1.89) <0.001 1.63 (1.31─2.03) <0.001 1.37 (1.07─1.75) 0.013
31─84 1.74 (1.17─2.57) 0.006 1.92 (1.55─2.37) <0.001 2.30 (1.79─2.94) <0.001 1.74 (1.34─2.25) <0.001
85─179 1.90 (1.24─2.91) 0.003 2.52 (1.91─3.34) <0.001 2.33 (1.65─3.30) <0.001 2.21 (1.64─2.96) <0.001
≥180 2.72 (1.71─4.30) <0.001 2.92 (2.04─4.19) <0.001 2.43 (1.57─3.77) <0.001 3.21 (2.30─4.50) <0.001 Age, per 10 years 0.90 (0.84─0.95) 0.001 0.87 (0.84─0.91) <0.001 0.92 (0.88─0.97) 0.001 0.85 (0.81─0.89) <0.001
Sex
Women 1 1 -
-Men 1.31 (1.11─1.54) 0.002 1.18 (1.06─1.32) 0.003 -
-Body mass index, per kg/m2 1.04 (1.02
─1.05) <0.001 1.04 (1.03─1.06) <0.001 1.05 (1.03─1.06) <0.001 1.04 (1.03─1.05) <0.001 Symptoms of depression
No 1 1 1
Yes 2.18 (1.70─2.79) <0.001 2.66 (2.21─3.21) <0.001 2.57 (2.05─3.22) <0.001 2.43 (1.99─2.97) <0.001
a
Acknowledgements
None.
Funding
This study was supported by a grant from South-East Norway Regional Health Authority, grant number 2004219.
Availability of data and materials
The data that support the findings of this study are available on request from the corresponding author [KS]. The data are not publicly available because of information that could compromise research participant privacy.
Authors’contributions
KJK and MBR designed the project. HAK contributed to planning, data collection, and data cleaning. KS conducted the analysis with support from MBR. KS, HAK and MBR drafted the manuscript. All authors contributed to the manuscript with critical revisions and suggestions. All authors approved the final manuscript.
Competing interests
The authors declare that they have no competing interests.
Consent for publication
Not applicable.
Ethics approval and consent to participate
The project was approved by The Regional Committees for Medical Research Ethics and the Norwegian Social Science Data Services.
Publisher’s Note
Springer Nature remains neutral with regard to jurisdictional claims in published maps and institutional affiliations.
Author details
1Head and Neck Research Group, Research Centre, Akershus University
Hospital, Lørenskog, Norway.2Institute of Clinical Medicine, Campus Akershus University Hospital, University of Oslo, Lørenskog, Norway.3Department of Pulmonary Medicine, Medical Division, Akershus University Hospital, Lørenskog, Norway.4Health Services Research Unit, Akershus University Hospital, Lørenskog, Norway.5Department of General Practice, University of Oslo, Oslo, Norway.6C3 Centre for Connected Care, Oslo University Hospital, Oslo, Norway.7BI Norwegian Business School, Oslo, Norway.
Received: 9 February 2017 Accepted: 7 March 2017
References
1. Lyngberg AC, Rasmussen BK, Jorgensen T, Jensen R (2005) Secular changes in health care utilization and work absence for migraine and tension-type headache: a population based study. Eur J Epidemiol 20(12):1007–1014 2. Russell MB, Rasmussen BK, Thorvaldsen P, Olesen J (1995) Prevalence and
sex-ratio of the subtypes of migraine. Int J Epidemiol 24(3):612–618 3. Russell MB, Levi N, Saltyte-Benth J, Fenger K (2006) Tension-type headache
in adolescents and adults: a population based study of 33,764 twins. Eur J Epidemiol 21(2):153–160
4. Jensen R, Stovner LJ (2008) Epidemiology and comorbidity of headache. Lancet Neurol 7(4):354–361
5. Grande RB, Aaseth K, Gulbrandsen P, Lundqvist C, Russell MB (2008) Prevalence of primary chronic headache in a population-based sample of 30- to 44-year-old persons. The Akershus study of chronic headache. Neuroepidemiology 30(2):76–83
6. Mitler MM, Carskadon MA, Czeisler CA, Dement WC, Dinges DF, Graeber RC (1988) Catastrophes, sleep, and public policy: consensus report. Sleep 11(1): 100–109
7. Roth T, Roehrs TA (1996) Etiologies and sequelae of excessive daytime sleepiness. Clin Ther 18(4):562–576, discussion 561
8. Leger D (1994) The cost of sleep-related accidents: a report for the national commission on sleep disorders research. Sleep 17(1):84–93
9. Briones B, Adams N, Strauss M, Rosenberg C, Whalen C, Carskadon M, Roebuck T, Winters M, Redline S (1996) Relationship between sleepiness and general health status. Sleep 19(7):583–588
10. Young T, Palta M, Dempsey J, Skatrud J, Weber S, Badr S (1993) The occurrence of sleep-disordered breathing among middle-aged adults. N Engl J Med 328(17):1230–1235
11. Duran J, Esnaola S, Rubio R, Iztueta A (2001) Obstructive sleep apnea-hypopnea and related clinical features in a population-based sample of subjects aged 30 to 70 yr. Am J Respir Crit Care Med 163(3 Pt 1):685–689 12. Bixler EO, Vgontzas AN, Lin HM, Calhoun SL, Vela-Bueno A, Kales A (2005) Excessive daytime sleepiness in a general population sample: the role of sleep apnea, age, obesity, diabetes, and depression. J Clin Endocrinol Metab 90(8):4510–4515
13. Stradling JR, Barbour C, Glennon J, Langford BA, Crosby JH (2000) Prevalence of sleepiness and its relation to autonomic evidence of arousals and increased inspiratory effort in a community based population of men and women. J Sleep Res 9(4):381–388
14. Stiefel F, Stagno D (2004) Management of insomnia in patients with chronic pain conditions. CNS Drugs 18(5):285–296
15. Young TB (2004) Epidemiology of daytime sleepiness: definitions, symptomatology, and prevalence. J Clin Psychiatry 65(Suppl 16):12–16 16. Leger D, Poursain B, Neubauer D, Uchiyama M (2008) An international
survey of sleeping problems in the general population. Curr Med Res Opin 24(1):307–317
17. Peres MF, Stiles MA, Siow HC, Silberstein SD (2005) Excessive daytime sleepiness in migraine patients. J Neurol Neurosurg Psychiatry 76(10):1467– 1468
18. Barbanti P, Fabbrini G, Aurilia C, Vanacore N, Cruccu G (2007) A case–control study on excessive daytime sleepiness in episodic migraine. Cephalalgia 27(10):1115–1119
19. Seidel S, Hartl T, Weber M, Matterey S, Paul A, Riederer F, Gharabaghi M, Wober-Bingol C, Wober C (2009) Quality of sleep, fatigue and daytime sleepiness in migraine - a controlled study. Cephalalgia 29(6):662–669 20. Barbanti P, Aurilia C, Egeo G, Fofi L, Vanacore N (2013) A case–control study
on excessive daytime sleepiness in chronic migraine. Sleep Med 14(3):278–281 21. Ødegård SS, Engstrøm M, Sand T, Stovner LJ, Zwart JA, Hagen K (2010)
Associations between sleep disturbance and primary headaches: the third Nord-Trondelag Health Study. J Headache Pain 11(3):197–206
22. Kim J, Cho SJ, Kim WJ, Yang KI, Yun CH, Chu MK (2016) Excessive daytime sleepiness is associated with an exacerbation of migraine: A population-based study. J Headache Pain 17(1):62
23. Russell MB, Kristiansen HA, Saltyte-Benth J, Kvaerner KJ (2008) A cross-sectional population-based survey of migraine and headache in 21,177 Norwegians: the Akershus sleep apnea project. J Headache Pain 9(6): 339–347
24. Society HCSotIH (2004) The International Classification of Headache Disorders: 2nd edition. Cephalalgia 24(Suppl 1):9–160
25. Johns MW (1991) A new method for measuring daytime sleepiness: the Epworth sleepiness scale. Sleep 14(6):540–545
26. Johns MW (1994) Sleepiness in different situations measured by the Epworth Sleepiness Scale. Sleep 17(8):703–710
27. Beiske KK, Kjelsberg FN, Ruud EA, Stavem K (2009) Reliability and validity of a Norwegian version of the Epworth sleepiness scale. Sleep Breath 13(1):65–72
28. Whooley MA, Avins AL, Miranda J, Browner WS (1997) Case-finding instruments for depression. Two questions are as good as many. J Gen Intern Med 12(7):439–445
29. Pallesen S, Nordhus IH, Omvik S, Sivertsen B, Tell GS, Bjorvatn B (2007) Prevalence and risk factors of subjective sleepiness in the general adult population. Sleep 30(5):619–624
30. Vgontzas A, Cui L, Merikangas KR (2008) Are sleep difficulties associated with migraine attributable to anxiety and depression? Headache 48(10): 1451–1459
31. Ancoli-Israel S, Roth T (1999) Characteristics of insomnia in the united states: results of the 1991 national sleep foundation survey. I. Sleep 22(Suppl 2): S347–353
32. Johns MW, Hocking B (1997) Daytime sleepiness and sleep habits of Australian workers. Sleep 20(10):844–849
33. Gander PH, Marshall NS, Harris R, Reid P (2005) The Epworth sleepiness scale: influence of age, ethnicity, and socioeconomic deprivation. Epworth sleepiness scores of adults in New Zealand. Sleep 28(2):249–253
35. Sander C, Hegerl U, Wirkner K, Walter N, Kocalevent RD, Petrowski K, Glaesmer H, Hinz A (2016) Normative values of the Epworth sleepiness scale (ESS), derived from a large German sample. Sleep Breath 20(4):1337–1345 36. Johns MW (1992) Reliability and factor analysis of the Epworth sleepiness
scale. Sleep 15(4):376–381
37. Olson LG, Cole MF, Ambrogetti A (1998) Correlations among Epworth sleepiness scale scores, multiple sleep latency tests and psychological symptoms. J Sleep Res 7(4):248–253
38. Chervin RD, Aldrich MS (1999) The Epworth Sleepiness Scale may not reflect objective measures of sleepiness or sleep apnea. Neurology 52(1):125–131 39. Furuta H, Kaneda R, Kosaka K, Arai H, Sano J, Koshino Y (1999) Epworth
sleepiness scale and sleep studies in patients with obstructive sleep apnea syndrome. Psychiatry Clin Neurosci 53(2):301–302
40. Rasmussen BK, Jensen R, Olesen J (1991) Questionnaire versus clinical interview in the diagnosis of headache. Headache 31:290–295
Submit your manuscript to a
journal and benefi t from:
7 Convenient online submission
7 Rigorous peer review
7 Immediate publication on acceptance
7 Open access: articles freely available online
7 High visibility within the fi eld
7 Retaining the copyright to your article