R E S E A R C H
Open Access
Study on coloring method of airport
flight-gate allocation problem
Hongyan Li
1, Xianfeng Ding
1*, Jiang Lin
1and Jingyu Zhou
2*Correspondence:[email protected]
1College of Science, Southwest Petroleum University, Chengdu, China
Full list of author information is available at the end of the article
Abstract
With the development of economy, more and more people travel by plane. Many airports have added satellite halls to relieve the pressure of insufficient boarding gates in airport terminals. However, the addition of satellite halls will have a certain impact on connecting flights of transit passengers and increase the difficulty of reasonable allocation of flight and gate in airports. Based on the requirements and data of question F of the 2018 postgraduate mathematical contest in modeling, this paper studies the flight-gate allocation of additional satellite halls at airports. Firstly, match the seven types of flights with the ten types of gates. Secondly, considering the number of gates used and the least number of flights not allocated to the gate, and adding the two factors of the overall tension of passengers and the minimum number of passengers who failed to transfer, the multi-objective 0–1 programming model was established. Determine the weight vectorw= (0.112, 0.097, 0.496, 0.395) of objective function by entropy value method based on personal preference, then the multi-objective 0–1 programming model is transformed into single-objective 0–1 programming model. Finally, a graph coloring algorithm based on parameter adjustment is used to solve the transformed model. The concept of time slice was used to determine the set of time conflicts of flight slots, and the vertex sequences were colored by applying the principle of “first come first serve”. Applying the model and algorithm proposed in this paper, it can be obtained that the average value of the overall tension degree of passengers minimized in question F is 35.179%, the number of flights successfully allocated to the gate maximized is 262, and the number of gates used is minimized to be 60. The corresponding flight-gate difficulty allocation weight is
α
= 0.32 andβ
= 0.40, and the proportion of flights successfully assigned to the gate is 86.469%. The number of passengers who failed to transfer was 642, with a failure rate of 23.337%.Keywords: Flight-gate allocation; Multi-objective 0–1 programming; Entropy value method; Graph coloring
1 Introduction
With the rapid development of economy, more and more people travel by air, which has caused a great impact on airports whose passenger flow has reached the saturation state. Thus, most airports add satellite hall S in the existing terminal T to relieve the pressure of insufficient boarding gates in the original terminal. However, the addition of satellite hall will cause some difficulties in connecting flights of transit passengers. Thus, how to sched-ule and plan flights at airports, optimize the allocation of boarding gates to the greatest
extent and reduce the transfer tension of transit passengers has become a hot issue in the civil aviation industry.
A stop at the gate is identified by the arrival flight and departure flight as a “departure”. Flight-gate allocation is the allocation of arriving and departing flights to the appropriate gate, which is affected by several factors, such as the density of flights arriving at the sta-tion, the number of flights, the type of airframe, the stopping time, etc., and the transit passenger is the passenger who transfers from the arriving flight to the departure flight executed by the same or different planes. Terminal T has complete international airport terminal functions, including departure, arrival, entry and exit and waiting. Satellite hall S is an extension of terminal T, which can wait for the flight and has no entry and exit func-tions. Terminal T and satellite hall S are both called terminal hall, and they are connected by MRT lines. The boarding gate in terminal T and satellite hall S is a fixed plane seat, whose functional properties are given in advance, and each flight can only be assigned to a boarding gate that matches its properties.
the three aspects of departure flights, inbound flights and inbound and outbound flights respectively. In 2014, Zeng et al. [11] established an allocation model, which took the min-imum total walking distance of passenger and the minmin-imum variance of average walking distance of passengers as the objective function, and achieved good results. In 2015, Wang [12] established a mixed set planning model for busy airports with the goal of maximizing the bridge ratio. This model includes rules such as model matching, aircraft towing, flight nature, and combination of aircraft positions, etc. Finally, the model and program were verified with an example.
Applying the requirements and data of question F of the 2018 postgraduate mathemati-cal contest in modeling, this paper takes into account the model matching between flights and boarding gates, the conflict between flights in arrival time, departure time and stay time, the priority of parking at the aircraft gate, and the overall tension of transfer passen-gers. An optimal flight-gate allocation model was established from the global perspective, and the flight-gate allocation graph coloring algorithm based on parameter adjustment was used to solve the established model.
The data used to support the findings of this study are available at the question F of the 2018 postgraduate mathematical contest in modeling website (https://cpipc.chinadegrees.
cn/cw/hp/4).
2 Flight-gate optimization allocation model
2.1 Problem description
In the flight-gate allocation at an airport,
(1) terminal T has 28 gates and satellite hall S has 41 gates.
(2) There is a MRT line between T and S, which takes 8 minutes each way, and the gap time between two planes assigned at the same gate must be greater than or equal to 45 minutes.
(3) All gates of T and S are allocated according to the overall planning. The functional properties of each gate include domestic/international, arrival/departure,
wide-body/narrow-body aircraft, etc.
(4) The arrival and departure of each aircraft must be allocated at the same gate, during which they cannot be moved elsewhere. The airport has another simple temporary seat for planes that cannot be allocated at a fixed gate to stop, assuming the number of temporary seats is unlimited.
(5) The process of transit passengers from the arrival of the previous flight to the departure of the next flight, which is combined into 16 different scenarios by domestic (D) and international (I), terminal (T) and satellite hall (S), and the shortest process time and MRT number of rides exist between these scenarios. (6) The transfer time of passengers is the sum of the shortest process time, MRT time
and travel time. It is required to minimize the number of boarding gates used when as many flights as possible are allocated to appropriate boarding gates and the minimum overall tension of transfer passengers is the primary factor.
Table 1 Boarding gate classification
Boarding gate type DDN IIN XXN DXN XDN DDW IIW XXW IXW XIW
Quantity 35 4 2 2 2 2 17 3 1 1
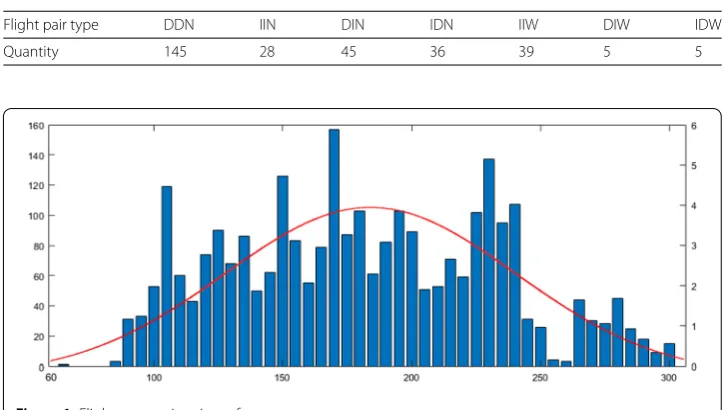
Table 2 Flight pair classification
Flight pair type DDN IIN DIN IDN IIW DIW IDW
Quantity 145 28 45 36 39 5 5
Figure 1Flight connection time of passengers
2.2 Model preparation 2.2.1 Partial data processing
The flight transfer plan and transit passenger information includes the three days of Jan-uary 19, 20, and 21, 2018. Only flights and passengers arriving on the 20th or departing on the 20th are analyzed here. Through MATLAB programming, the results show that there are 303 pairs of flights meeting the date requirements. There are 69 boarding gates in total. Thus, the results of boarding gates and flights are obtained through the above classification, as shown in Table1and Table2(X in the table refers to the mixed boarding gate, i.e. domestic flights and international flights can be docked).
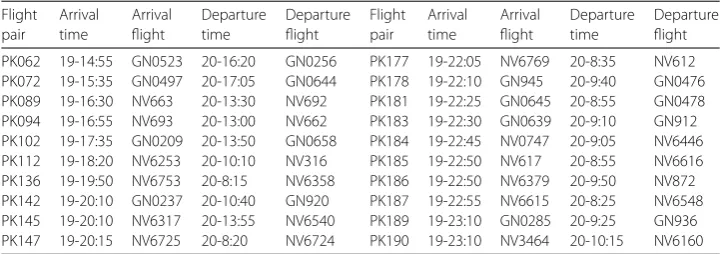
The connection time of all flight tickets on 20th is counted, and the distribution of pas-senger flight connection time is shown in Fig.1. For flights arriving on 20th or departing on 20th, if the arrival time and departure time are greater than or equal to 5 hours, stop the flight at the boarding gate after getting off the passengers, and stop the flight at the airport temporarily until the flight returns to the landing gate one hour before the flight (more than 45 minutes of free time between the two flights). Specific data of flights from boarding gate to temporary seat are shown in Table3. The horizontal coordinate repre-sents the flight connection time of passengers, and the left and right vertical coordinate respectively represents the corresponding number of passengers (people) and proportion (%).
2.2.2 Entropy value method
The weight is determined by the entropy value method based on personal preference [13]. The steps are as follows.
Table 3 Partial data of flights from gate to temporary seat Flight pair Arrival time Arrival flight Departure time Departure flight Flight pair Arrival time Arrival flight Departure time Departure flight
PK062 19-14:55 GN0523 20-16:20 GN0256 PK177 19-22:05 NV6769 20-8:35 NV612 PK072 19-15:35 GN0497 20-17:05 GN0644 PK178 19-22:10 GN945 20-9:40 GN0476 PK089 19-16:30 NV663 20-13:30 NV692 PK181 19-22:25 GN0645 20-8:55 GN0478 PK094 19-16:55 NV693 20-13:00 NV662 PK183 19-22:30 GN0639 20-9:10 GN912 PK102 19-17:35 GN0209 20-13:50 GN0658 PK184 19-22:45 NV0747 20-9:05 NV6446 PK112 19-18:20 NV6253 20-10:10 NV316 PK185 19-22:50 NV617 20-8:55 NV6616 PK136 19-19:50 NV6753 20-8:15 NV6358 PK186 19-22:50 NV6379 20-9:50 NV872 PK142 19-20:10 GN0237 20-10:40 GN920 PK187 19-22:55 NV6615 20-8:25 NV6548 PK145 19-20:10 NV6317 20-13:55 NV6540 PK189 19-23:10 GN0285 20-9:25 GN936 PK147 19-20:15 NV6725 20-8:20 NV6724 PK190 19-23:10 NV3464 20-10:15 NV6160
As the entropy value method based on personal preference [14] uses the ratio of a certain index of each scheme to the sum of the same index value, there is no dimen-sional influence and no need for standardized processing. If there are negative Num-bers in the data, the data needs to be non-negative processing. In addition, in order to avoid the nonsense of logarithm when calculating entropy value, data translation is re-quired.
For bigger is better and smaller is better, the indicators are
rij= xij–x
min
i xmaxi –xmin
i
+ 1 and rij= x
max
i –xij xmaxi –xmin
i
+ 1. (1)
Where, the nonnegative data is stillrij.
(2) The proportion of schemejin indexito this indexϕijis calculated byR= (rij)m×n.
ϕij= rij
m i=1rij
, i= 1, 2, . . . ,m,j= 1, 2, . . . ,n. (2)
(3) The output entropy of theievaluation indexϕij.
ψi= –K n
j=1
ϕijlnϕij, j= 1, 2, . . . ,n. (3)
(4) Entropy weight coefficient of each target [15].
wi= 1 –Hi
m–mi=1Hi, i= 1. (4)
2.3 Modeling
Objective function.
(1) The objective function to maximize the number of remaining boarding gates is
maxF1=maxX=max
n
k=1
xk. (5)
Where,xkis a 0–1 variable, indicating whether gatekis used. The specific expression is as follows
xk=
⎧ ⎨ ⎩
1 gatekis not in use,
0 gatekis used by flights. (6)
(2) The minimum number of flights not allocated to the gate is
minF2=min
m
i=1
fi. (7)
Where,fiis a 0–1 variable, indicating whether flightiis allocated to the boarding gate. The specific expression is as follows
fi=
⎧ ⎨ ⎩
1 flightiis not assigned to the gate,
0 flightihas been assigned to the gate. (8)
(3) Objective function with the objective of minimizing the overall tension of the transfer passengers.
Firstly, the formula of transfer tension is
Transfer tension=Passenger transfer time
Flight connection time, (9)
Passenger transfer time=minimum process time
+MRT time+walking time,
(10)
Connection time=departure time of last flight
–arrival time of previous flight.
(11)
Secondly, transfer time and flight connection time can be expressed as follows. Transfer time
T1= m
i=1 m
j=1 n
k=1 n
l=1
(cklyikyjl+μklyikyjl+ωklyikyjl). (12)
Flight connection time
Finally, the objective function [16] established is as follows.
minT1
T2 =min
m i=1 m j=1 n k=1 n l=1pij
(cklyikyjl+μklyikyjl+ωklyikyjl)
Dik–Rjl m
i=1
m j=1pij
. (14)
Where,cklrepresents the overall minimum process time for tourists to enter from
gatekand exit from gatel.cklis to match the elements in the matrixC= (ckl)69×69of
the shortest process time between terminal T and satellite hall S with pairs of 69 boarding gates.μklrepresents the MRT time when tourists enter from gatekand
leave from gatel, which is the element in MRT time matrixμ= (μkl)69×69.ωkl
represents the walking time of tourists entering from gatekand exiting from gatel, which is the element in the walking time matrixω= (ωkl)69×69.yikis a 0–1 variable,
indicating whether flightiis allocated to gatek.Dikrepresents the departure time of flightifrom gatek.Rjlrepresents the arrival time of flightjat gatel.
(4) The objective function [17] with the fewest number of unsuccessful passengers is
minF4=min
m i=1 m j=1 n k=1 n l=1
pij(1 –yik)(1 –yjl)
+pijyik(1 –yjl) +pij(1 –yik)yjl. (15)
Where,pijrepresents the number of passengers entering from flightiand leaving
from flightj.
Constraint condition.
(1) Applying the uniqueness of the gate used, the following constraints are established.
n+1
k=1
yik= 1. (16)
Where, the number of gates isn+ 1, and the extra 1 here represents the temporary slots set by the airport.yikis a 0–1 variable, indicating whether flightistays at gate
k. The specific expression is
yik=
⎧ ⎨ ⎩
1 flightistops at gatek,
0 flightidid not stop at gatek. (17)
(2) Applying the flight model corresponding to the gate model (only domestic D and international I are considered here, regardless of the width/narrowness of the body), the constraints are
Hi∈Gj. (18)
Where,Hrepresents the set of flight models, with a total of 7 models, denoted as
H={H1,H2, . . . ,Ht}.Grepresents the set of gate models, with a total of 10 models, denoted asG={G1,G2, . . . ,Gt}. Since there is a mixed gate situation, each element
Glin setGalso represents a set, which refers to the set of flight models that gatel
(3) In the statistical division of flight model and gate model, it is assumed that narrow flight model can be parked at the wide gate (wide flight model cannot be parked at the narrow gate) [18], which can greatly increase the use efficiency of the gate. The constraints are
cai–cgk+yikM≥0. (19)
Where, the value ofcaican be 1 and 2, representing narrow and wide types of flights, respectively. Values ofcgkcan also be 1 and 2, indicating the narrow and wide gate models, respectively.Mis a big enough positive number.
(4) Applying the constraints of whether flightiandjcan park at the same gate. If(Djk–Rik)(Dik–Rjk) > 0, we have
yik+yjk≤1. (20)
(5) Establish a constraint applying the safety interval time, that is, the interval between two adjacent flights parked at the same gate should be greater than or equal to the safety interval of 45 minutes, and the constraint is
(1 –zijk)M+Rjk–Dik≥45. (21)
Where,Rjkrepresents the arrival time of the flightjat gatek.Dikrepresents the
departure time of flightifrom gatek.zijkis a 0–1 variable, indicating that when
flightsiandjare assigned to gatekat the same time, whetheriis the previous flight thatjstops at the same gatek. The specific expression is
zijk=
⎧ ⎨ ⎩
1 iis the previous flight thatjstops at the same gatek,
0 other situations. (22)
Where,z0jk= 1represents stop at this gate on 19th, leave on 20th and stop at gatek. (6) Applying the constraints of the uniqueness of two consecutive flights at the same
gate. That is, two consecutive flights at the same gate and one flight at the same gate.
k∈S
i∈F
zijk= 1, yik+yjk– 2zijk≥0. (23)
The weight coefficient is determined as w = (0.112, 0.097, 0.496, 0.395) by entropy method [13] based on personal preference, and the final model [19] is obtained after weighted sum as follows
max 0.112 n
k=1
xk– 0.097 m i=1 fi – 0.496 m i=1 m j=1 n k=1 n l=1pij
(cklyikyjl+μklyikyjl+ωklyikyjl)
Dik–Rjl m i=1 m j=1pij – 0.395 m i=1 m j=1 n k=1 n l=1
pij(1 –yik)(1 –yjl) +pijyik(1 –yjl) +pij(1 –yik)yjl
Figure 2The flow chart of flight-gate assignment diagram coloring algorithm (a) ⎧ ⎪ ⎪ ⎪ ⎪ ⎪ ⎪ ⎪ ⎪ ⎪ ⎪ ⎪ ⎪ ⎪ ⎪ ⎨ ⎪ ⎪ ⎪ ⎪ ⎪ ⎪ ⎪ ⎪ ⎪ ⎪ ⎪ ⎪ ⎪ ⎪ ⎩
s.t.n+1k=1yik= 1,
Hi∈Gj,
cai–cgk+yikM≥0,
yik+yjk≤1,
(1 –zijk)M+Rjk–Dik≥45,
k∈S
i∈Fzijk= 1, yik+yjk– 2zijk≥0.
(24)
3 Solution of model
3.1 Design of graph coloring algorithm based on parameter adjustment
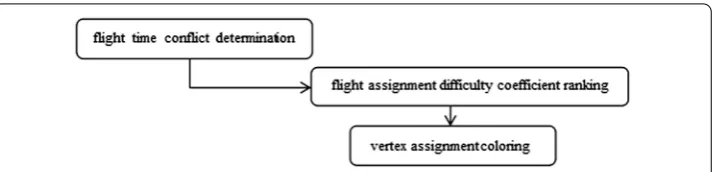
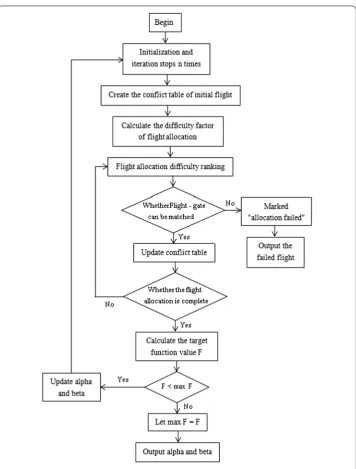
The flight-gate assignment graph coloring algorithm mainly includes three aspects [8]: flight time conflict determination, flight assignment difficulty coefficient ranking and ver-tex assignment coloring. The flow chart of flight-gate assignment diagram coloring algo-rithm is shown in Fig.2.
Firstly, the concept of time slice is introduced into the determination of flight time con-flict [9], and the time slice partition algorithm is adopted [4]. Secondly, “Difficulty coeffi-cient” is adopted to measure the difficulty of seat allocation [8]. The vertex sequence num-ber of each flight vertex can be obtained by sorting the difficulty coefficient of flight alloca-tion. Flights are sorted in descending order applying vertex sequence number from largest to smallest, thus obtaining the assignment order of flights from difficult to easy. That is, the descending order of flight vertices corresponds to the assignment order of flights from difficult to easy. Where the difficulty coefficient is defined asQi=αHi
¯
H+β
τi ¯
τ + (1 –α–β) κi
¯
κ.
Finally, coloring algorithm [20] is used to color each flight vertex. In order to search for the flight allocation scheme with the least occupied gate, differentαvalues are set repeatedly during the algorithm execution. By changing the value ofα, the weight of airframe types and conflicts in flight allocation can be adjusted, and the optimal scheme can be selected to reduce the number of gates occupied by flights.
Let the moment when flightistops using the gate beFi, and allFi constitute the end time setF={Fi|i= 1, 2, . . . ,N}. The specific algorithm steps are as follows.
Step 1. SetmaxF= 0 and initial values forαandβ(α+β< 1).
Step 2. Initialize the flight conflict table and calculate the flight assignment difficulty factor
Qi=αHi
¯
H +β τi
¯
τ + (1 –α–β) κi
¯
Figure 3The flow chart of flight-gate assignment diagram coloring algorithm (b)
Step 3. Arrange the flight assignment difficulty factor and choose the largestFi. If the largest is more than one, choose the first one by default.
Step 4. Go through all gateGjthat can park flightFi, and assign flights if no flights are scheduled in queueGj. On the contrary, find the flight conflict table to determine whether there is conflict with existing flights. If there is no conflict, allocate it. Otherwise, it cannot be allocated, and mark it as “allocation failed”.
Step 5. Update the flight conflict table, set the row and column ofFito 0, and recalculate the flight assignment difficulty factor.
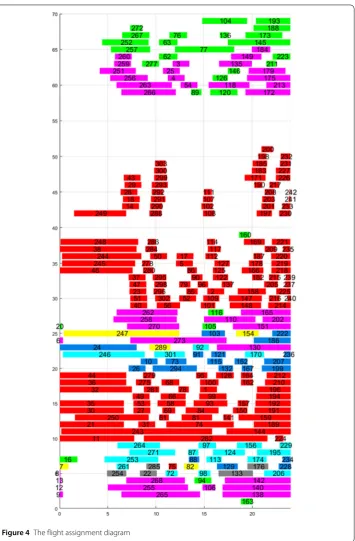
Figure 4The flight assignment diagram
Step 7. Calculate the objective function valueF, ifF<maxF, turn to step 8. Otherwise, setmaxF=Fand save the current values of alpha and beta.
Step 8. Stop afterniterations, otherwise update the value ofα,β. Step size increases and
βremains the same, whereα< 1 andβ< 1 –α. Return to step 2.
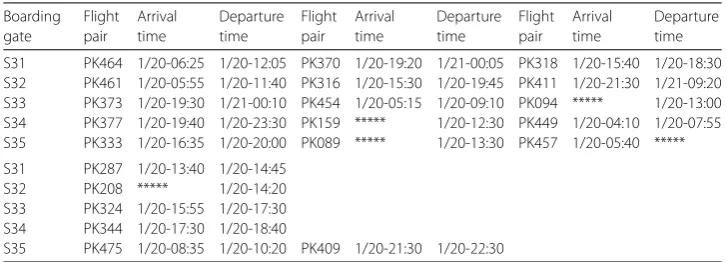
Table 4 Partial data of the detailed schedule of the boarding gate Boarding gate Flight pair Arrival time Departure time Flight pair Arrival time Departure time Flight pair Arrival time Departure time
S31 PK464 1/20-06:25 1/20-12:05 PK370 1/20-19:20 1/21-00:05 PK318 1/20-15:40 1/20-18:30 S32 PK461 1/20-05:55 1/20-11:40 PK316 1/20-15:30 1/20-19:45 PK411 1/20-21:30 1/21-09:20 S33 PK373 1/20-19:30 1/21-00:10 PK454 1/20-05:15 1/20-09:10 PK094 ***** 1/20-13:00 S34 PK377 1/20-19:40 1/20-23:30 PK159 ***** 1/20-12:30 PK449 1/20-04:10 1/20-07:55 S35 PK333 1/20-16:35 1/20-20:00 PK089 ***** 1/20-13:30 PK457 1/20-05:40 *****
S31 PK287 1/20-13:40 1/20-14:45 S32 PK208 ***** 1/20-14:20 S33 PK324 1/20-15:55 1/20-17:30 S34 PK344 1/20-17:30 1/20-18:40
S35 PK475 1/20-08:35 1/20-10:20 PK409 1/20-21:30 1/20-22:30
3.2 Solution of model
The flight-gate allocation scheme and the use time of the gate are obtained by solving the flight-gate allocation graph coloring algorithm based on parameter adjustment. From the optimized flight-gate allocation diagram, it can be seen that the mean overall tension of the minimum transfer passengers is 35.179%. The maximum number of flights success-fully allocated to the gate is 262 pairs, and the minimum number of gates used is 60. The corresponding flight-gate difficulty is assigned a weightα= 0.32,β= 0.40, and the corre-sponding ratio of successful boarding gates is 86.469%. The number of passengers who failed to transfer was 642, with a failure rate of 23.337%. The flight assignment diagram is shown in Fig.4, in which different colors represent different flight models, the horizontal coordinate represents the flight waiting time length, and the vertical coordinate represents the gate number. Partial data of the detailed schedule of the boarding gate are shown in Table4.
The number and proportion of flights successfully allocated to the gate are given by width and narrow-body aircraft respectively. It can be seen from the results in Fig.5that there are 49 and 213 flights with wide and narrow bodies respectively, and the probability of successful allocation of wide and narrow bodies is 100%and 83.858%respectively. The horizontal coordinate represents the body shape, and the left and right vertical coordi-nate respectively represents the successful allocation quantity and the successful alloca-tion proporalloca-tion.
After the optimization results are obtained, number of T and S gates used and average utilization rate of gates used (occupancy time ratio of gates) can be obtained by using MATLAB2018a software, as shown in Fig.6. The horizontal coordinate represents the terminal hall, and the left and right vertical coordinate respectively represents the number of T and S gates used and the average utilization rate.
Figure7shows the time-occupancy ratio at 69 gates, with blue and red representing gates at T and S terminals, respectively. The horizontal coordinate represents the gate number, and the vertical coordinate represents the time-occupancy ratio.
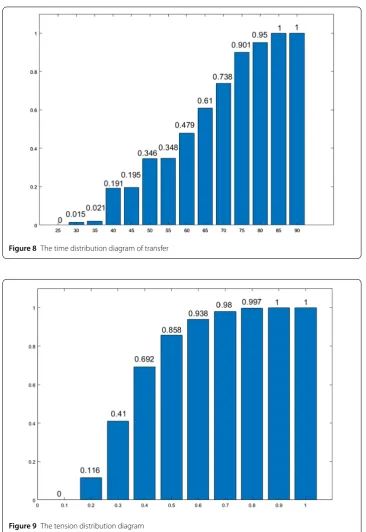
The time distribution diagram of overall passenger transfer is drawn at the 5-minute transfer time interval, as shown in Fig.8. The horizontal coordinate represents the transfer time, and the vertical coordinate represents the percentage.
Figure 5Number and probability of successful allocation of wide and narrow body machines
Figure 6The number of T and S gates used and the average utilization rate
Figure 7The time-occupancy ratio of each gate
4 Conclusion
Figure 8The time distribution diagram of transfer
Figure 9The tension distribution diagram
35.179%, the number of flights successfully assigned to the boarding gate is 262 pairs, the number of gates used is 60, and the number of passengers who fail to transfer is 642, with a failure rate of 23.337%. The results show that this model has great practical significance for solving the problem of flight-gate allocation.
Acknowledgements
At the point of finishing this paper, I’d like to express my sincere thanks to all those who have lent me hands in the course of my writing this paper. First of all, I’d like to take this opportunity to show my sincere gratitude to my supervisor, Mr Xianfeng Ding, who has given me so much useful advices on my writing, and has tried his best to improve my paper. Secondly, I’d like to express my gratitude to my classmates who offered me references and information on time. Without their help, it would be much harder for me to finish this paper.
Funding
There is no funding for this research.
Abbreviations
MRT, Mass Rapid Transit;Qi, The combined difficulty factor for flighti;α,β(0≤α≤1, 0≤β≤1), Weight;Hi, Types of international/domestic flights;H¯, Value of international and domestic flight crossover type;τi, Wide/narrow body flight type;τ¯, The value of the wide-body flight type;κi, Number of conflicts between flightiand other flights;κ¯, Maximum number of time conflicts.
Availability of data and materials
The data used to support the findings of this study are available at the question F of the 2018 postgraduate mathematical contest in modeling website (https://cpipc.chinadegrees.cn/cw/hp/4). Please contact author for data requests.
Competing interests
The authors declare that they have no competing interests.
Authors’ contributions
The main idea of this paper was proposed by LHY and DXF. LHY mainly carried out algorithm research and writing manuscripts. DXF is mainly responsible for supervising and revising papers. LJ is mainly responsible for algorithm research and software. ZJY is mainly responsible for software programming. All authors read and approved the final manuscript.
Author details
1College of Science, Southwest Petroleum University, Chengdu, China.2School of Computer Science, Southwest
Petroleum University, Chengdu, China.
Publisher’s Note
Springer Nature remains neutral with regard to jurisdictional claims in published maps and institutional affiliations.
Received: 30 June 2019 Accepted: 4 September 2019
References
1. Babic O, Teodorovic D, Tosic V. Air craft stand assignment to minimize walking. J Transp Eng. 1984;110(1):55–66. 2. Mangoubi RS, Mathaisel DFX. Optimizing gate assignments at airport terminals. Transp Sci. 1985;19(2):173–88. 3. Yan S, Huo C. Optimization of multiple objective gate assignments. Transp Res, Part A, Gen. 2001;35(5):413–32. 4. Wen J, Li B, Wang Q, Wen D. Graph coloring model and algorithm for airport parking space allocation. Appl Syst Eng
Theory Method. 2005;14(2):136–40.
5. Tian C, Xiong G. Airport gate position scheduling strategy based on genetic algorithm. Comput Eng. 2005;31(3):186–8.
6. Ju S, Xu L. Research on optimization problem of gate position assignment based on GSAA. J Transp Syst Eng Inf Technol. 2008;8(1):138–43.
7. Kong J. Research on modeling of airport gate position scheduling and genetic algorithm. 2008. 8. Jiang Y. Research on optimization of airport parking space allocation. Tianjin University. 2010. 9. Wen J. Genetic algorithm for airport gate position scheduling. Sci Technol Eng. 2010;10(1):135–9.
10. Li N. Simulation and optimization of airport gate allocation. Nanjing University of Aeronautics and Astronautics. 2013. 11. Zeng L, Jiang Y, Luo Y. Modeling of optimal assignment of gate position based on walking distance of passengers.
J Wuhan Univ Technol. 2014;38(4):895–9.
12. Wang Y. Research on the mixed set planning method for airport gate position scheduling in busy airports. Nanjing University of Aeronautics and Astronautics. 2015.
13. Ruan L, Zheng X. Interval multi-objective decision making method based on entropy weight. Stat Decis Mak. 2013;12:82–4.
14. Zhang H, Zhao J, Luo H, Xie X. Objective weight calculation method for multi-objective optimization based on personal preference. Control Decis Mak. 2014;29(8):1471–6.
15. Zheng H, Li N, Yang X. Load balancing algorithm for adaptive load index weight. Comput Eng Des. 2019;40(03):623–43.
17. Bouras A, Ghaleb MA, Suryahatmaja U.S., Salem A.M.. The airport gate assignment problem. Sci World J. 2014. 18. Qin H, Liao Z. Multi-target athlete tracking method based on the characteristics of competition environment.
Comput Eng Des. 2017;38(11):3173–8.
19. Li Q, Wang X. Multi-stage and multi-type equipment procurement decision-making model and solving algorithm. Comput Eng Des. 2016;37(11):3027–34.