O R I G I N A L R E S E A R C H
Open Access
Multi institutional quantitative phantom
study of yttrium-90 PET in PET/MRI: the
MR-QUEST study
Nichole M. Maughan
1, Mootaz Eldib
2,3, David Faul
4, Maurizio Conti
5, Mattijs Elschot
6, Karin Kne
š
aurek
7,
Francesca Leek
8, David Townsend
8, Frank P. DiFilippo
9, Kimberly Jackson
10, Stephan G. Nekolla
11,
Mathias Lukas
12,13, Michael Tapner
14,15, Parag J. Parikh
1*and Richard Laforest
16* Correspondence: [email protected] 1Department of Radiation
Oncology, Washington University School of Medicine, 4921 Parkview Place, Campus Box 8224, St. Louis, MO 63110, USA
Full list of author information is available at the end of the article
Abstract
Background:Yttrium-90 (90Y) radioembolization involves the intra-arterial delivery of radioactive microspheres to treat hepatic malignancies. Though this therapy involves careful pre-treatment planning and imaging, little is known about the precise location of the microspheres once they are administered. Recently, there has been growing interest post-radioembolization imaging using positron-emission
tomography (PET) for quantitative dosimetry and identifying lesions that may benefit from additional salvage therapy. In this study, we aim to measure the inter-center variability of90Y PET measurements as measured on PET/MRI in preparation for a multi-institutional prospective phase I/II clinical trial.
Eight institutions participated in this study and followed a standardized phantom filling and imaging protocol. The NEMA NU2-2012 body phantom was filled with 3 GBq of90Y chloride solution. The phantom was imaged for 30 min in listmode on a Siemens Biograph mMR non-TOF PET/MRI scanner at five time points across 10 days (0.3–3.0 GBq). Raw PET data were sent to a central site for image reconstruction and data analysis. Images were reconstructed with optimal
parameters determined from a previous study. Volumes of interest (VOIs) matching the known sphere diameters were drawn on the vendor-provided attenuation map and propagated to the PET images. Recovery coefficients (RCs) and coefficient of variation of the RCs (COV) were calculated from these VOIs for each sphere size and activity level.
Results:Mean RCs ranged from 14.5 to 75.4%, with the lowest mean RC coming from the smallest sphere (10 mm) on the last day of imaging (0.16 MBq/ml) and the highest mean RC coming from the largest sphere (37 mm) on the first day of imaging (2.16 MBq/ml). The smaller spheres tended to exhibit higher COVs. In contrast, the larger spheres tended to exhibit lower COVs. COVs from the 37 mm sphere were < 25.3% in all scans. For scans with≥0.60 MBq/ml, COVs were≤25% in spheres≥22 mm. However, for all other spheres sizes and activity levels, COVs were usually > 25%.
Conclusions:Post-radioembolization dosimetry of lesions or other VOIs≥22 mm in diameter can be consistently obtained (< 25% variability) at a multi-institutional level using PET/MRI for any clinically significant activity for90Y radioembolization.
Keywords:Yttrium-90, PET, PET/MRI, Radioembolization
Background
Yttrium-90 (90Y) radioembolization involves the intra-arterial delivery of radioactive
microspheres to primary or metastatic disease in the liver. 90Y decays primarily
with β− emission (mean 0.937 MeV, 64.2 h half-life, 2.5 mm mean soft tissue
pene-tration, 11 mm max tissue penetration) [1], allowing for high amount of radiation
dose within a well-confined region. The current commercially available micro-spheres, TheraSpheres (glass microspheres; BTG, London, UK) and SIR-Spheres (resin microspheres; Sirtex Medical, Sydney, Australia), were first approved in the USA by the Food and Drug Administration in 1999 and 2002 and received the
European CE mark in 2005 and 2002, respectively [2, 3]. Since then, 90Y
micro-sphere radioembolization has continued to grow as a third-line therapy for patients with some clinical trials into using this technology as a first-line therapy
concur-rent with FOLFOX-based chemotherapy [4]. While the use of 90Y microspheres to
treat cancer in the liver has been utilized for over 50 years [5], the treatment
plan-ning protocol from pre-treatment imaging to prescription activity calculation is not well optimized. Standard protocol does not allow for assessing the actual distribu-tion of the microspheres or for predicting the effectiveness of treatment or possible toxicity events without waiting for follow-up imaging studies at least 30 days after
treatment [6]. Patients who undergo 90Y radioembolization typically have poor
prognoses and earlier assessment of therapy immediately after injection could guide optimization of therapy.
Recently, there has been an interest in performing post-radioembolization imaging and dosimetry to assess the microsphere distribution and predict clinical outcomes. Early work involved Bremsstrahlung SPECT, utilizing the high Bremsstrahlung flux
from the β− emission of 90Y [7–9]. However, these images suffer from poor spatial
resolution, making it difficult to identify small areas of uptake and the heterogeneous
distribution of the microspheres [10, 11] as well as perform quantitative evaluation.
Early case studies found that the small positron yield (0.0032%) of 90Y was sufficient
for imaging the microsphere distribution by PET [12–14]. Since then, several
single-center studies have reported the ability to predict clinical outcomes using dosimetry
derived from90Y PET images following radioembolization in both primary liver cancer
[15] and metastatic colorectal cancer [16–18].
Multi-center clinical studies with quantitative end points, typically involves imaging a standard phantom to test quantitative accuracy and inter-center variability. Fahey et al. evaluated inter-center reproducibility and variability in a multi-center study involving
fluorine-18 (18F) on PET/CT [19]. Another similar study was performed by Willowson
et al. in the multi-center QUEST phantom study for measuring inter-site variability of
90
Y on PET/CT [20].
The purpose of this study is to measure both the inter- and intra-center
variabil-ity of quantitatively measuring 90Y on PET/MR in preparation for a multi-center
scanner with 90Y without extra uncertainty introduced by varying choices in recon-struction parameters.
Methods
A total of eight institutions across four countries participated in this phantom study. All sites followed a strict protocol for both filling and imaging the phantom. Three NEMA NU2-2012 image quality (IQ) body phantoms (PTW Freiburg GmbH, Freiburg, Germany) with vendor-provided foam cradles and positioning devices were shared between the eight institutions.
Phantom preparation
Before filling the phantom with activity, the volume of the background compartment was measured by its water weight.
3.6 GBq in 1.4 mL of90Y chloride solution (PerkinElmer, Waltham, MA) was shipped
to each institution. The supplier’s calibrated activity listed on the shipping document
was used as the “ground truth” for the activity within the vial. Each site recorded the
amount of activity reported by their department’s dose calibrator for comparison
against the reported amount on the shipping label. The manufacturer and model of
each site’s dose calibrator is listed in Table1.
The entire contents of the vial were completely emptied into 1300 mL of water with
100 mg of either DTPA or EDTA added to prevent binding of 90Y chloride to the walls
of the phantom. Activity was drawn from this solution to fill the six spheres (diameters 37, 28, 22, 17, 13, and 10 mm). Once all spheres were filled, the remaining solution was emptied into the background compartment of the NEMA IQ phantom, and the remaining volume of the background compartment was filled with water. This resulted in an approximately 8:1 sphere-to-background activity concentration ratio. The center lung insert for the phantom was a solid structure made of polyethylene material. The total recorded activity in the phantom was the total activity listed on the shipping document minus any residual activity in the vial and syringe.
Image acquisition and reconstruction
The phantom was imaged at five time points (day 0, day 3, day 5, day 7, and day 10) at each institution on Siemens Biograph mMR non-time-of-flight (non-TOF)
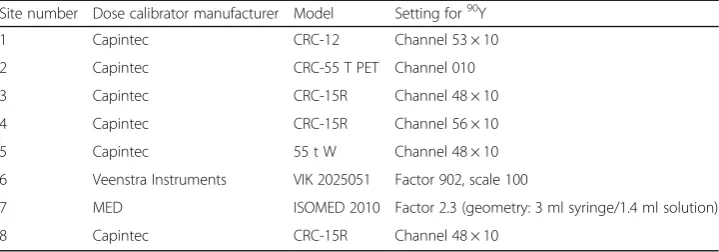
Table 1Dose calibrator and settings used at each site to measure90Y activity and verify against
that reported on shipping label
Site number Dose calibrator manufacturer Model Setting for90Y
1 Capintec CRC-12 Channel 53 × 10
2 Capintec CRC-55 T PET Channel 010
3 Capintec CRC-15R Channel 48 × 10
4 Capintec CRC-15R Channel 56 × 10
5 Capintec 55 t W Channel 48 × 10
6 Veenstra Instruments VIK 2025051 Factor 902, scale 100
7 MED ISOMED 2010 Factor 2.3 (geometry: 3 ml syringe/1.4 ml solution)
PET/MRI scanners, representing a range of total activities from 0.3 to 3.0 GBq. These values correspond to the full range of activities administered to patients treated with resin microspheres. The phantom was positioned in a foam cradle
with an accompanying positioning device, as described by Ziegler et al. [21], to
center the phantom in the field of view (FOV) and allow for reproducible place-ment of the phantom between scans and institutions. The phantom was imaged for 30 min in listmode acquisition in a single station. Due to the longer axial FOV of the Biograph mMR (25.6 cm), we are able to reduce the number of stations
compared to other scanners with a shorter FOV (e.g., 15–16 cm), which typically
require a minimum of two stations [20]. For post-radioembolization patients at our
clinic (WUSM), we acquire PET data in a single station. At one of the sites, three back-to-back PET acquisitions (same phantom filling) were performed to evaluate intra-center variability. Another site (Washington University, St. Louis, MO)
re-peated the phantom filling with 54.4 MBq fluorine-18 (18F) and imaged at a single
time point (15 min listmode acquisition) for comparison to a high statistic dataset.
This 18F dataset was also reconstructed into ten smaller datasets, consisting of 3 s
each of listmode data, to contain a similar amount of trues statistics to that seen
in the 90Y PET data. Those same ten data sets were reconstructed with additional
randoms added to the sinograms to obtain a similar randoms fraction as that
ob-served in the 90Y PET data. A detailed description of these methods are described
in [22]. This was to compare measurements from 18F data containing a similar
amount of trues count statistics as that exhibited in 90Y PET data on the highest
activity day of imaging.
All raw PET data were sent via a secure data server (ABX-CRO Advanced Pharmaceutical Services, Dresden, Germany) to a central site (Washington University, St. Louis, MO) for reconstruction and analysis by a single investigator (N.M.). All PET reconstructions were performed using e7tools, the offline research reconstruction software provided by Siemens, with a vendor-provided, CT-derived attenuation map of the NEMA 2007/IEC 2008 Body phantom for attenuation correction, as
described by Ziegler et al. [21] The attenuation map was manually inspected and
regis-tered for each PET data set since they were not measured directly from the PET/MRI scanner. Images were reconstructed with 3D ordinary Poisson ordered subset expectation maximization (OP-OSEM), with the following parameters determined from a previous phantom study: 3 iterations, 21 subsets, 5 mm full-width-half-maximum Gaussian post-reconstruction filter, point spread function (PSF) compensation, and using absolute
scat-ter correction with 4.17 × 4.17 × 2.03 mm3voxels [23].
Image post-processing and analysis
All image post-processing, including drawing volumes of interest (VOIs) and extracting statistics from those VOIs, was performed in MIM v6.6.7 (MIM Software, Cleveland,
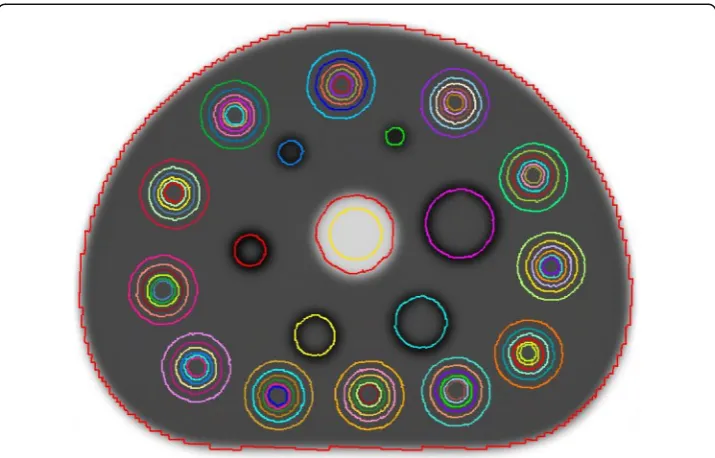
OH). VOIs were drawn on the attenuation map of the phantom (see Fig.1). The VOIs on
the spheres were drawn as spherical VOIs with a diameter matching the known sphere diameter. The VOIs with their corresponding purpose for quantitative assessment,
according to NEMA NU 2-2007 guidelines, are summarized in Table2. Each PET image
The recovery coefficients (RCs) for each of the fillable sphere and respective back-ground VOIs were calculated to assess accuracy of measurements, especially in regards to partial volume effects (PVE):
RCð Þ ¼% Am
At 100 ð1Þ
where Am is the measured mean activity concentration andAtis the true activity con-centration. The coefficient of variation (COV) of RCs for each hot sphere VOI and day of imaging (8 VOI measurements per COV) was used to quantify both inter- and intra-center variability:
COVi;nð Þ ¼% σμi;n
i;n100 ð2Þ
whereσi,nis the standard deviation andμi,nis the mean of RCs for a given sphere size
(i) and day of imaging (n).
Fig. 1Attenuation map of NEMA 2007/IEC 2008 body phantom with VOIs drawn around each of the six fillable spheres, 72 VOIs drawn in the background compartment, and a 28-mm diameter VOI drawn in the cold insert (center, yellow)
Table 2Quantities for volume of interest (VOI) analysis
VOI and size Measured quantity Purpose
Field of view (FOV) Total activity (GBq) Accuracy in total injected activity measurement
Fillable spheres: 37, 28, 22, 17, 13, 10 mm
Recovery coefficient of mean activity concentration (MBq/ml)
Accuracy in VOI measurements from partial volume effects Background spheres: 12 of 37-mm
diameters
Recovery coefficient of mean activity concentration (MBq/ml)
Accuracy in warm background VOI measurements
Background spheres: 12 each of 37-, 28-, 22-, 17-, 13-, 10-mm diameters
Standard deviation of mean activity concentration (MBq/ml)
Variability in warm background measurements (noise) Insert: 28-mm diameter, 160-mm length Mean activity concentration
(MBq/ml)
Background variability for each sphere sizes (BVs) for the highest activity day of
im-aging (12 measurements/site × 8 sites = 96 total VOIs) was calculated using
BVsð Þ ¼% σμs s
100 ð3Þ
where σs is the standard deviation of the 96 background concentration measurements for a given sphere sizes, andμsis the average of the 96 background concentration mea-surements for a given sphere sizes.
Activity in the cold insert (Ci) was quantified using
Cið Þ ¼% AAm;i
t;b 100 ð4Þ
where Am, i is the measured activity concentration in the cold insert, and At, b is the
true background activity concentration.
Results
Activities reported by each site’s dose calibrator were on average 3.62% lower than that
reported on the shipping label (median −4.95%, range−6.31–0.61%). Figure 2 shows
transaxial PET images through the center of the spheres from the first day of imaging for each site.
After visual inspection and manual registration between the attenuation maps and the PET data, adequate registration was obtained in all data sets. Most data sets required ap-proximately a few centimeters translation in the axial direction to properly align the attenu-ation map with the PET data. At some sites, the phantom was positioned in a reversed
direction or the center plate containing the spheres was rotated (Fig. 2), in which case a
rotation was required to properly align the attenuation map with the data.
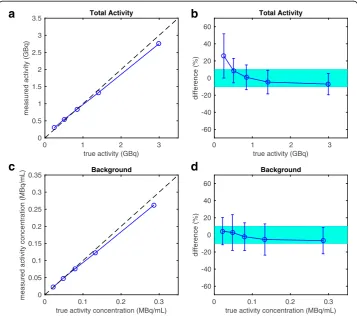
Figure 3a shows the measured activity versus true activity within the whole FOV
along the identity line, averaged across the eight sites, and Fig. 3b shows the percent
differences in total measured activity and true activity. The total activity measured
within the FOV had a median error of −0.63% across all activity ranges from all sites
(8 sites × 5 days of imaging = 40 measurements) (mean 4.71%, range −23.9–65.0%). All
average measurements of total activity were within ± 10% of true activity for activities≥
0.5 GBq. The lowest activity measurements (~ 0.3 GBq) overestimated the total activity
within the FOV on average by 25.8% (range−20.8–65.0%).
Figure3cshows the mean measured versus true activity concentration in the 37 mm
VOI in the warm background compartment of the phantom along the identity line, and
Fig. 3d shows the percent deviation in this background activity concentration. Mean
measured activity concentration had a median error of−1.68% across all activity ranges
from all sites (12 measurements/site × 5 imaging days × 8 sites = 480 measurements)
(mean−1.43%, range−31.3–32.1%).
true activity (GBq)
0 1 2 3
measured activity (GBq)
0 0.5 1 1.5 2 2.5 3
3.5 Total Activity
true activity (GBq) 0 1 2 3
difference (%)
-60 -40 -20 0 20 40 60
Total Activity
true activity concentration (MBq/mL) 0 0.1 0.2 0.3
measured activity concentration (MBq/mL) 0
0.05 0.1 0.15 0.2 0.25 0.3
0.35 Background
true activity concentration (MBq/mL) 0 0.1 0.2 0.3
difference (%)
-60 -40 -20 0 20 40 60
Background
a
b
c
d
Figure 4shows the noise in the PET imaging volumes, quantified by both the
back-ground variability (Eq. 3, Fig. 4a) and the signal intensity in the cold lung insert
nor-malized by the true background activity (Eq. 4, Fig. 4b). The median background
variability ranged from 6.48 to 32.2%, measured from the largest and the smallest spheres, respectively, across all sphere sizes (total of 576 warm background VOIs), with
a median variability of 16.5% (mean 16.7%). The median cold insert counts (Ci)
in-creased from 33.3 to 75.6% in the lung insert from 0.29 MBq/ml to the lower true ac-tivity concentrations of 0.02 MBq/ml. The median cold insert counts percentage across 40 PET imaging volumes was 45.3% of the true warm background activity
concentra-tion (mean 48.8%, range 23.9–104%). In comparison, the cold insert counts normalized
to warm background in the18F phantom image was 26%.
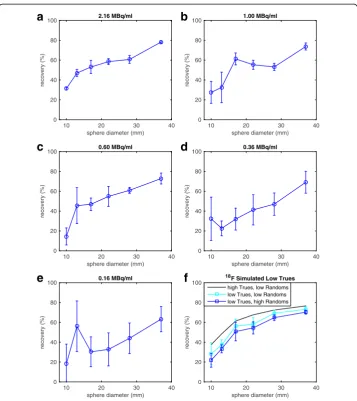
Figure 5 and Table 3 illustrate the RCs and variation of each sphere size averaged
over the different institutions. The inter-center variability of imaging with 90Y,
expressed as the standard deviation on the RC measured at the different sites, is shown on the graphs as the error bars. A comparative measurement done with the same
phan-tom but with high statistics18F is indicated as the solid line on the graphs. The median
RC for each hot sphere across all sites and activity concentrations (5 imaging days × 8 sites = 40 measurements per sphere) was 68.7, 52.4, 46.8, 41.8, 27.5, and 22.0% for the 37-, 28-, 22-, 17-, 13-, and 10-mm spheres, respectively. The highest mean RC for any given activity concentration and sphere size was 75.4%, measured on the 37-mm sphere at the highest activity (~ 2.16 MBq/ml). In contrast, the lowest mean RC for any given activity concentration and sphere size was 14.5%, measured from the 10-mm sphere at
the lowest activity level (~ 0.16 MBq/ml). Agreement with 18F measurements was best
for the largest sphere and at the two highest activity levels (1.00 and 2.16 MBq/ml of
90
Y), with deviation of−1.7 and −1.5%, respectively. Variability in measurements
in-creased with decreasing sphere size and decreasing activity.
Figure6a–eand Table4illustrate the RC variability obtained from one site (Norwegian
University of Science and Technology, Trondheim, Norway) who acquired three consecu-tive scans for each imaging day. The median RC for each hot sphere across the three scans and all activity concentrations (5 imaging days × 3 scans = 15 measurements per sphere) was 74.8, 56.9, 55.6, 47.2, 44.1, and 24.3% for the 37-, 28-, 22-, 17-, 13-, and 10-mm spheres, respectively. . At the highest activity level, variability between scans for all hot
sphere diameter (mm)
10 20 30 40
background variability (%)
0 20 40 60 80
100 Background
background activity concentration (MBq/mL)
0 0.1 0.2 0.3
% of background
0 20 40 60 80
100 Lung Insert
a
b
sphere diameter (mm)
10 20 30 40
recovery (%)
0 20 40 60 80
100 2.16 MBq/ml
90Y 18F
sphere diameter (mm)
10 20 30 40
recovery (%)
0 20 40 60 80
100 1.00 MBq/ml
90Y 18F
sphere diameter (mm)
10 20 30 40
recovery (%)
0 20 40 60 80
100 0.60 MBq/ml
90Y 18F
sphere diameter (mm)
10 20 30 40
recovery (%)
0 20 40 60 80
100 0.36 MBq/ml
90Y 18F
sphere diameter (mm)
10 20 30 40
recovery (%)
0 20 40 60 80
100 0.16 MBq/ml
90Y 18F
a
b
c
d
e
Fig. 5a–eRecovery coefficients as a function of hot sphere size from five different hot sphere activity concentrations across all sites. Each point represents the mean RC and error bars represent one standard deviation across the eight sites. The COV for each sphere size and hot sphere activity concentrations are shown in Table3. Measurements from one site’s18F measurements (54.4 MBq) are shown in black
Table 3Inter-center coefficient of variation (COV) of recovery coefficients (RCs) for each sphere
size and activity concentration
COV (%) (range)
Sphere diameter (mm) 2.16 MBq/ml 1.00 MBq/ml 0.60 MBq/ml 0.36 MBq/ml 0.16 MBq/ml 10 36.2 (14.0–48.6) 86.6 (6.18–99.8) 75.1 (7.79–51.7) 49.5 (9.83–45.1) 64.1 (2.63–26.9) 13 32.2 (23.5–59.8) 55.1 (18.0–68.3) 92.3 (12.5–112) 44.9 (13.6–49.6) 77.5 (3.47–65.5) 17 29.7 (18.9–69.1) 30.4 (30.3–78.0) 36.4 (27.5–75.8) 47.7 (20.5–75.0) 78.8 (14.7–118) 22 22.7 (41.2–84.1) 22.8 (29.6–63.4) 25.0 (32.6–70.0) 23.7 (30.5–56.1) 37.9 (10.4–49.4) 28 24.1 (42.9–88.1) 21.5 (41.7–80.3) 17.8 (38.0–65.3) 26.8 (26.8–69.6) 15.8 (26.8–46.9) 37 18.0 (56.0–95.0) 22.2 (52.0–103) 18.3 (54.9–92.2) 25.3 (46.4–91.4) 21.1 (45.2–81.3)
sphere diameter (mm)
10 20 30 40
recovery (%) 0 20 40 60 80
100 2.16 MBq/ml
sphere diameter (mm)
10 20 30 40
recovery (%) 0 20 40 60 80
100 1.00 MBq/ml
sphere diameter (mm)
10 20 30 40
recovery (%) 0 20 40 60 80
100 0.60 MBq/ml
sphere diameter (mm)
10 20 30 40
recovery (%) 0 20 40 60 80
100 0.36 MBq/ml
sphere diameter (mm)
10 20 30 40
recovery (%) 0 20 40 60 80
100 0.16 MBq/ml
sphere diameter (mm)
10 20 30 40
recovery (%) 0 20 40 60 80 100
18F Simulated Low Trues
high Trues, low Randoms low Trues, low Randoms low Trues, high Randoms
a
b
c
d
e
f
Fig. 6a–eRecovery coefficients as a function of hot sphere size from three consecutive scans at a single site. Each point represents the mean RC, and error bars represent one standard deviation. The COV for each sphere size and hot sphere activity concentrations are shown in Table4.fMeasurements from raw18F data (black line),18F data with similar90Y true count statistics (light blue square), and18F data with similar true count statistics and randoms fraction to90Y. Again, each point represents the mean RC and error bars represent one standard deviation across the ten 3-s18F datasets
Table 4Intra-center coefficient of variation (COV) of recovery coefficients (RCs) for each sphere
size and activity concentration
COV (%) (range)
Sphere diameter (mm) 2.32 MBq/ml 1.06 MBq/ml 0.65 MBq/ml 0.38 MBq/ml 0.17 MBq/ml 10 4.49 (29.7–32.3) 40.2 (20.8–40.2) 59.4 (8.71–24.3) 67.6 (14.4–56.6) 108 (4.42–40.9) 13 7.58 (44.1–51.0) 47.1 (22.6–50.2) 39.7 (27.2–63.3) 32.9 (16.6–30.9) 45.3 (29.1–79.6) 17 12.4 (48.8–60.6) 9.79 (57.5–68.1) 13.4 (40.4–53.0) 34.5 (21.6–43.5) 49.6 (15.6–45.7) 22 5.06 (55.6–61.5) 8.35 (50.2–59.2) 18.2 (43.4–62.0) 36.8 (27.8–57.7) 50.8 (14.5–47.1) 28 6.48 (56.2–63.7) 6.69 (49.9–57.0) 4.89 (58.9–64.3) 23.9 (34.9–56.9) 35.0 (27.2–57.4) 37 1.43 (77.0–79.0) 4.79 (70.1–77.1) 7.52 (66.6–77.0) 16.0 (56.6–77.4) 20.0 (53.9–77.7)
spheres was < 13% (mean 6.24%, median 5.77%, range 1.42–12.4%). All spheres≥17 mm
with≥0.60 MBq/ml had < 20% variability in their RCs. The 37-mm sphere had a
variabil-ity in measurements≤20% for all activity levels. Again, variability increased with
decreas-ing sphere size and decreasdecreas-ing activity. Table5lists the COV and range for these scans for
RC of total activity and background activity concentration and Civalues of the cold lung
insert. Variability tended to increase with decreasing activity for these VOIs as well, with
the exception of total activity, which tended to remain rather stable. Figure6f shows
mea-surements from the 18F phantom, reconstructed into smaller data sets with both trues
counts statistics and/or randoms fraction typically seen with90Y PET data from the
high-est activity imaging day. Total trues for these smaller 18F data sets were 2.07 × 10⁶and
those reported by one site for90Y were 1.54 × 10⁶. The randoms fraction for typical 18F
datasets was 31% and that for the simulated high-randoms was 77%. The randoms
frac-tion for90Y was approximately 75%.
Discussion
Despite the low positron yield from 90Y, PET imaging of this isotope has proven both
feasible and useful in previous literature [11–13, 15–17,23,24] and is further
demon-strated in this work. The results from this study and that reported by Willowson et al.
in the PET/CT QUEST study [20] also demonstrate the feasibility of performing
multi-institutional clinical studies focused on90Y PET-based dosimetry.
Even though this multi-institutional phantom study with 90Y PET imaging has been
performed previously on PET/CT [20], there are several key differences between
Sie-mens Biograph PET/CT scanners and SieSie-mens Biograph mMR (PET/MRI) scanners that motivate the need to perform this study on PET/MRI. First, the Biograph mMR utilizes avalanche photodiode (APD) detectors instead of typically used photomultiplier tubes (PMT), to allow for compatibility with the MR magnetic field. However, this comes at the cost of not having TOF capabilities. Additionally, compared to the Biograph PET/CT scanners, the mMR exhibits increased sensitivity due to the
geomet-rical arrangement of the detectors: 15.0 kcps/MBq) [25] versus 8.1 kcps/MBq on the
Biograph 40 (non-TOF) PET/CT [26]. As discussed previously, the difference in
sensi-tivities is due to a longer axial FOV and shorter ring diameter on the Biograph mMR
[23]. The tight geometry and wider coincidence timing window in mMR result in
higher random rates, but the smaller block size results in lower singles rate per detector
block in comparison to Siemens PET/CT scanners [23]. All of these factors (i.e.,
differ-ence in electronics and higher sensitivity from a different geometry), combined with low annihilation counts and high randoms rates from Bremsstrahlung radiation, make
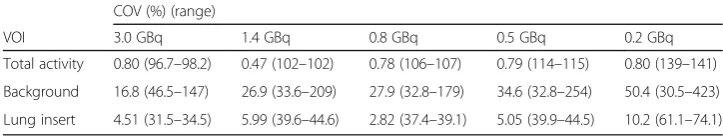
Table 5Intra-center coefficient of variation (COV) between three consecutive scans of recovery
coefficients (RCs) of total activity and background activity concentration and of counts in the cold lung insert (Ci) on each imaging day
COV (%) (range)
VOI 3.0 GBq 1.4 GBq 0.8 GBq 0.5 GBq 0.2 GBq
Total activity 0.80 (96.7–98.2) 0.47 (102–102) 0.78 (106–107) 0.79 (114–115) 0.80 (139–141) Background 16.8 (46.5–147) 26.9 (33.6–209) 27.9 (32.8–179) 34.6 (32.8–254) 50.4 (30.5–423) Lung insert 4.51 (31.5–34.5) 5.99 (39.6–44.6) 2.82 (37.4–39.1) 5.05 (39.9–44.5) 10.2 (61.1–74.1)
the similarity of the convergence properties of OSEM imaging reconstruction different between Biograph PET/CT and Biograph PET/MRI scanners. This was demonstrated in our previous phantom study, where we found that the optimal reconstruction parame-ters, using the same number of subsets, post-reconstruction filter size, and resolution recovery, were at three iterations on the mMR instead of two iterations for Biograph
PET/CT scanners, as suggested by Willowson et al. [20]. Therefore, it is necessary to
demonstrate the quantitative accuracy and test the variability between scanners on mMR, especially since this has not been done.
90
Y has high randoms rates (due to a high flux of Bremsstrahlung radiation) and low trues statistics (due to low annihilation counts); therefore, a careful handling of the randoms in the reconstruction proves essential in iterative reconstruction algo-rithms. In previous generations of OSEM, the pre-subtraction of randoms and
scatter results in significant bias [27, 28]. Siemens mMR uses 3D OP-OSEM with
PROMPTS+RANDOMS data acquisition, as done in Biograph mMR and mCT, there is no pre-subtraction of scatter or randoms estimates, and therefore the
algorithm bias is reduced [29]. However, in situations of very low counts such with
90
Y imaging, the convergence properties of the algorithm may be such that more iterations are needed at the expense of increased noise. In our phantom evaluation
[23], we limited the noise in the images by stopping after three 3D OP-OSEM
iter-ations (with 21 subsets resulting in 63 updates) and applying a 5 mm Gaussian
post-reconstruction filter. As shown in [23], images reconstructed with more
itera-tions and sharper filter resulted in unacceptably noisy images. The low count
sta-tistics and high randoms fraction for 90Y PET imaging are likely the cause of lower
count recovery compared to higher statistics 18F PET imaging. Evidence of this is
shown in Fig. 6f. Optimized image reconstruction algorithms, with extremely low
count statistics and high random counts, have yet to be resolved [20, 23, 30]. This
is an area of future research.
Recovery of the total activity within the whole FOV was consistent among sites, with most measurements within ± 10% of the true values, especially above 0.5 GBq. These values are consistent with those reported by Willowson et al. in the PET/CT QUEST
study for 19 Siemens Biograph TOF PET/CT scanners [20], though our reported
stand-ard deviation on the Biograph mMR at 0.5 GBq was slightly higher, likely due to a smaller number of sites. Our total activity results were closer in agreement with the expected activity than those reported for Siemens Biograph non-TOF PET/CT scanners in the same QUEST study, where mean error in the FOV at 0.5 GBq was approximately
+ 20% and standard deviation in this error was approximately ± 60% [20]. Our study
performed an extra scan at a lower activity level (0.3 GBq) that was not performed in the PET/CT QUEST study. The extra scan at a lower activity level represents the subset of patients who are administered the lowest activity available for resin microsphere treatment. Total activity measurements in this range were, on average, overestimated by > 20%, with a standard deviation reaching beyond ± 20%. This trend in overesti-mation of total activity with decreasing activity has been reported in previous studies
using both TOF and non-TOF Siemens Biograph PET/CT scanners [20,24]. A possible
since it is known that TOF reduces noise by reducing noise propagation in both
for-ward- and back-projections at each iteration [31].
Activity measurements in the warm background compartment of the phantom were excellent, with the mean error consistently < 10%. These values are consistent with those reported in the QUEST study for both the Siemens Biograph TOF (> 1 iteration, no post-reconstruction filter reconstructions only) and non-TOF PET/CT
(PROMPTS+RANDOMS reconstructions only) scanners [20]. The standard
devia-tions in our warm background measurements were also comparable to those re-ported in the QUEST PET/CT study. It is important to note that the background compartment of the phantom was intended to simulate the non-zero uptake of
normal liver parenchyma, as is commonly seen in clinical studies [15, 16]. Even
though liver tumors tend to take up higher concentrations of the 90Y microspheres,
which is the goal of radioembolization, the normal liver parenchyma often takes up some of the microspheres as well, albeit usually at a lower concentration. Thus, it was imperative to include warm background activity in the large compartment of the phantom in an attempt to simulate the clinical setting. In our experience, the
ratio of tumor:normal liver (“background”) activity concentrations varies from
pa-tient to papa-tient. Future work includes investigating the effects of tumor:background activity concentrations on image quality.
Noise in the PET imaging volumes was quantified by both the background variability
on the high activity day of imaging (~ 0.29 MBq/ml) (Eq.3) and the scatter/background
counts in the cold (no activity) lung insert of the phantom (Eq.4). Background
variabil-ity on the Biograph mMR was significantly lower than that reported for both the TOF and non-TOF Biograph PET/CT scanners in the QUEST study (16.7% mean versus ~ 30, 50, and 38% means for TOF and Gaussian post-reconstruction filter, TOF and no
post-reconstruction filter, and non-TOF reconstructions, respectively) [20]. However,
scatter counts in the lung insert from the mMR (49.0% mean) were higher than those from Biograph TOF PET/CT scanners (~ 30% mean) and non-TOF PET/CT scanners using PROMPTS+RANDOMS mode (~ 35% mean). They were, however, lower than those from Biograph non-TOF PET/CT scanners in NETTRUES mode (~ 60% mean)
[20]. A possible reason for the higher rate of scatter counts in the cold lung insert
com-pared to those reported by Willowson et al. could be due to fact that the attenuation maps from this study were vendor-provided, since attenuation maps of phantoms can-not be directly measured with MRI. Depending on the type of lung insert used in the vendor provided maps (styrofoam or solid), this could affect the attenuation properties and scatter estimates used in the reconstruction. However, private communication with a representative from Siemens confirmed that the vendor-provided attenuation map was measured from identical phantoms used in this study. Another possibility is that the difference in geometry of the Biograph mMR scanner (i.e., longer axial FOV) may allow for more scatter counts than the Biograph mCT or non-TOF PET/CT scanners.
Regardless, scatter counts are higher for any of these three scanners compared to 18F
when imaging 90Y. A possible explanation is that in very low count studies, the
low activity scan, the counts in the cold insert were approximately 76% of warm
back-ground, which is significantly higher than that measured for18F at 26%. At the highest
90
Y activity scan, cold insert counts was approximately 33% of warm background, much
closer to that of 18F. Higher residual scatter counts in cold areas may also explain why
hot sphere RCs for low total activity scans are much lower that for18F. Others have
in-vestigated incomplete convergence in these cold areas [32], and this remains an area of
active research.
Count recovery in the higher activity concentrated (hot) spheres was good, with mean RCs
ranging from approximately 30–75% on the highest activity imaging day (~ 2.16 MBq/ml).
These values are consistent with those from a previous ACR phantom study at two of the
institutions included in this study [23]. They are also consistent with those
reported for the same total activity level in the QUEST study for the Siemens Biograph TOF PET/CT scanners (two iterations, 5-mm Gaussian post-reconstruction
fil-ter) and better than those for the non-TOF PET/CT scanners (all reconstructions) [20].
RCs from90Y PET imaging were also lower than those from 18F PET imaging, with the
exception of the largest sphere size at the highest activity. We report lower18F RCs than
Willowson et al., who reported RCs approaching near 100% for the largest sphere [20].
Discrepancy in these measurements is likely due to a difference in the method for drawing VOIs: they used a region-growing approach, where VOIs were drawn at 50% of the max-imum value, whereas we used the known sphere diameter to draw VOIs. Using an attenu-ation map-based method for drawing VOIs, as opposed to a region-growing approach, is
known to decrease RCs in PET images [24]. Our method is more susceptible to partial
volume effects but is more representative of what is performed for individual lesion
dos-imetry. As is characteristic of PET imaging studies, whether using 90Y or a standard
isotope-like18F, RCs degraded with decreasing VOI size [21, 23, 24, 33,34]. Combining
this with the high noise, which is characteristic of 90Y PET images, it is apparent
from Fig. 2 that very small regions of high uptake (i.e., the smallest sphere) are
dif-ficult, if not impossible, to identify. This is a limitation that must be considered in
clinical applications of 90Y PET imaging when assessing microsphere uptake in
small lesions. RCs of any given hot sphere size also slightly decreased with
decreasing activity concentration, similar to previous phantom studies [20, 23].
Contributing factors to sub-optimal recovery, especially below 18F, could include
partial volume effects, low positron statistics, and high randoms rates. Low annihi-lation counts, and thus low trues rates, especially combined with high randoms rates, are limiting factors of OSEM reconstruction algorithms, as previously dis-cussed. Low trues rates are demonstrated as a contributing factor for poorer
recov-ery in Fig. 6f for even a standard isotope such as18F. However, this does not account for
the entire discrepancy between these two isotopes. Handling these combined factors in
it-erative reconstruction algorithms is an active area of research, not just in90Y PET imaging
[30] but also in gated-cardiac PET imaging where statistics are often low [35].
Inter-center variability, as quantified by the COV for each sphere size and activity
con-centration, was acceptable (< 25%) for sphere diameters≥22 mm and≥0.60 MBq/ml. For
the highest activity level, inter-center variability was < 23% for sphere diameters≥22 mm.
In the multi-institutional phantom study by Fahey et al., nine sites tested the variability of
imaging 18F on PET/CT using an ACR phantom in preparation for a multi-institutional
and 12 mm, respectively [19]. Though these values are lower than what we measured for
our comparably sized sphere VOIs, considering the noisy nature of90Y PET images, our
results offer promise for the ability to reliably perform multi-institutional clinical studies
of90Y PET-based dosimetry with the Siemens Biograph mMR.
Intra-center variability was also acceptable, < 7% for sphere diameters ≥22 mm,
which was lower than that reported by the QUEST study for the Biograph TOF PET/CT (5, 4, and 8% for sphere diameters 37, 28, and 22 mm, respectively) on
the highest activity imaging day (2.32 MBq/ml) [20]. Yet, for low activity
concen-trations, this variability increased significantly, and COVs of the spheres became comparable to those seen at a multi-institutional level, suggesting that inter-center variation at low activities is likely more due to scanner performance than experi-mental error. Conversely, the large variability seen at the inter-center level at even
the highest activity concentration (Fig. 5a–c) that is generally not present at the
intra-center level for these same activity concentration ranges (Fig. 6a–c) suggests
there could be discrepancies in the phantom preparation in addition to differences between individual scanner performance.
Several limitations exist with this study. As mentioned previously, we used a vendor-provided attenuation map since direct attenuation map acquisition of phan-toms is not accurate on PET/MRI scanners. A study by Ziegler et al. found that the MR-derived attenuation map of the NEMA image quality phantom, obtained from the Siemens Biograph mMR PET/MRI scanner, only captured the photon attenuation of water inside the phantom but failed to capture the plastic housing of the phantom itself, which significantly degraded both the quantitative accuracy and background variability of the PET images. Image quality was improved when a
CT-derived attenuation map of the phantom was used instead [21]. It is important
to note that this necessity for using a CT-derived attenuation map only applies to phantom studies and is not necessary for clinical studies. Since the attenuation maps were not measured directly from the PET/MRI scanner at the time of PET imaging, they had to be manually registered and verified to the PET volumes in order to incorporate into offline reconstruction. Manual registration of the attenu-ation map to the PET data may have introduced error during the reconstruction procedure since it is not an exact process; however, visual inspection confirmed satisfactory registration between the data sets. We attempted to further mitigate any re-positioning errors both at the intra- and inter-center level by using a phan-tom cradle and positioning device to replicate phanphan-tom placement in the scanner
between sites. Furthermore, since we were unable to image the phantom’s plastic
housing directly with MRI, we could not see if the spheres were filled completely;
thus, the “true” activities may have actually been overestimates of what was
PET/MRI scanners from other vendors, such as GE, were not included in this study due to a lack of other vendor sites at the time of conducting this study. Future work will test the performance of GE PET/MRI scanners.
Conclusions
90
Y PET measurements from Siemens Biograph mMR (PET/MRI) scanners are accept-able and reproducible at the multi-institutional level. This study may provide insight
into the minimum activity concentrations (≥0.60 MBq/ml) and VOI size (≥22 mm
diameter) for accurate and reproducible measurements across institutions. Performance is comparable to that of its TOF PET/CT counterpart and may suggest that
multi-institutional clinical studies of 90Y PET-based dosimetry using Siemens hybrid PET
scanners can include both PET/MRI and TOF PET/CT scanners, although MRI may offer additional advantages, such as superior soft-tissue contrast for easy delineation of liver lesions.
Abbreviations
18F:Fluorine-18; 3D: Three-dimensional;90Y: Yttrium-90; APD: Avalanche photodiode; COV: Coefficient of variation; CT: Computed tomography; DTPA: Diethylenetriaminepentaacetic acid; EDTA: Ethylenediaminetetraacetic acid; FOV: Field of view; IQ: Image quality; MRI: Magnetic resonance imaging; NEMA: National Electrical Manufacturers Association; OP-OSEM: Ordinary poisson ordered subset expectation maximization; PET: Positron-emission tomography; PSF: Point spread function; PVE: Partial volume effect; QUEST: Quantitative uptake evaluation in SIR-spheres therapy; RC: Recovery coefficient; SPECT: Single photon emission computed tomography; TOF: Time of flight; VOI: Volume of interest
Acknowledgements
We thank Sirtex Ltd. for funding this study, providing the phantom, filling supplies, and90Y chloride activity, and for funding scanner time.
Funding
The supplies, scanner activity, and publication costs of this study were provided by Sirtex Ltd.
Availability of data and materials
All data is stored at the Washington University School of Medicine, St. Louis, MO, USA.
Authors’contributions
All authors contributed to the data acquisition at their respective institutions. NM, ME, DF, MC, ME, FL, KK, and MT contributed to the design of this study. Data was reconstructed, processed, and analyzed by NM. The manuscript was written by NM. All authors have read and edited the manuscript and consented to its publication.
Ethics approval and consent to participate
This article does not contain any studies with human participants or animals performed by any of the authors.
Consent for publication Not applicable.
Competing interests
NM has received travel funds from Sirtex. DF, MC, and ML are employees of Siemens Healthineers. MT was a Research and Development manager of Sirtex at the time of data collection; he became an employee of ABX-CRO during manuscript preparation. Though this study was funded by Sirtex Ltd., the study was scientifically conducted independ-ently of said company. The other authors declare that they have no competing interests.
Publisher’s Note
Springer Nature remains neutral with regard to jurisdictional claims in published maps and institutional affiliations.
Author details
1
Department of Radiation Oncology, Washington University School of Medicine, 4921 Parkview Place, Campus Box 8224, St. Louis, MO 63110, USA.2Translational and Molecular Imaging Institute, Icahn School of Medicine at Mount
Sinai, 1470 Madison Ave, New York, NY 10029, USA.3Department of Biomedical Engineering, City College of New York, 160 Convent Ave, New York, NY 10031, USA.4Siemens Healthineers, Siemens Medical Solutions USA, Inc., 40 Liberty
Boulevard, Malvern, PA 19355-9998, USA.5Molecular Imaging, Siemens Healthineers, 810 Innovation Dr, Knoxville, TN 37932, USA.6Department of Circulation and Medical Imaging, Faculty of Medicine and Health Sciences, NTNU,
Technology and Research, National University of Singapore Clinical Imaging Research Centre, 14 Medical Drive, #B1-01, Singapore 117599, Singapore.9Department of Nuclear Medicine, Cleveland Clinic, Mail Code Jb3, 9500 Euclid Ave, Cleveland, OH 44195, USA.10NYU Medical Center, 333 E 38th St, New York, NY 10016, USA.11Klinik und Poliklinik für
Nuklearmedizin, TU München, Strasse 22, 81675, Munich, Germany.12Department of Nuclear Medicine,
Charité—Universitätsmedizin Berlin, Charitépl. 1, 10117 Berlin, Germany.13Siemens Healthcare GmbH, Berlin, Germany. 14
Sirtex Medical Ltd, Level 33, 101 Miller St, North Sydney, NSW 2060, Australia.15ABX-CRO Advanced Pharmaceutical Services, 1 Begonia Road, Normanhurst, NSW 2076, Australia.16Mallinckrodt Institute of Radiology, Washington
University School of Medicine, 510 S. Kingshighway, Campus Box 8225, St. Louis, MO 63110, USA. Received: 30 October 2017 Accepted: 16 February 2018
References
1. Murthy R, Kamat P, Nuñez R, Salem R. Radioembolization of Yttrium-90 microspheres for hepatic malignancy. Semin Interv Radiol. 2008;25(1):48–57.https://doi.org/10.1055/s-2008-1052306.
2. Pasciak AS, Bradley Y, JM MK. Handbook of radioembolization. Physics, Biology, Nuclear Medicine, and Imaging. CRC Press. 2016;
3. Salem R, Thurston KG. Radioembolization with 90Yttrium microspheres: a state-of-the-art brachytherapy treatment for primary and secondary liver malignancies. Part 1: technical and methodologic considerations. J Vasc Interv Radiol. 2006;17(8):1251–78.
4. van Hazel GA, Heinemann V, Sharma NK, Findlay MPN, Ricke J, Peeters M, et al. SIRFLOX: randomized phase III trial comparing first-line mFOLFOX6 (plus or minus bevacizumab) versus mFOLFOX6 (plus or minus bevacizumab) plus selective internal radiation therapy in patients with metastatic colorectal cancer. J Clin Oncol. 2016;34(15):1723–31.
https://doi.org/10.1200/JCO.2015.66.1181.
5. Salem R, Hunter RD. Yttrium-90 microspheres for the treatment of hepatocellular carcinoma: a review. International Journal of Radiation Oncology*Biology*Physics. 2006;66(2, Supplement):S83–S8.
https://doi.org/10.1016/j.ijrobp.2006.02.061.
6. Atassi B, Bangash AK, Bahrani A, Pizzi G, Lewandowski RJ, Ryu RK, et al. Multimodality imaging following 90Y radioembolization: a comprehensive review and pictorial essay. Radiographics. 2008;28(1):81–99.
https://doi.org/10.1148/rg.281065721.
7. Sarfaraz M, Kennedy AS, Lodge MA, Li XA, Wu X, Yu CX. Radiation absorbed dose distribution in a patient treated with yttrium-90 microspheres for hepatocellular carcinoma. Med Phys. 2004;31(9):2449-53.https://doi.org/10.1118/ 1.1781332.
8. Eaton BR, Kim HS, Schreibmann E, Schuster DM, Galt JR, Barron B et al. Quantitative dosimetry for yttrium-90 radionuclide therapy: tumor dose predicts fluorodeoxyglucose positron emission tomography response in hepatic metastatic melanoma. J Vasc Interv Radiol. 2014;25(2):288-95.https://doi.org/10.1016/j.jvir.2013.08.021.
9. Kokabi N, Galt JR, Xing M, Camacho JC, Barron BJ, Schuster DM et al. A simple method for estimating dose delivered to hepatocellular carcinoma after yttrium-90 glass-based radioembolization therapy: preliminary results of a proof of concept study. J Vasc Interv Radiol. 2014;25(5):277-87.https://doi.org/10.1016/j.jvir.2013.11.007. 10. Kao YH, Steinberg JD, Tay YS, Lim GK, Yan J, Townsend DW, et al. Post-radioembolization yttrium-90 PET/CT—part
1: diagnostic reporting. EJNMMI Res. 2013;3(1):56.https://doi.org/10.1186/2191-219x-3-56.
11. Elschot M, Vermolen BJ, Lam MGEH, de Keizer B, van den Bosch MAAJ, de Jong HWAM. Quantitative comparison of PET and Bremsstrahlung SPECT for imaging the in vivo yttrium-90 microsphere distribution after liver radioembolization. PLoS One. 2013;8(2):e55742.https://doi.org/10.1371/journal.pone.0055742.
12. Lhommel R, van Elmbt L, Goffette P, Van den Eynde M, Jamar F, Pauwels S, et al. Feasibility of 90Y TOF PET-based dosimetry in liver metastasis therapy using SIR-spheres. Eur J Nucl Med Mol Imaging. 2010;37(9):1654–62.
https://doi.org/10.1007/s00259-010-1470-9.
13. Gates VL, Esmail AA, Marshall K, Spies S, Salem R. Internal pair production of 90Y permits hepatic localization of microspheres using routine PET: proof of concept. Journal of nuclear medicine : official publication, Society of Nuclear Medicine. 2011;52(1):72–6.https://doi.org/10.2967/jnumed.110.080986.
14. D'Arienzo M, Filippi L, Chiaramida P, Chiacchiararelli L, Cianni R, Salvatori R, et al. Absorbed dose to lesion and clinical outcome after liver radioembolization with 90Y microspheres: a case report of PET-based dosimetry. Ann Nucl Med. 2013;27(7):676–80.https://doi.org/10.1007/s12149-013-0726-4.
15. Kao YH, Steinberg JD, Tay YS, Lim GK, Yan J, Townsend DW, et al. Post-radioembolization yttrium-90 PET/CT—part 2: dose-response and tumor predictive dosimetry for resin microspheres. EJNMMI Res. 2013;3(1):57.
https://doi.org/10.1186/2191-219x-3-57.
16. Fowler KJ, Maughan NM, Laforest R, Saad NE, Sharma A, Olsen J, et al. PET/MRI of hepatic 90Y microsphere deposition determines individual tumor response. Cardiovasc Intervent Radiol. 2016;39(6):855–64.
https://doi.org/10.1007/s00270-015-1285-y.
17. van den Hoven AF, Rosenbaum CE, Elias SG, de Jong HW, Koopman M, Verkooijen HM, et al. Insights into the dose-response relationship of radioembolization with resin 90Y-microspheres: a prospective cohort study in patients with colorectal cancer liver metastases. Journal of nuclear medicine : official publication, Society of Nuclear Medicine. 2016;57(7):1014–9.https://doi.org/10.2967/jnumed.115.166942.
18. Willowson KP, Hayes AR, Chan DLH, Tapner M, Bernard EJ, Maher R et al. Clinical and imaging-based prognostic factors in radioembolisation of liver metastases from colorectal cancer: a retrospective exploratory analysis. EJNMMI Res. 2017;7(1):46.https://doi.org/10.1186/s13550-017-0292-1.
19. Fahey FH, Kinahan PE, Doot RK, Kocak M, Thurston H, Poussaint TY. Variability in PET quantitation within a multicenter consortium. Med Phys. 2010;37(7):3660–6.https://doi.org/10.1118/1.3455705.
21. Ziegler S, Jakoby BW, Braun H, Paulus DH, Quick HH. NEMA image quality phantom measurements and attenuation correction in integrated PET/MR hybrid imaging. EJNMMI Physics. 2015;2(18)https://doi.org/10.1186/s40658-015-0122-3. 22. Maughan NM, Parikh PJ, Laforest R. Low trues statistics and high randoms rates degrade quantitative accuracy in
PET iterative reconstruction methods. Nucl Sci Symp-Med Imaging Conference. 2016:M16F–9.http://2016.nss-mic. org/images/program/AbstractBook.pdf.
23. Maughan NM, Eldib M, Conti M, Knešaurek K, Faul D, Parikh PJ, et al. Phantom study to determine optimal PET reconstruction parameters for PET/MR imaging of 90 Y microspheres following radioembolization. Biomedical Physics & Engineering Express. 2016;2(1):015009.
24. Willowson K, Forwood N, Jakoby BW, Smith AM, Bailey DL. Quantitative (90)Y image reconstruction in PET. Med Phys. 2012;39(11):7153–9.https://doi.org/10.1118/1.4762403.
25. Delso G, Furst S, Jakoby B, Ladebeck R, Ganter C, Nekolla SG, et al. Performance measurements of the Siemens mMR integrated whole-body PET/MR scanner. Journal of nuclear medicine : official publication, Society of Nuclear Medicine. 2011;52(12):1914–22.https://doi.org/10.2967/jnumed.111.092726.
26. Jakoby BW, Bercier Y, Watson CC, Bendriem B, Townsend DW. Performance characteristics of a new LSO PET/CT scanner with extended axial field-of-view and PSF reconstruction. IEEE Trans Nucl Sci. 2009;56(3):633–9.
https://doi.org/10.1109/TNS.2009.2015764.
27. Grezes-Besset L, Nuyts J, Boellard R, Buvat I, Michel C, Pierre C et al., editors. Simulation-based evaluation of NEG-ML iterative reconstruction of low count PET data. 2007 IEEE nuclear science symposium conference record; 2007 Oct. 26 2007-Nov. 3 2007.
28. van Velden FHP, Kloet RW, van Berckel BNM, Lammertsma AA, Boellaard R. Accuracy of 3-dimensional reconstruction algorithms for the high-resolution research tomograph. J Nucl Med. 2009;50(1):72–80. 29. Comtat C, Bataille F, Michel C, Jones JP, Sibomana M, Janeiro L et al., editors. OSEM-3D reconstruction strategies
for the ECAT HRRT. IEEE Symp Conference Record Nucl Sci 2004. 2004;6:3492-96.https://doi.org/10.1109/NSSMIC. 2004.1466639.
30. Carlier T, Willowson KP, Fourkal E, Bailey DL, Doss M, Conti M. (90)Y -PET imaging: exploring limitations and accuracy under conditions of low counts and high random fraction. Med Phys. 2015;42(7):4295–309.
https://doi.org/10.1118/1.4922685.
31. Vandenberghe S, Mikhaylova E, D’Hoe E, Mollet P, Karp JS. Recent developments in time-of-flight PET. EJNMMI Physics. 2016;3(1):3.https://doi.org/10.1186/s40658-016-0138-3.
32. Rahmim A, Cheng JC, Blinder S, Camborde ML, Sossi V. Statistical dynamic image reconstruction in state-of-the-art high-resolution PET. 2005(0031-9155 (Print)).
33. Attarwala AA, Molina-Duran F, Büsing K-A, Schönberg SO, Bailey DL, Willowson K, et al. Quantitative and qualitative assessment of yttrium-90 PET/CT imaging. PLoS One. 2014;9(11):e110401.https://doi.org/10.1371/journal.pone.0110401. 34. Soderlund AT, Chaal J, Tjio G, Totman JJ, Conti M, Townsend DW. Beyond 18F-FDG: characterization of PET/CT
and PET/MR scanners for a comprehensive set of positron emitters of growing application—18F, 11C, 89Zr, 124I, 68Ga, and 90Y. J Nucl Med. 2015;56(8):1285-9. https://doi.org/10.2967/jnumed.115.156711.
35. Martinez-Möller A, Zikic D, Botnar RM, Bundschuh RA, Howe W, Ziegler SI, et al. Dual cardiac–respiratory gated PET: implementation and results from a feasibility study. Eur J Nucl Med Mol Imaging. 2007;34(9):1447–54.